The stock market: India
This is a collection of articles archived for the excellence of their content. Readers will be able to edit existing articles and post new articles directly |
History
1875-Jan 2021

From: Payal Bhattacharya, January 22, 2021: The Times of India
See graphic:
The stock market in India, 1875-Jan 2021
2005-2020: the top performers

From: January 22, 2019: The Times of India
See graphic:
2005-2020- The stock market- top performers
Introduction
How stock markets really work
September 3, 2018: The Times of India

From: September 3, 2018: The Times of India
Reliance crossed 8 trillion in market capitalisation, while the US market clocked a historic 3,453 days of a bull run as stock markets grabbed headlines across the world. A look at the history and the working of the markets…
Recently Reliance industries crossed market cap of Rs 8 lakh crore. Who owns this wealth?
Market capitalisation or value is the price of individual shares multiplied by total number of shares in the issue. Companies have a dominant shareholder, which can be the government or some promoting group or a business family. Remaining shares are held by institutions (LIC, mutual funds and so on) and individuals. In Reliance’s case 47.35% of shares is held by promoter and promoter groups while institutions hold about 36% of shares.
Does the index include the market cap of all companies listed in the BSE?
No, only 30 scrips are selected whose market caps are used to calculate the value of the Sensex. The scrip selection generally takes into account a balanced representation of the listed companies in the exchange. There are other broad-based indices like BSE 100 and BSE 200 that include higher number of scrips. In terms of number of listed companies, BSE is the world’s largest stock exchange.
How is the value of Sensex calculated?
The index helps compare present-day share prices with the past to show how the market is moving. Sensex’s base year is 1978-79. This means the value of the index was equated to 100 for that year. After fixing base year market capitalisation (price of individual shares multiplied by total shares in the issue) was calculated. The present value is arrived at by calculating present market value, dividing it by base year market value, and multiplied by base index value: 100 in this case. Shares held by government or promoter are generally not traded. So Sensex has to be adjusted for free float market-cap value. This means the index is calculated on publicly-traded shares. So a company with large market cap but few publicly traded shares cannot influence it.
When did share trading start in India?
The concept of incorporated companies and share trading started in the 1840s in India. Initially facilitated by unregistered brokers, it led to India’s first market boom and bust. The US Civil War saw supply of cotton to British mills slashed while companies trading in Indian cotton profited. This led to a bull run that started in 1861 and went bust after the 1865 surrender of Confederate General Robert Lee to Union General Ulysses S Grant. India’s first stock market, the Bombay Stock Exchange, was set up in 1875 and the Sensex launched in 1986.
Stock exchanges, globally and in India: a primer
February 12, 2018: The Times of India

From: February 12, 2018: The Times of India

From: February 12, 2018: The Times of India

From: February 12, 2018: The Times of India
How old is the idea of a stock exchange?
Vasco da Gama’s discovery of the sea route to India opened up a market for the highly profitable spice trade that Europe’s traders wanted to be a part of. But the business was risky and required huge investment. That led to the idea of joint stock companies and the Dutch East India Company was born. It raised money by selling its shares to public in a stock exchange and became the world’s first listed public company.
When did share trading start in India?
In India, the concept of incorporated companies and share trading started in the 1840s. Initially, it was facilitated by unregistered brokers leading to India’s first stock market boom and bust that coincided with the American Civil War (1861-1865). The boom was triggered by cotton stocks following disruption of supplies to Britain from the US. India’s first stock market — Bombay Stock Exchange (BSE) — was established in 1875. Its famous barometer, Sensex, was launched in 1986.
How is the value of Sensex calculated?
The index facilitates comparison of present day share prices with the past to show how the market is moving. 1978-79 is Sensex’s base year. This means the index’s value was equated to 100 for that year. After fixing the base year, market capitalisation — price of individual shares multiplied by total number of shares in the issue — was calculated. The present value is arrived at by calculating present market capitalisation and dividing it by the base year’s market capitalisation, which is then multiplied by the base index value — 100 in this case. On domestic market capitalisation, BSE is the world’s 11th largest stock exchange.
Does a listed company trade every share in the market?
Not necessarily because most companies have a dominant shareholder — government or a promoting group/ business family and hence, these shares are never traded in the market. Sensex is also adjusted for free float market capitalisation value meaning it’s calculated on the basis of publicly traded shares. Thus, a big company with large market capitalisation and few publicly traded shares cannot influence the index.
Does the index include market cap of all companies listed in the BSE?
No. Only 30 scrips are selected whose market caps are used to calculate the Sensex’s value. This is to have balanced representation of listed companies. Other indices like BSE 100 and BSE 200 include a higher number of scrips. In terms of number of listed companies, BSE is the world’s largest stock exchange.
Does a falling market mean all stocks are in decline?
No. Even during a crash some stocks may not fall. For instance, on February 9, the market fell about 407 points. There were 2,910 stocks traded that day. Among them, 1,369 (40%) advanced, 1,403 (48%) declined and 138 (about 5%) remained unchanged.
Is the market extremely volatile?
A crash can wipe out millions in stock value in seconds. Analysis of 11 years’ data for major markets shows that most (except Shanghai) witnessed their biggest crash in 2008.
The Year-wise position
The 1960s to 2015: historical changes
Janakbhai: From GD Birla to JRD to Premji
Partha Sinha The Times of India Mar 05 2015
An investor's journey from the time when Indians could own foreign stocks -including Pakistani -and shares were bought for dividend yield, to the current future-prospects investment environment In the mid 1960s, a 10year-old boy would alight from a car in front of Bombay House -the Tata Group's headquarters here -and go in to attend AGMs of Tata companies. As instructed by family elders, Janak Mathuradas would sit quietly at the back and listen to J R D Tata, then chairman of the group, as he held forth on its prospects, current & future.Janak's routine was similar when it came to AGMs of Birla group companies, then headed by G D Birla.
Today , Janak, 64, is known as one of the minority shareholders who persuaded Wipro chairman Azim Premji to not delist the company's FMCG business, so that old shareholders like him could continue to be part of the Wipro investor community . His ability to persuade Premji to change his mind comes from the long relationships investor families like his built with the old businesses of India. Like for other Dalal Street regulars of that time, for young Janak too, JRD was Tata Saheb and GD Birla was GD babu. Ratan Tata, who later succeeded JRD and was then an apprentice with Nelco, was Ratan seth. For Janak, three generations of whose family had invested in the stock market, AGMs and meeting with the Indian business blue blood was routine.
Encouraged by JRD, who wanted young people to enter the market, Janak tracked the companies his family invested in closely just as today's analysts do. His late father, Mathuradas Morarji, had taught him how to analyse balance sheets. Then, in 1977, on a circular ticket costing Rs 270, he travelled on the inaugural journey of the Mumbai-Kolkata Geetanjali Express to Tata Nagar (now Jharkhand) to see the Tata factories, then to Delhi to visit Escorts factory , from there to Poddar Mills in Jaipur, and from there to Gwalior Rayon in Gwalior, before returning to Mumbai 18 days later. This exposure at an early age helped him get into the family's investment business with a keen eye to differentiate a good stock from a bad one.
Sitting at his century-old Kalbadevi residence, Janak talked of his family's history and investment philosophy .They are natives of the Bet Dwarka island near Gujarat's Okha. In the 1870s, his greatgreat grandfather Hemraj Kanji travelled in bullock carts for two months to reach Mumbai to set up a textile business.
In the late 1800s, the family ventured into stocks. It has built a portfolio of companies from London, Burmah, Pakistan and Sri Lanka, in addition to domestic blue chips. “Today , our family is one of the oldest investors in some of the Tata companies,“ Janak said.
Through the years the family's approach has changed.“Earlier we were more interested in dividends yields on stocks,“ Janak said.
“Often a company with a face value of Rs 100 (which was usually the norm then), traded at Rs 40-50 and paid dividends of Rs 4-5. That gave us dividend yields of about 10% or more.Then we were not very interested in future prospects like today ,“ he said.
From the very beginning the family was careful about its interests as shareholders and never held back from speaking its mind to the managements.Right from the outset, the family never speculated, but went long-term. Janak said. “Earlier, for several years, I used work through the night to update our records of holdings and dividends received, and deposit the dividend warrants in banks in the morning so that we could quickly invest those funds in stocks,“ he said.“ We also bought stocks on borrowed money ,“ he added.
1990-2015: historical changes
In 25 years, from exclusive brokers' club to investor mkt
Partha Sinha The Times of India Mar 05 2015
On a day when Sensex hit 30,000 it's hard to remember that just 25 years ago, it was a mere three-digit number.Daily trading was then between 12 noon and 2pm and any of the top brokers facing funds crunch led to cancellation of the day's settlement! Trading was a lung-busting physical exercise under the open outcry system. IPO sizes ranged from a few lakhs to a maximum of Rs 3 crore. Compare that with the mammoth Rs 15,500 crore Coal India IPO in 2010. Vyaj badla, an indigenous form of futures trading that took place every Saturday , was part of the trading culture. Since 1990, Asia's oldest stock exchange has gone from being an exclusive brokers' club charging crores of rupees for admission to one that is fully corporatized.The change from open outcry system of trading in the ring, dematerialization of shares, clearing house for settlement within three days of trade and its competition with NSE, together have led to its transformation, Dalal Street veterans said. Today trading is online, faceless and smooth, with minimal of human intervention. Investors can trade on BSE from anywhere in the world. “The new system has taken the stock market to investors. While in the earlier system investors had to come to Dalal Street to trade and invest,“ said Arun Kejriwal, director of investment advisory KRIS.
However, the new system has its drawbacks too. For one, there's little personal interaction. Earlier, when about 7,0008,000 people traded in the ring, what is now the Convention Hall, understanding of the market didnt take much. One close look at a counter -the location where a particular blue chip stock was traded -and one got a fair idea of the trade's direction. “There were brokers who specialized in institutional trades, mainly on behalf of LIC and UTI, latter the original MF house from which UTIMF was carved out.
“If those brokers bought and sold, people said Sanstha lewal, Sanstha bechu (institutions buying, institutions selling),“ Kejriwal said. Due to the spread of the computer-based system, people have “lost the ability to understand the face behind the trade“, he said.At that time, companies going for listing got 120 days from the close of an IPO to list: 90 days for allotment and 30 more to list. Today , Sebi is contemplating cutting IPO time to just five days.


2002-13: Rallies after steep falls
The Times of India, Sep 18 2015
Allirajan M
Markets see rallies post steep falls
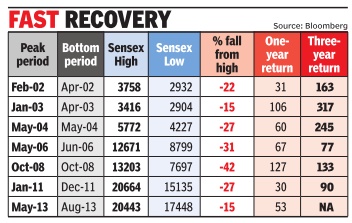
The markets are in a state of flux with global events depressing sentiments. But the benchmark sensex has recovered smartly after sudden sharp corrections in the past.The sensex has given annual returns of over 30% on an average after major market corrections in the last 14 years, data showed.
In fact, the sensex surged 127%, its best ever show after a fall, in the recovery rally that followed the global financial crisis. The sensex hit a new low of 7697 points in October 2008 as the markets tanked in the aftermath of the global economic recession.But the index more than doubled in one year.
Similarly , the sensex, which lost over 29% from its peak in June 2006, soared 67% in the next one year, Bloomberg data showed. The markets saw a sharp downturn then due to the sell-off in global commodities and select emerging markets including India. But it took only 120 for the markets to regain their peak in 2006.
While markets rallied se ven times in the bull phase of 2003-2008, there were several instances when they fell by more than 15%, which is typically considered a correction. However, in these cases market regained their previous peak within 3-5 months.
Sharp corrections (10%20%) are seen often within the structural uptrends seen in global as well as Indian equity markets, says Sunil Singhania, chief investment officer, equities, Reliance Capital Asset Management.
Data suggests that this is a typical characteristic of any bull market. Market move ment is not linear and corrections are inevitable in any bull run, he said. Correction in a bull market is an opportunity to build positions,Singhania said.
The performance of the sensex has been even more impressive over a three-year period after every major fall.The index has zoomed over 75% in all but one occasion in the three-year period that followed a sharp correction since 2001, Bloomberg data showed. It jumped 317% and 245% respectively over a three-year timeframe after the declines in April 2003 and May 2004. Markets usually bounce back as India is a growing economy , says G Chokka lingam, founder and mana ging director, Equinomics Research and Advisory . “We expect the markets to stabi lise and recover after the Fed (US Federal Reserve) anno unces its decision on rate hi kes,“ he says.
The sensex has lost over 12.5% since crossing the 30,000 mark for the first time ever on concerns that the slowdown in the Chinese economy would bring the stuttering global economic recovery to a halt. Market observers however believe that India's attractiveness has only increased as a result of global developments.
Prices of commodities have fallen considerably , which is a positive development for India, experts said. With crude oil prices hovering at around $48 per barrel amidst a weak demand outlook, current and fiscal deficit trending lower, subsidy burden falling, inflation at multi-year lows and a falling interest rate environment, India is in a sweet spot among emerging markets, they said.
2004-2020: market capitalisation
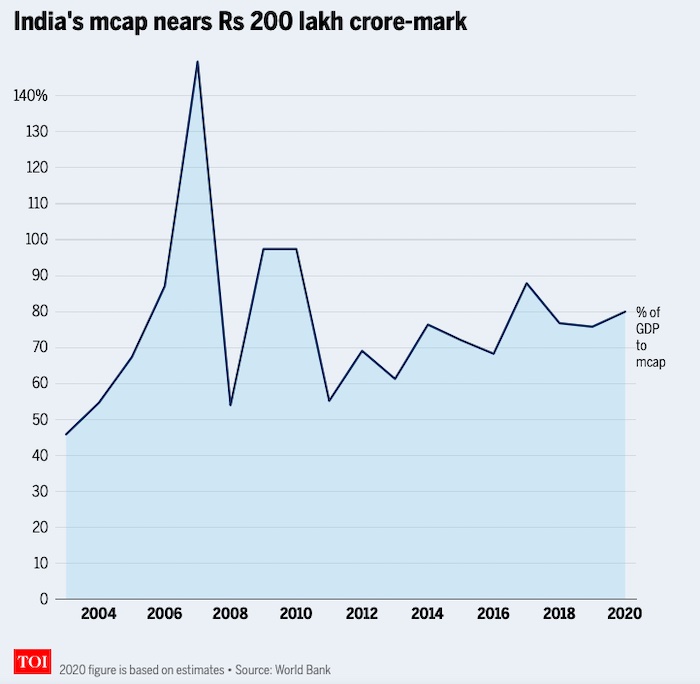
From: December 19, 2020: The Times of India
See graphic:
India, 2004-2020: market capitalisation
2005-2015: Firms giving returns in excess of 1,000%
The Times of India, Jul 08 2015
Kalpesh Damor

Shares of these firms are worth over 1,000% of their 2005 value
Had you invested Rs 5,000 in 1,000 shares of Symphony Ltd in 2005, your investment today would have grown to Rs 18.85 lakh. The Ahmedabad-based air-cooler maker is one of the few Gujarat-based firms giving returns in excess of 1,000% to shareholders in the past decade. Symphony is leading the pack in terms of increase in share prices.
The stock of the company surged 36,934.38% to touch Rs 1,885.05 on July 7, 2015 from Rs 5.09 a share on January 3, 2005. The rapid rise has catapulted its promoter Achal Bakeri to the elite club of billion-dollar business men in India this year.
Other companies to have had a dream run on the bourses during the past decade include Cera Sanitaryware, Vadilal Industries and Hitachi Home and Life Solutions In dia. The share prices of these firms rose by 5,163.10%, 4,250.29% and 3,830% respectively since 2005.
Vadodara-based Alembic Pharmaceuticals, Atul, Zydus Wellness and three-wheeler maker Atul Auto from Rajkot too have given an over 1,000% return to investors. Interestingly, the sensex has risen 321.78% till date from the 6,679.20 points it recorded on January 3, 2005.
Similarly , the price of gold, which averaged around Rs 7,000 per 10 grams in 2005, has increased to Rs 26,570 per 10 gram currently , offering a return of 279.57% in a decade.
Analysts opine that most of these companies innovated their products with time and aligned business strate gies in line with the growth in consumer demand.
“Companies like Symphony , Cera and Vadilal came up with new concepts that clicked, improving their sales and profit margins,“ said Nilesh Kotak, a stock analyst.
In fact, Gujarat-based small and medium-sized firms managed to offer bigger returns than larger players.
Zydus Wellness's focus on niche segment of wellness products and expanding its reach to new areas seems to have paid off. The company has witnessed 18 to 20% compounded annual growth over the past few years. Innovation in ice-cream products and diversification into frozen foods segments worked in favour of Vadilal Group.
2007-15: sector wise movement of stocks
See graphic:
2007-15: sector wise movement of stocks on the Indian Sensex, As well as a comparison of the Sensex with other major global markets

2008-18: dependence on foreign funds ends

FPI inflows
Domestic inflows
Changes in Sensex
From: Rachel Chitra & Partha Sinha, Indian market weathers strong foreign outflows, June 8, 2018: The Times of India
Desi MFs Help It Stay Near All-Time Highs Despite FPI Exit
It could perhaps be a sign of maturity for the Indian markets. Despite one of the sharpest foreign fund outflows on record, the sensex and the Nifty — the two leading benchmarks — are still near their all-time high levels. Mid- and small-cap indices, however, are down substantially, but foreign funds mostly stay away from such stocks.
Consider this: So far in 2018, net outflow by foreign portfolio investors (FPIs) from stocks and bonds together was $4.2 billion (Rs 30,351 crore), compared to almost $4 billion (Rs 17,025 crore) recorded during the comparable period of 2008, official data showed. A decade ago, strong selling by foreign funds had pulled the sensex down nearly 27% in about six months from its then all-time high of 21,207 points to 15,573. But this year, supported largely by strong domestic fund inflows, the sensex is down less than 3% from its alltime high of 36,444 points to 35,463 now, BSE data showed.
According to Kotak Mutual Fund MD Nilesh Shah, the fact that India managed bigger foreign outflows from debt and equity markets together so far in 2018 than at the time of the US subprime crisis in 2008 shows the maturity of the Indian economy over a decade. “As we develop a domestic institutional investor base, it reduces market volatility and over a period of time the lower volatility will reduce market risk premium,” Shah said.
Analysts credit some of this to the demonetisation effect. Spark Capital MD Skanda Jayaraman said, “After demonetisation, a lot of money that the government did not expect came back into the formal banking system, leading to a glut of deposits. Typically, such high deposits lead to a fall in interest rates, which happened in this case also. In the changed scenario of lower rates, as people were getting just 5-6% returns on their fixed or savings deposits, they looked for other avenues to park their money.”
Both 2016 and 2017 were also bad years to invest in real estate and gold. Earlier, real estate thrived in large part due to informal cash transactions. So, demonetisation dealt a hard blow to the sector, from which it took 16-18 months to recover. “An era of new and heightened regulation in both these sectors saw investors stay away from them. So investors have been left with no choice but to invest in the stock market,” Jayaraman said.
This was reflected in strong inflows into mutual funds and insurance plans, through which a large number of retail investors entered the stock market.
There are, however, some who feel the heavy MF inflows are cyclical in nature and do not point to a structural shift, and hence the Indian market may not be as resilient as it is being thought to be. Emkay Global head of research Dhananjay Sinha said, “I wouldn’t say the Indian market has matured as investment in the markets as percentage of total household savings continues to remain low, at 3.5%. In comparison, the historic high level seen in the 1990s was at about 6%. While the contribution of MFs is significant, FPIs still hold a dominant position in the secondary market.”
2012-15: equity funds do well
Equities are the real gold over long term
Prashant Jain The Times of India Mar 05 2015

Einstein said, “Compound interest is the eighth wonder of the world. He, who understands it, earns it ... he who doesn't ... pays it“. This has been experi enced in India.At 17.1% CAGR, Rs 10,000 has become ~290 times in 36 years, while in gold at 10.4% CAGR, it has become ~35 times.
A difference of ~7% in returns over longer term (36 years) has resulted in 8x increase in wealth.
The average inflation over this period has been ~8% (CPI).Thus, gold has given returns that are close to inflation, thereby merely preserving the purchasing power. On the other hand, sensex has delivered nearly 9% excess returns over inflation. Over long periods, this has made a big difference.
The reason for this is simple. Equities over time grow in line with the growth of underlying businesses. As businesses comprise the economy , the nominal growth of the economy (real growth plus inflation) is a good proxy for the average growth in business es. The table gives the nominal growth rates of Indian economy over last 35 years.
The Indian economy has grown at a remarkably constant nominal growth of 15% per annum. No wonder that the sensex CAGR of 17.1% is close to 15% nominal GDP growth.
Who is smarter: FIIs or local investors?
In India, it is interesting to note that in the last 22 years or so that FII have been allowed to invest in stocks in India, the FII ownership has gone up from nil to 24% -roughly 1% per year. The sellers obviously have been domestic investors.
The dollars received by the locals from sale of their shares have been thus invested in gold.Gold, as pointed out earlier, has yielded near inflation (~10%) CAGR vs 17% CAGR for the sensex. In effects, domestic investors have been exchanging a ~17% CAGR asset for a ~10% CAGR one. This certainly is not a smart thing to do.
The way forward
Outlook for Indian economy and Indian equities is promising. India is one of the best placed among large economies in the world in terms of demographics, demand, growth. India is a key beneficiary of lower oil prices. The savings from lower oil prices are near 2% of GDP on run rate basis at current prices over CY13 average.
Apart from lower oil prices, a strong, growth-oriented government bodes well for economic growth and for businesses.Key decisions of new government so far give confidence that lower fiscal deficit is a priority and it should continue to fall.Equities are the real gold. Equities compound near nominal GDP growth rates whereas gold compounds near inflation.
2012-15: The most rewarding stocks
Mar 19 2015
Reeba Zachariah & Partha Sinha
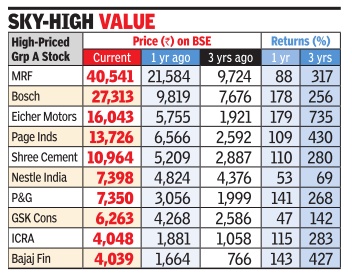
Offer gains up to 430% on BSE in 3 years, outperform Sensex that rose 63%
Their prices may appear intimidating, but don't be deceived. Some of the costliest shares on the bourses have also been the most rewarding over the past few years. For instance, an MRF share, the most expensive Indian stock, will lighten your wallet by about Rs 40,500. That kind of money could buy you an iPhone 6 or, even better, 15 grams of 22-carat gold. Although the steep price has often made retail investors wary of buying the stock, the Chennai-based tyre-maker has appreciated by an eye-popping 317% in the last three years. So, someone who bought 10 MRF shares at Rs 9,724 apiece in mid-March 2012 would be richer by nearly Rs 3.1 lakh today. Automotive component gi ant Bosch's stock, the second most expensive one now , stands at over Rs 27,000, up 256% in the last three years.
Eicher Motors, the third most expensive BSE stock, currently costs a little over Rs 16,000, rising nine times over three years from Rs 1,921 on March 19, 2012. Page Industries, the Indian franchise of Jockey International, is priced at a little over Rs 13,700 while Shree Cement is trading at near the Rs 11,000 level. Globally , the most expensive stock is Berkshire Hathaway , costing about $2,20,500 (around Rs 1.38 crore at current exchange rate).
Some of these “pricey“ stocks have even outperformed he sensex, which has given re urns of 31.5% in the past year and 63% in three years. So should you overcome the wariness and bet on such shares? “A stock, just because it is expensive, is not an avoidable one.Often the stock is expensive because of its high quality ,“ said Dipen Shah, Kotak Securities private client group research head. “ A retail investor should be aware of the underlying fundamentals of expensive stocks.
f it is really of high quality and s growing fast, it will remain expensive and may provide re urns over the longer term,“ Shah said.
Interestingly , a look at the public shareholding patterns of these stocks reveals that in most of these companies, the shares are highly concentrated with institutional investors such as mutual funds and insurance companies. In Bosch, other than the promoters and institutions, public shareholders hold just about 10%, while in Page Industries public shareholding is just below the double-digit mark.
“Though the value is high, these shares have low trading activity and are largely preferred by institutional investors,“ said Jagannadham Thunuguntla, Karvy Stock Broking fundamental research head.“Retail investors prefer shares with twoor three-digit denominations. But they shouldn't depend on denominations and should look at the underlying factors such as price-earnings ratio that one can get from these stocks,“ Thunuguntla said.
2013: High index levels hide lurking weakness
Around 550 Stocks On The NSE Have Fallen By More Than Half between 2008 and 2013 Sign In | Join
TIMES NEWS NETWORK
The Times of India 2013/08/15
Though in 2013 the Nifty seemed to be holding up to 2008 levels, it was less reflective of the economy and the worsening macroeconomic situation. More than 550 stocks among the actively traded ones on the National Stock Exchange (NSE) have tumbled by more than half between 2008 and 2013.
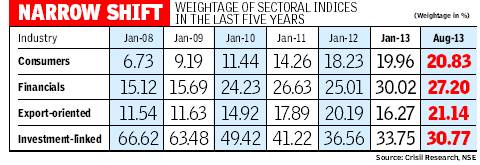
The price to book (P/B) valuation has dropped from 7.1 times in 2008 to 5.1 times in 2013 for Nifty firms. The changing dominance and outperformance by a few sectors such as consumer discretionary, private sector financial services companies and export-orientated sectors such as information technology (IT) and pharmaceuticals is holding key indices to almost levels seen in January 2008.
Investment-linked sectors such as materials, industrials, energy, utilities and telecom dominated the Nifty with a weightage of 66% in January 2008, data compiled by ratings agency Crisil showed. The weightage of any company/sector in the index is determined by the relative (to other companies/ sectors) free-float market capitalisation of the constituents.
The 2013 slowdown has resulted in poor performance of these sectors, shrinking valuation multiples resulting in a steep drop in the stock prices thereby lowering their cumulative weightage to 31% in July 2013. The aggregate earnings of companies in these sectors remained almost flat during the period.
As many as 22 out of 27 companies in these sectors (among 2008 Nifty constituents) gave negative returns. On the valuation side, the weighted average P/B multiple of companies shrank from 7.3 times in 2008 to 1.7 times in 2013.
Strong financial performance and increase in valuations of consumption and export-orientated sectors led to rebalancing of the weightage in their favour. These performing sectors, which include IT and pharma companies, now command 65% weightage in the index compared to 29% in 2008. Consumer-orientated sectors and private sector financial services firms have benefited from the consumption boom and government policies while IT and pharma have gained from the recovery in the global economy and weakening rupee. Among the biggest gainers of the pack are Lupin (599%) and Sun Pharmaceutical Industries (372%). During the past five years, aggregate PAT (profit after tax) of the companies in these performing sectors has grown at a CAGR (compounded annual growth rate) of 21.9%.
Along with reconstitution of the Nifty, the concentration of top-10 stocks too has changed—it is at a five-year high of 59.1% now compared to 53.3% in January 2008. Further, six companies, which were part of the top-10 list in 2008, have now been replaced.
2014-17, changes in stock market
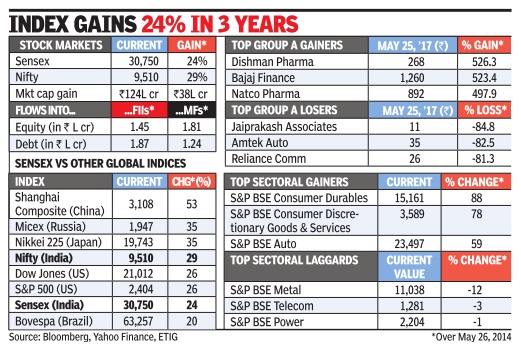
See graphic.
Changes in stock market, 2014-17
2016, 19- 2021

From: Sep 22, 2021: The Times of India
See graphics:
How volatility is rising in the markets, Oct 2019- July 2021
2017: 29% growth
With 29% growth, Indian mkts end 2017 with a bang, December 30, 2017: The Times of India
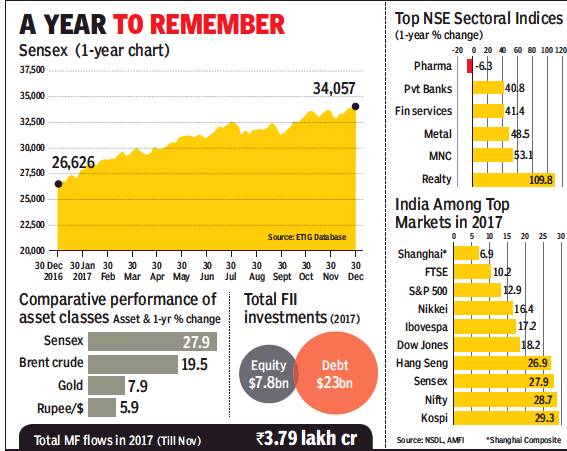
i) Sensex,
ii) Comparative performance of asset classes,
iii) total FII investments,
iv) top NSE sectoral indices,
v) The stock markets, India and other countries, 2017
From: With 29% growth, Indian mkts end 2017 with a bang, December 30, 2017: The Times of India
D St Investors Get Richer By ₹51L Cr, BSE M-Cap Hits ₹157L Cr
The Indian market has rallied to be one of the top performing ones in the world in 2017. The reasons were several — easy availability of money globally, India’s improving economic fundamentals, the government’s demonstration of its serious intent for economic reforms, signs of a turnaround in corporate earnings and state poll results favouring the ruling BJP-led alliance.
The sensex closed with a 28% gain at 34,057 points, while the Nifty was up 29% at 10,531 points as investors pushedboth the indices to record closing highs in the last session of the year. According to market players, the introduction of GST and the Insolvency & Bankruptcy Code (IBC) were the most significant moves by the government. And the emergence of the domestic mutual fund industry as a strong counterbalancetoforeign fundswas an important shiftin thecountry’s financial space.
Aided by the rallying market, Dalal Streetinvestors were richer by Rs 51.2 lakh crore in 2017, with the BSE’s market capitalisation now at an all time high of Rs 157 lakh crore. Market players pointed out that the year could also be termed as that of small- and mid-cap stockswiththeBSE’s small-cap index up 60% and the mid-cap index 48%. It was also the year when real estate stocks made a strong comeback, while pharma stocks— consideredby many as a defensive bet— lostsubstantial ground.
Market players pointed out that the coming year may not be as smooth as 2017. Already there are increasing macro concerns like growing fiscal deficit and government’s higher borrowing at a time when its revenuecollections are faltering, crude oil prices are rallying and inflation is rising.
2017, Apr- 2018, Jan
Sensex climbs Mt 35k as govt cuts additional debt by 60%, January 18, 2018: The Times of India

From: Sensex climbs Mt 35k as govt cuts additional debt by 60%, January 18, 2018: The Times of India
See graphic:
2017, Apr- 2018, Jan: Sensex goes from 30,000 to 35,000
Reforms Buzz And Dow Jones’ Record Run Boost Market
The government’s decision to cut its planned market borrowing amount for the current fiscal gave a boost to investor sentiment on Dalal Street on Wednesday. This took the sensex above the psychologically important 35k mark for the first time in its history with the benchmark closing at 35,082 — up 311 points on the day.
Global cues like Dow Jones’ record run in recent days and reports that the government may hike foreign ownership across all domestic banks also helped the current Indian rally, brokers and dealers said. News reports that the government is expected to cut GST rates on 70-80 items in the council’s next meeting also helped the market sentiment, they added. Consider this: The sensex took just 16 sessions — that is less than a month — to rally from 34,000 to 35,000 as domestic funds netbought stocks worth Rs 4,275 crore, while foreign funds netinfused nearly Rs 5,600 crore. Led by blue chips, investor wealth jumped by more than Rs 3.45 lakh crore in these 16 sessions with the BSE’s market capitalisation now at a record high of Rs 160 lakh crore.
Market players believe that a combination of factors would help the Indian rally to continue. These include the government’s seriousness to move ahead with tough economic reforms despite opposition, Indian households’ changing preference to invest in financial assets like stocks, bonds, etc, and expectations that the current global economic growth momentum would continue for a few years.
According to HDFC Securities MD & CEO Dhiraj Relli, the lowering of additional borrowing requirement for the current fiscal to Rs 20,000 crore from Rs 50,000 crore earlier was welcomed by market participants with the BFSI (banking, financial services and insurance) segment leading the pack. Among the sensex stocks, Axis Bank, SBI and ICICI Bank led the gainers. Strong quarterly results from the IT majors also added to the Street’s sentiment, brokers said.
The current rally, however, is raising concerns about valuations among market players who believe that prices of a large number of stock are slightly stretched. However, Kotak Securities MD & CEO Kamlesh Rao believes, “If the quarterly numbers from the Indian corporates show strong growth — in double digits compared to the 4-6% level for the past few quarters — then there won’t be any worries relating to valuations”. Also, Rao feels that the Budget is going to be revenuecentric and not populist, which will again support the market sentiment. “At present, interest rates and rising crude oil prices are the worries for the market,” Rao said.
Going forward, sectors like defence, infrastructure, railways and core manufacturing sectors are expected to lead the rally. Also, according to Reliance Securities head of research Rakesh Tarway, “Increase in farm income to boost rural spending and affordable housing push will be positive for sectors like banks, cement and realty”.
Experts said that with the NSE Nifty currently above the 10,700 level, the next resistance is technically at around 10,900 points, that is, a rally of another 1.5% for the leading indices.
The rally in the stock market also had a positive impact on the rupee, which had sunk nearly 1% on Tuesday. The Indian currency strengthened by 15 paise to 63.89 to the dollar as market players expect stronger foreign flows will support the rupee.
In the bond market, the government’s decision to cut borrowing amount led to a rally in gilts with the benchmark 10-year yield closing softer at 7.22% per annum compared to its Tuesday close of 7.38%. Bond prices and yields move in opposite directions. Bond dealers, however, are not very confident that the rally in gilts could continue.
2018, Jan- July
Allirajan M, Indian mkt is best performer in 2018, August 4, 2018: The Times of India

From: Allirajan M, Indian mkt is best performer in 2018, August 4, 2018: The Times of India
Gains 10% Year-To-Date In ₹ Terms, 6% In July
Riding high on the surge in equities during July, India has emerged as the best performing market among large stock markets in the world during 2018. The Indian markets gained 10% year-to-date in rupee terms, which was much higher than key stock markets such as US, China and Japan.
For the month of July, the markets returned 6%, the second best performance among large stock markets. Brazil, which gave 9% returns, was the best performer.
Over the last 12 months, the MSCI India index rose 11%, outperforming the MSCI EM (Emerging Markets) index that advanced by 2%. Notably, over the last five years, MSCI India has outperformed MSCI EM by 127%. MSCI India P/E is at a premium of 66% to MSCI EM P/E, above its historical average premium of 44%.
The sharp slide in the rupee, however, pushed India to the second position in performance in US dollar terms. While the Indian markets advanced 3% in dollar terms in 2018, the US markets gained 5% to take the top slot.
The Nifty rallied in July after two consecutive months of flattish performance. Improving global sentiment, moderation in foreign institutional investor (FII) selling, a decent start to the earnings season and a moderation in crude oil prices kept the markets buoyant. The Nifty scaled new highs during the month.
The market cap-to-GDP ratio for India, at 82%, is above its long-term average of 78%, data compiled by Motilal Oswal Securities showed. India’s share in world market cap, at 2.8%, is also above its historical average of 2.5%. While the world market cap has increased by 6.2% ($4.7 trillion), India’s market cap is up 7.3% over the last 12 months.
Sensex up 6%, one of best globally
Sensex up 6% in ’18, one of best globally, January 1, 2019: The Times of India
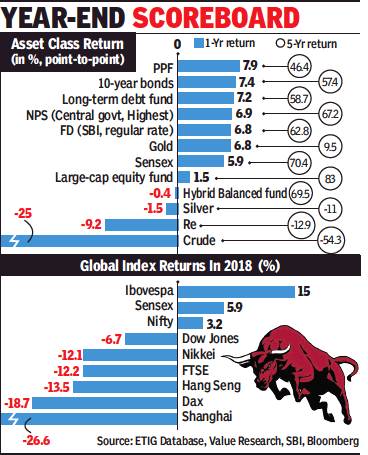
From: Sensex up 6% in ’18, one of best globally, January 1, 2019: The Times of India
Sharp Sell-Offs, FPI Pullouts Leave Investors Poorer By ₹13L Cr With BSE M-Cap At ₹144L Cr
Dalal Street investors will remember 2018 for the market volatility, the wealth it created in the first half, and then the destruction of the same in the second half. The year will also be remembered as one of the defining years for the Indian market when, despite a sharp sell-off by foreign funds, the sensex showed a respectable 6% gain — the best among Asian peers. This came about as domestic investors, investing through systematic investment plans (SIPs), cushioned the selling. On Monday, the sensex closed flat at 36,068, while the Nifty closed at 10,863.
Starting the year at nearly 34,000, the sensex gained in January and, after sliding for a couple of months, rose almost continuously to scale an all-time high which was close to the 39,000 mark by end-August. From then on, as global factors took centre stage — with US President Donald Trump starting a trade war with China, and the US central bank raising rates — foreign funds started feeling jittery about their investments in emerging markets, including India.
As a result, with an annual net outflow of about Rs 30,000 crore, FPIs registered their sharpest selling year since 2008. This led to sharp selloffs, especially in mid- and small-cap stocks that left investors poorer by about Rs 12.6 lakh crore, with the BSE’s current market capitalisation now at Rs 144.4 lakh crore.
During the year, IT stocks led the gainers as customers globally spent more on software services and digital platforms with TCS and Infosys among the top sensex performers. On the other hand, Tata Motors, Yes Bank and Bharti Airtel were prominent among the sensex laggards. On the sectoral front, pharma stocks also faced selling pressure as regulatory scrutiny increased and global majors in the sector rallied against Indian generic companies.
The year saw, for the first time, aggregate monthly SIP inflows crossing the $1-billion mark (and is now at about Rs 7,500 crore). According to mutual fund industry leaders, in about two years, this figure should cross the Rs 10,000-crore mark.
The year, however, saw slower fund-raising through the IPO route, especially in the second half as the market turned volatile and the sensex lost nearly 15% between end-August and end-October. In addition to foreign fund selling, default on loans by government-run infrastructure financier IL&FS also riled market men, leading to sharp selling on D-Street. Recently, Sebi chairman Ajay Tyagi pointed out that the slowdown in the IPO market was a cause for concern, while the regulator also tightened rules for mutual funds investing in debt papers by corporates.
2019: Equity fund-raising up 28%
Mamtha A, Dec 27, 2019 The Times Of India
Despite market volatility due to domestic and global factors, the public equity market is set to end on a high note with a 28% higher fundraising at Rs 81,174 crore in 2019, as against Rs 63,651 crore in previous year.
Though fund mobilisation fell short by 49% compared to the all-time high of Rs 1,60,032 crore raised in 2017, it has improved from Rs 63,651 crore reported in 2018, shows data from Prime Database.
With a 141% jump in fundraising via offers for sale (OFS) at Rs 25,811 crore and a 112% jump in mobilisation of funds through qualified institutional placements (QIPs) at Rs 35,238 crore, the public market ends the year on a positive note, the study said.
However, the IPO market saw a 60% decline in fund-raising to Rs 12,362 crore — with the average deal size at Rs 773 crore. “In 2019, domestic institutional investors played a significant role as anchor investors, accounting for 13% subscription amount, and as far as retail investors are concerned, the year witnessed a good response from them as well,” said Pranav Haldea, MD of Prime Database Group.
2020>21: Coal was the best performer
Nov 5, 2021: The Times of India

From: Nov 5, 2021: The Times of India
The best returns between last Diwali and this year were generated by a commodity that is commonly described as ‘least loved’ because of its association with climate change. Prices of Australian coal in the last 12 months have increased 188% — almost twice the appreciation of Brent crude, which is under focus for its 95% rise.
While coal and crude were the best performers in the last 12 months, the worst performers, ironically, were gold and silver, which dipped 4.7% and 2.9% after rising amid the flight-to-safety following the pandemic-induced economic crisis last year, according to an analysis by Care Ratings.
Coal has seen demand firing up even as the world is trying to arrive at a consensus on net-zero emissions.
2024 Feb: India no.4

From: March 22, 2024: The Times of India
See graphic:
2024 Feb: India no.4 In the list of the world’s biggest stock markets
Bad spells
Feb 2016, Sept 2018
Markets log worst mth since Feb 2016, September 29, 2018: The Times of India
Benchmark sensex buckled under selling pressure for the third straight session, capping off its worst month in over two-and-half years, as investors clamoured for the exit amid valuation and macro stability concerns.
The 30-share BSE index slipped 97 points in see-saw trade to close at 36,227, while the NSE Nifty dropped 47 points to 10,930.5.
The sensex has lost a whopping 2,417.9 points, or 6.3%, in September — its worst monthly show since February 2016.
Sentiment remained weak on the back of a weak rupee, high crude oil prices and liquidity concerns, while investors were also reluctant to make fresh bets ahead of RBI policy meeting next week, brokers said.
Selling took hold at the start of October futures and options (F&O) series in the derivatives segment.
Both the key indices recorded their fourth straight weekly fall. The sensex lost 614.5 points, or 1.7% and the Nifty dropped 212.7 points, or 1.9%, this week. Meanwhile, domestic institutional investors (DIIs) sold shares worth a net Rs 186.7 crore, while foreign portfolio investors (FPIs) bought shares worth Rs 552.4 crore on Thursday, according to provisional data.
“Factors like heightened volatility of the money market, INR depreciation, increased bond yield and selling by FIIs in the emerging market triggered cautiousness in the market. Mid and small-cap continued to underperform while short covering in banking stocks helped Bank Nifty to close on a positive note,” said Vinod Nair, head of research, Geojit Financial Services.
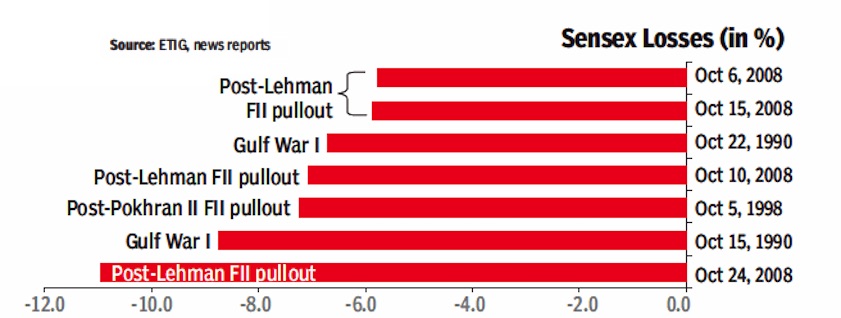
October jinxed for Dow Jones, Sensex

From: October 12, 2018: The Times of India
From: October 12, 2018: The Times of India
See graphics:
1990-2008- The biggest Sensex losses were in October- Part I
1990-2008- The biggest Sensex losses were in October- Part II
Best performing stocks
2007-17: The Best performing IT stocks
Shilpa Phadnis, Cognizant top IT stock pick in 10 yrs, December 12, 2017: The Times of India

From: Shilpa Phadnis, Cognizant top IT stock pick in 10 yrs, December 12, 2017: The Times of India
Cognizant has had the best stock market performance among the IT services and BPM (business process management) firms globally in the past 10 years. The company’s share price rose by 364% in this period. Which means, if you had invested $1,000 in Cognizant a decade ago, the same would have been worth $4,648, according to calculations by IT consulting and research firm HfS.
At the No. 2 spot is Canadian IT services player CGI, whose scrip rose 363%. CGI is followed by Accenture (328%), TCS (212%), Mindtree (209%), HCL (208%) and France-based Atos (158%). After this are three pure-play BPM companies—EXL, Genpact and WNS, which grew 156%, 125% and 115% respectively. For Infosys, it is just a 47% increase, and for Wipro 27%. Tech Mahindra, Fujitsu, HP and Unisys bring up the rear, according to HfS. The returns were calculated as of November. It takes into consideration HCL and Tech Mahindra’s share bonus and stock split.
Phil Fersht, CEO of HfS Research, said Cognizant has kept its competitors on the edge with competitive pricing, lower margins, and aggressive and effective sales. CGI has had a buildand-buy strategy, focusing on smaller contract wins, renewals, long term outsourcing contracts, coupled with acquisitions. Accenture’s success has much to do with its successful pivot into the new—digital cloud and security services that contribute to over 50% of its revenue.
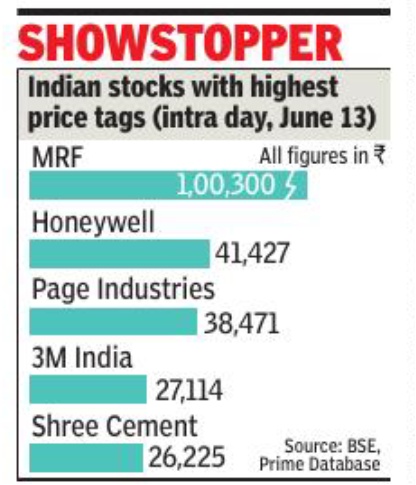
2023, June
From: June 14, 2023: The Times of India
See graphic:
The most valued stocks in India in June 2023
Brokerage houses
2018: the top retail brokers

From: Rachel Chitra & Partha Sinha , Zerodha replaces biggies as largest broker in India, January 10, 2019: The Times of India
Beats Giants Like I-Sec, HDFC Sec, Sharekhan On Tech, Lower Fee
Newage stock brokers which are offering trading services at nearzero costs, are changing the old order at a fast pace, thanks to the rapid adoption of technology in India’s banking and financial services space.
Bangalore-based tech-driven, low-cost brokerage house Zerodha, started by a former trader nearly eight years ago, has replaced giants like ICICI Securities, HDFC Securities, Kotak Securities, Motilal Oswal and Sharekhan to emerge as the largest broker in India in terms of number of clients, NSE data showed.
With 8.47 lakh clients, Zerodha is now ahead of ICICI Securities (8.44 lakh), which was the market leader for nearly a decade. Others lower down the pecking order are HDFC Securities
(6.74 lakh), Sharekhan (5.4 lakh), Angel Broking (4.1 lakh) and Kotak Securities (4 lakh).
In the last five years Zerodah’s annual growth rate in client addition has been in the range of 200-300%. Some other brokerages having similar models, popularly called discount brokerages, are also growing their cleints at a fast clip. These include Upstox (formerly RKSV), Samco and SAS Online. These brokerages too have seen their client base rise two-three folds in the last two years.
Discount brokers are those houses which charge clients significantly lower fees compared to traditional ones, offer only online trading facility but no research support or financial advice. Globally, because of the low cost structure and the tradeand-scoot type of policy, discount brokers are very popular among traders but not so among investors.
Zerodha’s rise to the top of the table could be attributed to its first-mover advantage in the space, along with its smart use of technology. For example, at a time when all brokerages were fixed on charging a percentage of the trade value as commission, it introduced a flat fee of Rs 20 per trade. The move, then, was not only brushed aside as a gimmick by large brokerages, some even joked that forget stock trading, for Rs 20 one can’t even buy samosas.
According to Nikhil Kamath, co-founder, Zerodha, its growth could also be attributed to transparency and technology prowess. “Our trading platform Kite is one of the most advanced systems in the market. For front-end trading, we provide immense data richness in our charts, graphs and also permit real-time rule based trading. Also we’ve opened our APIs to coders, so they can create their own tools to trade,” Kamath said.
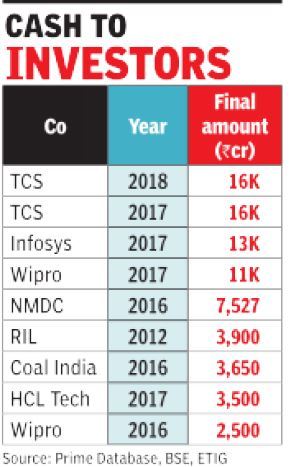
2012-18; 2018: TCS’ second buyback in 2 years
Reeba Zachariah, TCS to spend Rs 16,000 crore on share buyback, June 16, 2018: The Times of India
HIGHLIGHTS
TCS has announced to spend up to Rs 16,000 crore to repurchase its own stock for Rs 2,100 a piece
Aimed at distributing excess cash to shareholders, the company will repurchase 7.6 crore shares
The biggest beneficiary of this share buyback scheme will be TCS' parent Tata Sons
From: Reeba Zachariah, TCS to spend Rs 16,000 crore on share buyback, June 16, 2018: The Times of India
In what will be the second share buyback in two years under Tata Group chairman N Chandrasekaran, the country's largest software services company TCS has announced to spend up to Rs 16,000 crore to repurchase its own stock for Rs 2,100 a piece. The buyback price is 14 per cent premium to TCS' closing price of Rs 1,841 on the BSE. Aimed at distributing excess cash to shareholders, the company will repurchase 7.6 crore shares, representing about 2 per cent of its equity capital, on a proportionate basis.
The biggest beneficiary of this share buyback scheme will be TCS' parent Tata Sons. Based on its 72 per cent stake in the IT services behemoth, the parent will get Rs 11,502 crore from participating in the programme. The money will give Chandrasekaran additional resources to strengthen Tata Sons' balance sheet, raise holdings in group companies, retire debt of the telecom business and finance buyouts like Bhushan Steel and Bhushan Power.
TCS had cash and investments of Rs 79,755 crore on its books as on March 31, 2018. If the company spends the entire Rs 16,000 crore on the share repurchase programme, its cash would come down to Rs 63,755 crore.
Early this month, TCS chief Rajesh Gopinathan had said that the company's plan is to return at least 80% of its free reserves to shareholders every year. Instead of maximising returns on cash and investments, its strategy would be to distribute surplus money to shareholders, Gopinathan had said. Last year too, the company had spent a similar amount of Rs 16,000 crore on share buyback.
Investors have been turning the heat on large IT companies to return excess cash to shareholders as they shy away from making big-ticket acquisitions and instead sit on huge cash piles.
In 2017, four IT companies, including Infosys and Wipro, spent Rs 43,500 crore on share buybacks. Buyback is a tax-efficient means of returning cash to shareholders as compared to giving dividends. It also helps in improving earnings per share and boosts the price of the stock during sluggish market conditions.
Demat accounts
There is information about these accounts elsewhere on this page as well.
2016- 2021

From: Sep 22, 2021: The Times of India
See graphic:
Growth in demat accounts, 2016- 2021
Dividends
73 companies paid lower dividends, 2012-15
The Times of India, Jan 20 2016

Rupali Mukherjee
73 cos can pay Rs 20,000cr more in dividend: Study
India Inc, which is seen to be stockpiling cash, should return it to shareholders if it does not have productive use for it, while detailing how much money it wants to retain in books, and why . Globally, by and large, investors are clear about the dividend policy of the companies they have invested in. Since regulations do not require companies to declare a dividend policy , payout ratios have been relatively low, as companies have chosen to maintain large cash balances, shareholder advisory firm IiAS says in a study shared with TOI. The study says that at least 73 companies can potentially return an additional Rs 20,000-crore cash to their shareholders in the form of dividends or buybacks (see chart). HUL recently became the first company to reward shareholders by transferring its entire general reserve to its profit and loss account.
The 73 companies have been accumulating cash without any foreseeable use for it, the study says, adding excess cash has been a drag on overall returns, and could lead to sub-optimal capital allocation decisions over time.
Domestic companies are increasingly realizing the importance of dividends to their shareholders, with dividend payouts having steadily increased over the last few years -for S&P BSE 500 companies, dividend has outpaced growth in net profits over the past five years. Median dividend payout ratios increased to 24% in FY15 from 21% in FY10. Dividends in absolute amounts, have grown at a CAGR of 14%, while profits have grown at a more modest 7% CAGR between FY10 and FY15.
Good governance practi ces demand that companies disclose a well-articulated di vidend policy which specifies afloor for dividend payout, or a tangible method to determine it, as disclosures in most annu al reports are usually vague.This will help investors understand the company's strategies with the cash it generates, and also help create expectation of behaviour. For example, PSUs have a defined dividend policy -the finance ministry requires profit-making public sector enterprises to pay a minimum dividend of 20% of equity or 20% of profit after tax, whichever is higher.Companies in oil, petroleum, chemical, and other infrastructure sectors are required to pay at least 30% of profit after tax as dividend.
In fact, companies should move ahead from a `dividend' to `retention' policy , where they should take shareholder approval to retain cash, and disclose how they propose to utilize it, an IiAS executive said, adding the proxy firm has been advocating the converse of a dividend policy -the `retention approval.' “We strongly believe that companies should obtain shareholder approval to retain cash specifying the rationale for doing so, and pay out the remaining to shareholders as dividends: this cash belongs to all shareholders and is not for managements to keep“, he added.
2015: Sensex lower, IPOs return, individuals Invest in MFs
The Times of India Jan 01 2016
Partha Sinha
Sensex Ends 5% Lower, But IPOs Return | Retail Investors Pour Rs. 70K Cr Into MFs | Re Fares Better Than Peers
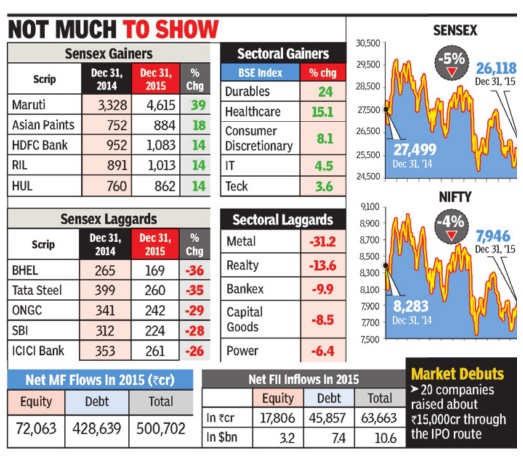
Euphoria and despair were in full display on Dalal Street in 2015. On March 4, soon after RBI governor Raghuram Rajan went for a surprise cut in interest rate, euphoric investors pushed the sensex above the 30k mark for the first time ever. Hectic buying was seen on the back of expectations of a quick turnaround in corporate earnings in the next few quarters. In absolute contrast, as the Chinese economy slowed drastically after growing at double-digit rates for quarter of a century, with global markets in doldrums and investors scurrying for cover, on August 24 the sensex crashed a gut-wrenching 1,624 points, its biggest single-session absolute drop ever. From its peak, the sensex closed the year down 13% at 26,118 on Thursday .
Overall, the year, which in the beginning showed lot of prospects for another strong rally , ended on a downbeat note with corporate earnings yet to show signs of recovery andlacklustre foreign fund flows. External factors, more than domestic ones, threaten to turn 2016 into another volatile year.
“2015 turned out to be a complicated year for investors with corporate performance failing market expectations,“ said Krishna Kumar Karwa, MD, Emkay Global Financial Service. “The reality surprised the exuberant expectations of a rebound in earnings from a pro-reform government voted to power in 2014 and the windfall from crashing crude oil prices,“ he said. As the year progressed, FII flows muted, mainly on concerns relating to global liquidity in the run-up to the US Fed rate hike on December 16. Domestic political issues also emerged as a roadblock for the market after the Delhi state polls, which was further compounded after the Bihar election results in early November. Setbacks for the government on the GST and land acquisition bills also affected investor sentiment, Karwa said.
The silver lining for the market was the revival of IPOs and strong inflows into mutual funds from retail investors. After three muted years, a host of quality companies got listed during the year with Dr Lal's Pathlab, Interglobe Aviation (IndiGo airlines) and Alkem Labs among the standout performers. In the mutual fund segment, retail investors poured in about Rs 70,000 crore, nearly the same amount they had withdrawn from the fund and insurance industries over the previous four years, MF industry officials said. If this trend of net inflows from retail investors continues, investment analysts say it could become a huge blessing for the Indian market with slowly domestic funds emerging to be a counterbalance to foreign funds, the sole cause for volatility .
For 2016, fund managers and brokers believe that the government-led spending will increase, which in turn will attract private players to also start their capex plans. “We expect private sector capex to rise as demand sustains, capacity utilization expands and balance sheet stress reduces either through asset sales or better cash-flows and the overall confidence in long-term growth of the economy increases,“ said Kamlesh Rao, CEO, Kotak Securities, in a note. “On the consumption side, the recent recommendations on OROP and 7th Pay commission should help sustain demand,“ Rao said.
The coming year could also witness heightened volatility, mainly because of several external factors like prices of crude oil and other commodities, possible hike in rates by the US Fed, weak data from the Chinese economy as it gets used to a single digit economic growth rate, flat stock markets and the US elections later in the year, a panel of experts recently told TOI in a roundtable themed `Where to Invest in 2016'.
Earnings, year-wise
2014> 21

From: August 16, 2021: The Times of India
See graphic:
Earnings per share in India, year-wise, 2014> 21
Elections and the stock market
Behaviour after the results
2024
June 5 2024: The Times of India
Mumbai: Investors, globally, do not like surprises. They also prefer status quo. Surprisingly, both these elements were missing during Tuesday’s trading on Dalal Street. The result: A never-seen-before 4,390-point crash in sensex and Rs 31-lakhcrore wealth destruction in just six-and-a-half hours.
Contrary to exit poll predictions of a resounding election mandate for BJP, voters left the governing party 31 short of the majority mark and made it dependent on allies such as TDP and JD(U).
As a result, investors now expect that the new govt will not be able to take some of the bold policy decisions to push the economy along the strong economic growth path that it’s already on. As the initial poll results trickled in, sensex ope- ned 200 points down but then heavy selling pulled it down by over 6,000 points.
Fear factor: India VIX jumps 50% to 2-year high
After some late buying, the index closed at 72,079 points, still down 4,390 points or 5.7% — the biggest single-session loss in its history (in points). Nifty lost 1,379 points or 5.9% to close at 21,884 points.
At one point during the day’s session, Nifty was just about 150 points off hitting the 10% lower circuit level, which would have stopped trading across all bourses for at least an hour. The day’s market crash left investors poorer by Rs 31 lakh crore, with BSE’s market capitalisation now at Rs 401.2 lakh crore, translating to $4.8 trillion.
Among the sensex stocks, only three — HUL, Nestle and TCS — closed higher while the other 27 constituents closed in the red. PSU stocks, which have seen a stellar run during the last two years mainly on the back of pro-sector policies of govt, crashed. Among the maharatna companies, NTPC crashed 15.5% and Powergrid Corp lost 12.4%, while SBI fell 14.4% down. As a result, BSE’s PSU index closed 15.7% down, BSE data showed. During Tuesday’s session, India VIX, the measure of volatility, spiked nearly 50%, touching an over two-year high at 31.7 points and finally settling at 26.75, NSE data showed.
11 Adani co stocks crash, group m-cap plunges ₹3.6L cr
Investors in Adani group companies were left poorer by a massive Rs 3.6 lakh crore as stock prices of all the 11 companies crashed on the back of a depleted mandate for the BJP-led NDA coalition. The group’s combined m-cap fell from Rs 19.4 lakh crore on Monday to Rs 15.8 lakh crore, BSE data showed. Group flagship Adani Enterprises led the slump. As the stock crashed 19%, its market cap worth Rs 80,416 crore eroded.
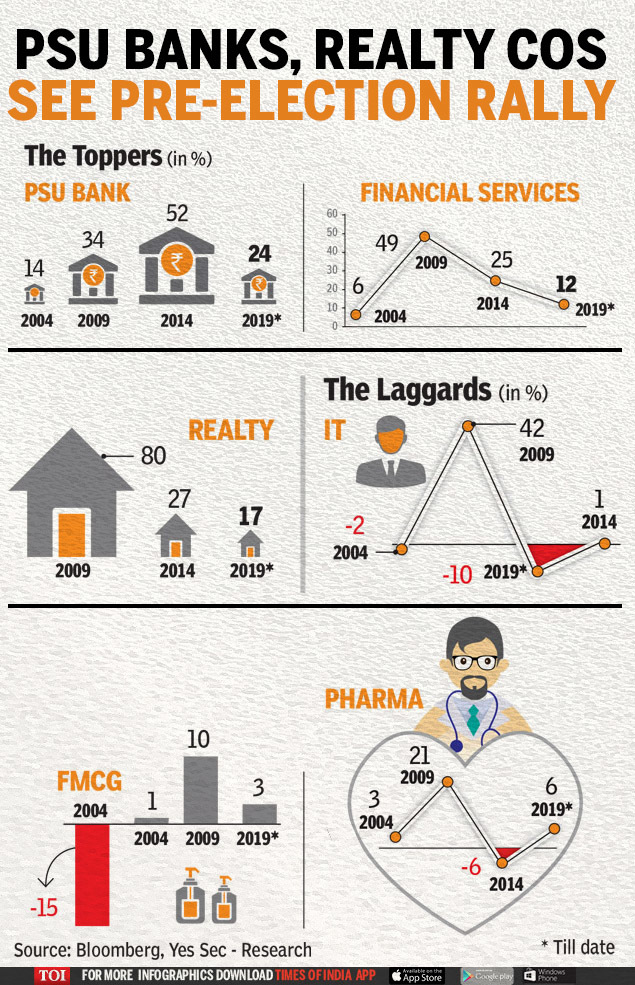
Pre-election behaviour: 2004-2019
April 11, 2019: The Times of India
From: April 11, 2019: The Times of India
Bank Nifty & finance cos have outperformed the NSE benchmark from March 1 to election result day in previous poll years, while FMCG tended to underperform. The realty index stood out among the top 5 gainers in pre-election rallies. However, like in pre-poll rallies earlier, this year too PSU banks are leading the charts.
Futures & options (F&O)
2019-22, 2022-24
Sep 24, 2024: The Times of India
A new study by Sebi shows that between FY22 and FY24, a staggering 93 out of 100 retail traders in the futures & options (F&O) segment lost money while only one out of 100 gained more than Rs 1 lakh annually.
An earlier study had shown that between FY19 and FY22, 89% of retail traders in the segment had lost money. On the other hand, proprietary traders and foreign funds made huge profits.
Details

From: Sep 24, 2024: The Times of India
See graphic:
The futures & options segment in India: 2022-24
TIMES NEWS NETWORK
Mumbai : A staggering 93 of 100 retail traders in the futures & options segment lost money, while only one out of the 100 gained over Rs 1 lakh annually between FY22-24, a new study by Sebi showed. An earlier study had shown that between FY19-22, 89% of retail traders in the segment had lost money.
On the other side, proprietary traders and foreign funds made huge profits. And within the profit makers, ‘algo traders’ — those who trade in the derivatives segment using software-based automated systems — took home most of the profits, the study showed.
“More than one crore lossmaking traders (92.8% of individual traders) lost, on an average, about Rs 2 lakh per person in F&Os” during the study period, the report noted. “Top 3.5% of loss-makers, approximately 4 lakh traders, faced an average loss of Rs 28 lakh per person over the same period, inclusive of transaction costs.” The study also found that only 7.2% of retail F&O traders made a profit over the three-year period and of the profit makers, a mere 1% managed to earn profits exceeding Rs 1 lakh, after adjusting for transaction costs. Additionally, the 1.1 crore retail derivatives traders together lost Rs 1.8 lakh crore during these three years.
The study also showed that between FY23 and FY24, the proportion of young F&O traders (below 30 years) increased significantly from 31% to 43%. “Nearly 93% of these young traders incurred losses in F&O in FY24, higher than the average loss makers of 91.1% in FY24,” the study noted. While (retail traders) made losses in the segment, FPIs and proprietary traders earned profits in FY24. Proprietary traders earned about Rs 33,000 crore of gross profits (that is trading profits before accounting for transaction costs) in the F&O segment, followed by FPIs who earned about Rs 28,000 crore in gross profits. Against this, retail traders and others incurred a loss of over Rs 61,000 crore in FY24 (before accounting for transaction costs), the study noted. A majority of profits for FPIs and proprietary traders were made by al- go entities.
“97% profits of FPIs and 96% profits of proprietary traders came from algo entities in FY24,” according to the report. These numbers came in despite warnings and words of caution from the finance minister, the finance secretary, the CEA and the Sebi chief. The new study is expected to strengthen Sebi’s move to rein in F&O trading as the regulator works to bring in major changes to the margin system, the contract value etc, in the F&O segment.
Governments and the stock market
2009-2024

From: June 5, 2024: The Times of India
See graphic:
The Indian stock market across three governments, 2009-2024
2019-24

From: June 5, 2024: The Times of India
See graphic:
2019-24: The top performers in the Indian stock market
‘Highs’
Investing at past ‘all-time highs’
2019- 2024 July

From: July 4, 2024: The Times of India
See graphic:
Investments made at past ‘all-time highs,’ 2019- 2024 July
India’s rank in the world
2008-15: Largest stock markets in the world
See graphic:
India and the world: Market capitalisation, 2008-2015, and percentage change since 2008 crisis

2023 Feb: drops to no.7
February 23, 2023: The Times of India

From: February 23, 2023: The Times of India
Mumbai : The UK surpassed India as the sixth-largest country by market capitalisation, as the domestic market grappled with a crash in stock prices of Adani Group and a weak rupee that’s prompting foreign investors to turn net sellers.
This is the first time in nine months that the UK took the spot of sixth-largest market by value and India is at the seventh spot, a Bloomberg report said. Compared to India, a weak pound sterling is helping UK companies boost their exports and that, in turn, is leading to a surge in their stockprices, it said.
At close of trading on Tuesday, the UK had a market cap of $3. 11 trillion, about $5billion ahead of India’s, Bloomberg data showed. The table is topped by US with a market cap of almost $44 trillion, with China at the second spot with $11. 1 trillion.
So far this year, the sensex is down by about 2. 3%, while the FTSE 100, the UK’s main index, is up by 5%. Declines in Indian stocks have taken losses in MSCI India index from a December 1 peak to more than 10% as of Wednesday, putting it on course to enter a technical correction. Even so, market participants have said that investor concerns around the Adani companies are focused on the group, rather than the broader Indian market.
Investor behaviour
2021- 2023: individual investors, banks
Sep 3, 2024: The Times of India

From: Sep 3, 2024: The Times of India
Mumbai : The casino culture seen in the stock market’s derivatives segment may be rubbing off on IPO investors too. A Sebi study has pointed to the “flipping behaviour” of individual investors and banks chasing short-term gains from IPOs.
Consider this: Individual investors sold 50% of the shares allotted to them by value within a week of listing, and 70% of shares within a year. When IPO returns exceeded 20%, individual investors sold nearly 68% of the shares within a week. In contrast, only about 23% of shares were sold when returns were negative, according to the study which tracked 144 mainboard IPOs that were launched between April 2021 and Dec 2023.
The study by Sebi resear- chers found a strong disposition effect, with investors showing a greater propensity to sell IPO shares that posted positive listing gains, compared to those that listed at a loss.
A similar behavioural study by Sebi had shown that nearly 90% of investors in equity derivatives market segment lost money. It had also showed that the top 1% of the active traders who made profit were able to corner 51% of the market’s total profit.
The study showed that non-institutional investors (NIIs), popularly called the high networth individuals or HNIs, were more aggressi- ve in booking profit in the short term than the absolute retail investors. NIIs sold about 63% shares by value while retail investors sold nearly 43% shares by value, within a week of listing.
The same study also showed that banks were the most aggressive sellers of IPO shares, while mutual funds, true to their mandates, barely sold for shortterm gains. Within the first week itself, banks disposed of nearly 80% of their shares by value. In comparison, mutual funds sold just 3.3% of the shares they were allotted during the IPOs. A little over 39% of the retail investors were from Gujarat, followed by Maharashtra (13.5%), and Rajasthan (10.5%), the study noted. Also, one out of two IPO applicants held a demat account opened amid Covid, that is between 2021 and 2023.
Investors’ profile
Registrations, State-wise
2025

From: April 4, 2025: The Times of India
See graphic:
New investor registrations at the national stock exchange, State-wise, 2025
Investment by foreign investors, mutual funds
2017- 2022

From: Dec 30, 2022: The Times of India
See graphic:
Investment in stocks in India by foreign investors and mutual funds, 2017-2022
Foreign portfolio investment
More than halved to ₹26,000 crore in 2017-18
Investment by foreign investors in stock market more than halved to Rs 26,000 crore in 2017-18 on fears of faster-than-expected rate hike by the US Federal Reserve and higher valuations of Indian equities.
In comparison, overseas investors had put in Rs 55,700 crore in equities in 2016-17 after pulling out over Rs 14,000 crore in the preceding fiscal, according to the data with depositories.
However, a sharp turnaround was seen in FPI inflows into debt markets in the just-concluded fiscal as foreign investors poured in a staggering Rs 1.2 lakh crore in the segment against a net outflow of about Rs 7,300 crore in 2016-17.
Lower FPI investment in equities in FY2017-18 compared to the preceding fiscal does not come as a surprise. The decline has been steady on account of various factors such as Indian market traded at a premium to many other markets, Vidya Bala, the Head of MF Research at FundsIndia.com, said.
"Besides, fear of faster than expected US Fed rate hike resulted in outflows from FPIs in equity," she added.
On the other hand, a stable currency coupled with a higher post-inflation return in lay year led to higher inflows in debt. However, the situation is slowly reversing as there have been debt outflows in February and March of 2018.
The overall net foreign capital inflows of Rs 1.45 lakh crore have made 2017-18 as the best period for the Indian capital markets (equity and debt) in past three financial years.
This year's inflows have pushed FPIs' cumulative net investment in the Indian equity market, since being allowed over two decades ago in November 1992, to Rs 8.86 lakh crore.
The cumulative figure for debt securities has also grown to Rs 4.2 lakh crore -- taking the total for both debt and equities to Rs 13 lakh crore.
The capital poured in by FPIs is often called as 'hot money' due to its unpredictability but overseas entities are still among the most important drivers of Indian stock markets.
Going ahead, both equity and debt inflows will see volatility in 2018-19 in terms of investment by FPIs as a result of global trade tensions, Fed rate hikes in the US as well as 2019 general elections in India.
Initial Public Offerings
2016,India: third highest
The Hindu, December 14, 2016
Ashish Rukhaiyar
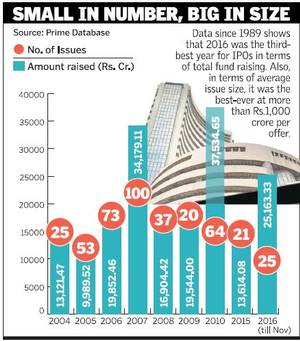
The year 2016 was the third-best since 1989 for initial public offers (IPOs) in terms of total funds raised, even though the number of public issues was far less compared with many of the earlier years.
Data from Prime Database, a primary market tracker, showthat a total of 25 companies entered the capital market with their IPOs to raise a cumulative sum of Rs.25,163.33 crore in 2016. This is the third-highest quantum raised in a single calendar year after 2010 (Rs.37,534.65 crore) and 2007 (Rs.34,179.11 crore).
Almost double
Incidentally, the funds raised in 2016 were almost double that of the previous calendar year when a total of 21 issues mobilised Rs.13,614.08 crore.
Merchant bankers attribute the trend to the strong profile of the companies that entered the capital market in 2016 along with the huge appetite that both foreign and domestic investors showed for new paper floated by Indian companies even as the secondary markets turned volatile in the last few months.
“There were a lot of good quality, less leveraged companies that launched their IPOs that also led to a trend of issues doing well post-listing,” said Subhrajit Roy, executive director, Kotak Investment Banking.
“Even as the secondary markets went choppy in the recent past, the primary market managed to register traction and perform well in the secondary market as well. The appetite among FIIs continued strong even as they have been net sellers in secondary markets in the last couple of months,” added Mr. Roy.
Some of the large-sized issues that hit the market this year were ICICI Prudential Life Insurance Company, L&T Technology Services, PNB Housing Finance, RBL Bank, Mahanagar Gas, Ujjivan Financial Services and Infibeam Corporation.
Interestingly, the year was marked with large-sized offers with the average issue size pegged at approximately Rs.1,007 crore. Prime Database has been maintaining IPO data since 1989 and this is the first time that the average size has crossed Rs.1,000 crore mark.
“Domestic and foreign investors found India a growth market and showed good appetite resulting in the IPOs getting good acceptance throughout the year,” said Ajay Saraf, executive director, ICICI Securities. Even retail investors saw equity as an attractive option at a time when interest rates were falling, he added.
Meanwhile, bankers are hoping that the positive trend will continue in the next year as well though they add that the recent demonetisation move of the government might impact the appetite in certain sectors, especially those that are directly impacted by discretionary spends of consumers.
“The trend should continue in the next year as well though there might be some softening due to the demonetisation factor. Companies from consumer discretionary sector might see an impact though demonetisation has led to a positive shift from unorganised to organised segments,” said Mr.Roy.
Demonetisation boost
According to Mr.Saraf, the demonetisation move might actually boost the investments in equity as more money would come within the formal channel and those with an investment horizon of 4-5 years would look at equity as an attractive investment avenue.
2012-17: SME equity fund raisings
Partha Sinha, SME IPO mop-up jumps 3-fold, December 16, 2017: The Times of India
From: Partha Sinha, SME IPO mop-up jumps 3-fold, December 16, 2017: The Times of India
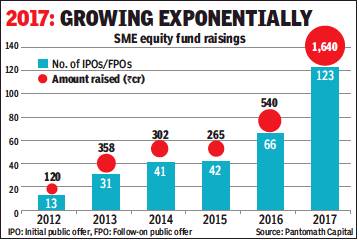
This has been a blockbuster year for SME initial public offers (IPOs).
Consider this: With 123 companies mobilising about Rs 1,640 crore in 2017, it was a threefold jump in terms of amount raised compared to 2016, while the number of issuances were nearly double the previous year. The total amount raised in 2017 alone by SMEs was more than the aggregate amount raised in the previous five years, industry data showed. Although in comparative terms — about Rs 65,000 crore raised through IPOs by large companies — market players said the trend is definitely positive for SMEs tapping the stock market for funds.
The current year also witnessed two SME IPOs that were subscribed more than 100 times, with the highest being a 261-time subscription for Ice Make Refrigeration IPO that generated a book size of Rs 6,200 crore for the issue size of Rs 23.7 crore. And in early November, the IPO for ANI Integrated Solutions was subscribed 200 times.
The SME boost came on the back of strong growth potentials, attractive valuations and increasing institutional interest for shares of small & medium enterprises (SMEs). “SMEs come up with attractive valuations at early stage of their business cycle with high growth potentials and so are being noticed by large fund houses besides portfolio managers and ultra HNIs,” said Mahavir Lunawat, group MD, Pantomath Capital Advisors, a leading merchant banker to SMEs going public.
The current year also witnessed, for the first time since dedicated stock trading platforms for SME shares were launched in 2012, two anchor investors picking up stakes in an SME, One Point One Solutions, just a day before the IPO was opened. On Friday, the IPO closed with a 85 times oversubscription, with a total book size of about Rs 2,700 crore for its Rs 32-crore nonanchor part. This made it the third most subscribed SME IPO in India. Pantomath Capital was the merchant banker to One Point One Solutions, while Yoda Strategic Advisory, a new-age consultancy firm, was the adviser to the company.
According to data on the NSE website, the HNI portion was subscribed 336 times with total demand for 31.7 crore shares, the retail part was subscribed 30.6 times and the institutional part was subscribed 15 times. According to the merchant banker, at 336 times, this was the highest ever HNI subscription figure for any SME IPO.
Earlier this week, domestic lender Yes Bank and a fund managed by global financial major HSBC invested nearly Rs 12.1 crore in the Rs 43-crore IPO for this Navi Mumbai-based company which is into business process management services.
Market capitalisation to GDP ratio
2004-21

From: April 27, 2021: The Times of India
See graphic:
The market capitalisation to-GDP ratio in India, 2004-21
2020

From: December 19, 2020: The Times of India
See graphic:
The market capitalisation to-GDP ratio in India vis-à-vis some major economies and the global average, presumably as in late 2020.
2009- 22 / 23

From: Dec 13, 2022: The Times of India
See graphic:
Market capitalization to GDP ratio 2009- 22
As in 2023, May
May 30, 2023: The Times of India

From: May 30, 2023: The Times of India
Mumbai : As the Indian market rallied on the back of the resolution of the US government debt default crisis and its market cap went up to $3. 3 trillion (Rs 286. 6 lakh crore), the country regained its spot as the fifth biggest stock market in the world.
At the current level, India’s market cap is at almost a five-month high.
The rally in the Indian market over the last two months, helped mainly by strong foreign fund buying on the back of stable macroeconomic fundamentals and weakness in China, put it ahead of France — which on Friday had a market cap of $3. 2 trillion, data from Bloomberg showed. The top four spots inthe market cap league table are taken by the US at $44. 5 trillion, China $10. 3 trillion, Japan $5. 7 trillion and Hong Kong $5. 1 trillion.
The feel-good rally also took the sensex above the 63,000 mark after nearly six months. The sensex opened at 62,802 points, up about 300 points, rallied to an intra-day high of 63,026 points, but closed a tad lower from its nearsix-month-high figure at 62,846 points, up 345 points, or 0. 6%.
Late 2024

From: Jan 20, 2025: The Times of India
See graphic:
The Market capitalisation to GDP ratio in China, India, Japan, the UK and the USA, presumably as in late 2024
PE: Sensex ratio
1998-2020

From: December 19, 2020: The Times of India
See graphic:
India, 1998-2020: the Sensex: PE (price-to-earning) ratio. The Times of India observes: “An all-time high price-to-earning (PE) ratio - the measure of how much investors are willing to pay for each rupee of each rupee of earnings - is a sign to be cautious.” ‘Current’ refers to Dec 2020.
Penny stocks
Penny stocks: 1995- 2021
See graphic:
India- Penny Stocks Index, 1995- 2021
On penny stocks...
Low-priced stocks are commonly called “penny stocks”. They are popular because they are affordable even for investors who wish to enter the market with modest capital at their disposal. They can also be highly rewarding because a share costing, say, Rs 8 can reach Rs 80. A ten-fold increase is more possible here than in a share costing Rs 80 increasing to Rs 800.
But remember, a share is usually low-priced for a good reason: its fundamentals are weak – the underlying business is not profitable, the company is heavily debt-laden, the management is under a cloud etc. Penny stocks are more risky than high priced shares, which are priced higher and offer a greater margin of safety. I never invest in penny stocks and would always advise against them.
...and IPOs
I do not apply for IPOs and would not recommend that route to anyone, especially new investors. Investing in IPOs can be quite tricky. Those putting them in the market often price them too high. They know how much the shares are worth and it is only to be expected that they would attempt to extract the maximum money from the general public, who are not as well-informed about the business. Quite often the promoters allot shares to themselves, their friends and relatives at a price substantially lower than the price at which the shares are being offered to the retail investor. Then, if the shares are attractively priced then they are heavily oversubscribed. It then becomes a lottery. Either one does not get an allotment or the allotment is too meagre to be considered worthwhile. Also, one can never be sure about the price at which the shares will be listed or the price at which they will be available, say, in one year’s time.
Finally, there is always a possibility of getting the full allotment if the IPO is not fully subscribed. In such cases, the listing price is likely to be below the price at which it is offered in the IPO. This results in a loss as one has to get rid of the huge number of unwanted shares at a price below what you’ve paid for them.
On doing your homework
There is no substitute for being well-informed when making decisions. I subscribe to an advisory service, read the business newspapers, consider recommendations and advice from the brokerages with whom I deal, watch business channels on TV and generally keep abreast of news which can impact the share market. The only other way of deciding what to buy/sell is inside information but, apart from it being illegal, it is also difficult to come by.
And finally, a little technical advice
At one time I was trading actively in futures and options. But the system is very unfair to people who do that (versus people who take possession of the stock). These are the most exciting part of the market but for the same reason also most dangerous. Just as one can make the most amount of money from them, so can one lose the most. Sophisticated techniques like using covered calls are safe ways of making money from options but I do not indulge in this part of the market because the government considers it to be “speculation” and the income is considered “business” income. The accounts have to be audited by a professional chartered accountant, advance tax has to be paid and the rate of taxation is much higher.
The tax law is also unfair: the capital loss in one year can be set off against capital gain in subsequent years but if one has made a capital gain first then the capital loss in subsequent years cannot be used for claiming a refund of the tax already paid for the capital gain! This is why I only do investments these days; at this time of my life, I want to be peaceful.
In conclusion I would only say that there is nothing more exciting than to invest in the share market. One’s heart leaps up when a share one has purchased goes up sharply and it is a most satisfying feeling to know that one’s judgement has been correct. An increase in one’s bank balance also does no harm!
Rallies in the stock market, major historical
2018, Jan: third fastest 1,000-point Sensex jump
January 24, 2018: The Times of India
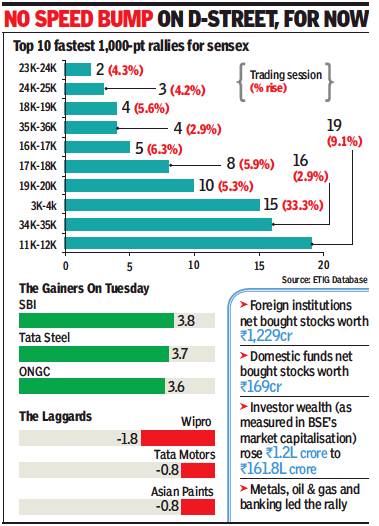
From: January 24, 2018: The Times of India
The sensex continues to scale new peaks. The index on 23 Jan 2018 went past the 36k mark for the first time in history. The sensex took just four sessions to rally from 35k to the next milestone of 36k — the third fastest 1,000-point jump for the index, tied with 18k-19k journey in October 2007.
A slew of factors — including robust corporate results, strong buying by foreign funds, expectations of global growth picking up pace and government’s resolve to move ahead with economic reforms — boosted market sentiment with the sensex gaining 342 points to end at at 36,140. The IMF’s prediction that the Indian economy will grow at 7.4% during the current year also added to the upbeat sentiment on Dalal Street, dealers said. The NSE’s Nifty too broke through the 11k ceiling and closed at 11,084, up 118 points on the day.
India’s longest bull runs, 2009-2018, Aug
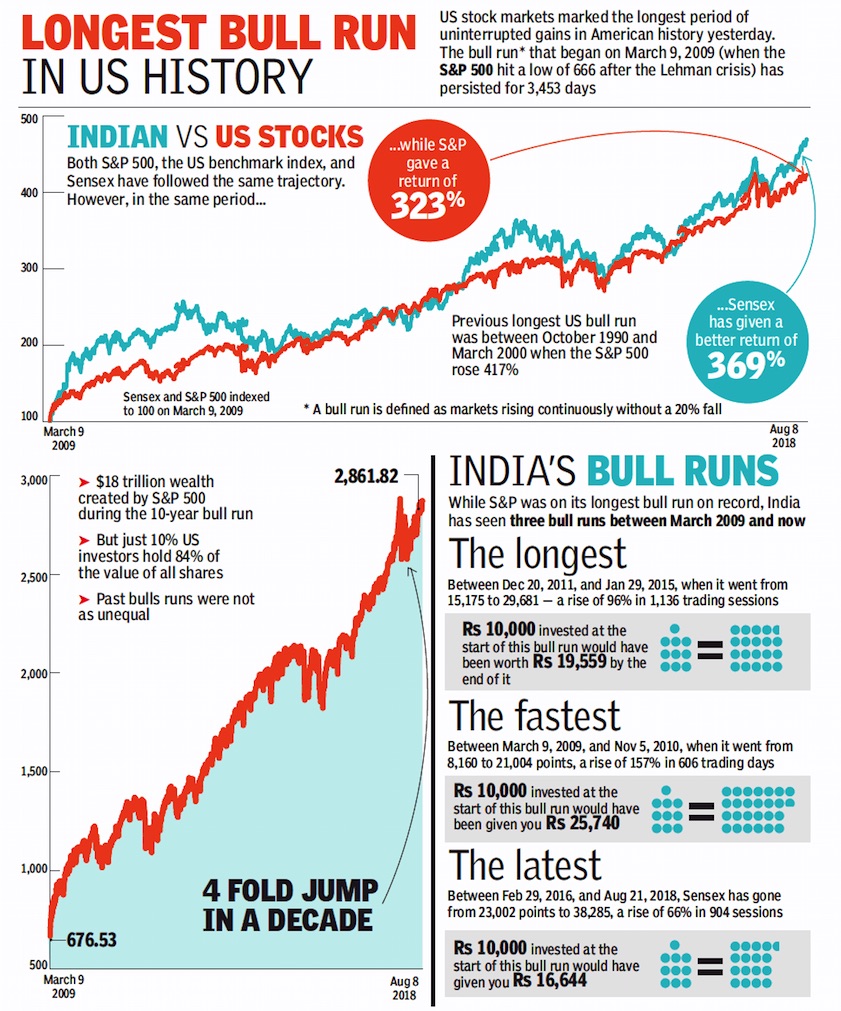
From: August 24, 2018: The Times of India
See graphic:
India’s (and the USA’s) longest bull runs, till 2018, August
Scams, scandals
1991, 2001
January 22, 2021: The Times of India
When Scams Rocked Street The biggest stock market scams that happened in the decades following liberalisation are the stories of two fraudsters who tried to control the beast by tapping the deepest pool of funds in the country — the banking system.
Harshad Mehta, who captured the nation’s imagination, yanked the sensex from 1,194 points in April 1991 to 4,467 in April 1992. He managed to do this by accessing a reservoir of funds from the interbank bond markets where he was a broker. In the absence of a centralised authority, bond market participants paid money directly into the broker’s account. But even Mehta could not satiate the beast and his scam was exposed.
In 2001, Ketan Parekh, a low-key stockbroker, came into the limelight. Close on the heels of the dotcom boom, Parekh focused on select IT and telecom shares. These ‘K-10’ stocks went up nearly 100 times. His story, too, was shortlived as it turned out that he was getting funds by borrowing against dud demand drafts that were issued by Ahmedabad-based Madhavpura Mercantile Cooperative Bank, which did not even have enough money to cover the DDs.
Scams, scandals: the impact of on the stock market
2000- 23
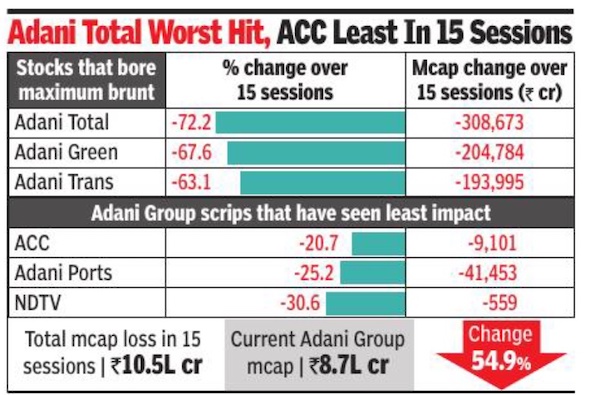
From: Partha Sinha & Reeba Zachariah TNN, February 16, 2023: The Times of India
See graphic:
The impact of scams, scandals on the Indian stock market, 2000- 23
Volatility
2012–2022

From: Oct 8, 2022: The Times of India
See graphic:
Volatility in Indian equities, 2012-2022
World markets and India
2018: India no. 6 in the world
India's stock market is now bigger than Germany's, December 22, 2018: The Times of India
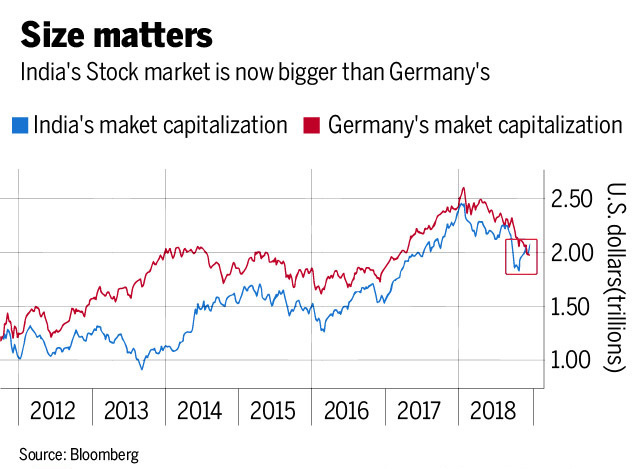
From: India's stock market is now bigger than Germany's, December 22, 2018: The Times of India
India's ascent on the global stage has claimed another victory after its stock market overtook Germany to become the seventh largest in the world.
The Asian giant edged past the equity market of Europe's largest economy for the first time in seven years, according to data compiled by Bloomberg. That means, after the UK leaves the European Union in March, the bloc would have only one country — France — among the seven biggest markets.
The move reflects India's positive returns this year as companies' reliance on domestic demand enabled them to avoid the meltdown in other emerging markets spurred by Federal Reserve tightening and a trade war between the US and China. It also highlights the challenges facing the EU, including its future relationship with the UK, a standoff with Italy over budget allocations and separatist clashes in Spain.
While the MSCI Emerging Markets Index is heading for a 17 percent decline this year, India's benchmark S&P BSE Sensex is up 5 percent after seesawing throughout the year amid oil-price volatility.
In a year dominated by trade protectionism and punitive tariffs by Donald Trump's administration on China, it's little wonder that investors have turned cautious over countries with a heavy dependence on exports.
Germany derives more than 38 percent of its gross domestic product from exports, based on 2017 data from World Bank. The corresponding ratio for India is only 11 percent, meaning much of the stock-market opportunity in the country comes from domestic consumer stories.
The reliance on local demand and entrepreneurship also puts India ahead in growth sweepstakes. The south Asian nation is projected to grow 7.5 percent this year and 7.3 percent in 2019, a far cry from German growth of 1.6 percent for each year.
2018-19: India better than comparable markets

From: Indian capital markets beat global peers with over 15% return in FY19, April 15, 2019: The Times of India
Indian capital markets outperformed several major global markets, including the developed ones like the US and the UK as well as developing economies like China and Brazil, with double-digit returns in the fiscal ended March 2019 despite numerous global and domestic headwinds, data shows. The Indian market benchmark indices also improved on their own performance in the previous fiscal, with the sensex (17%) giving relatively better returns than the NSE’s Nifty (15%) in 2018-19.
An analysis of equity markets returns for these countries shows that the Indian benchmark indices had underperformed those in the US, Brazil, Japan, South Korea and Hong Kong in 2017-18, though the performance was better than the UK and China even in that year. With positive performance by benchmark indices and increasing fund raising from the market, the size of the capital markets in India also continued to expand during 2018-19, with the market capitalisation rising by over 6% to over Rs 151 lakh crore.
Besides, mutual fund asset under management grew by 11.4% to nearly Rs 24 lakh crore and Foreign Portfolio Investors’ asset under custody expanded by 8.6% to close to Rs 30 lakh crore. This is despite the fact that 2018-19 was relatively a difficult and challenging year on account of global and domestic headwinds.
Fund-raising from the capital markets also continued its positive trend during 2018-19, with funds raised through debt and equity rising by 5.3% to nearly Rs 9 lakh crore. The double-digit returns came in despite subdued sentiments at times in view of certain negative developments since September 2018, particularly on the fixed-income securities front.
On the mutual fund front, debt-oriented funds witnessed net outflows on the back of certain developments in debt market since September 2018. But, equity-oriented mutual funds continued to receive positive net inflows across all months during 2018-19 and other mutual funds received positive net inflows in 10 out of 12 months of the financial year. AGENCIES
See also
Sensex <> The stock market: India <> Mutual Funds: India <> Currency: India <> Gold in the Indian economy <> Sovereign credit ratings: India <> Corporations, corporate performance: India

