The stock market: India
This is a collection of articles archived for the excellence of their content. Readers will be able to edit existing articles and post new articles directly |
2013: High index levels hide lurking weakness
Around 550 Stocks On The NSE Have Fallen By More Than Half between 2008 and 2013
TIMES NEWS NETWORK
The Times of India 2013/08/15
Though in 2013 the Nifty seemed to be holding up to 2008 levels, it was less reflective of the economy and the worsening macroeconomic situation. More than 550 stocks among the actively traded ones on the National Stock Exchange (NSE) have tumbled by more than half between 2008 and 2013.
The price to book (P/B) valuation has dropped from 7.1 times in 2008 to 5.1 times in 2013 for Nifty firms. The changing dominance and outperformance by a few sectors such as consumer discretionary, private sector financial services companies and export-orientated sectors such as information technology (IT) and pharmaceuticals is holding key indices to almost levels seen in January 2008.
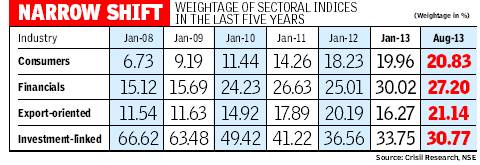
Investment-linked sectors such as materials, industrials, energy, utilities and telecom dominated the Nifty with a weightage of 66% in January 2008, data compiled by ratings agency Crisil showed. The weightage of any company/sector in the index is determined by the relative (to other companies/ sectors) free-float market capitalisation of the constituents.
The 2013 slowdown has resulted in poor performance of these sectors, shrinking valuation multiples resulting in a steep drop in the stock prices thereby lowering their cumulative weightage to 31% in July 2013. The aggregate earnings of companies in these sectors remained almost flat during the period.
As many as 22 out of 27 companies in these sectors (among 2008 Nifty constituents) gave negative returns. On the valuation side, the weighted average P/B multiple of companies shrank from 7.3 times in 2008 to 1.7 times in 2013.
Strong financial performance and increase in valuations of consumption and export-orientated sectors led to rebalancing of the weightage in their favour. These performing sectors, which include IT and pharma companies, now command 65% weightage in the index compared to 29% in 2008. Consumer-orientated sectors and private sector financial services firms have benefited from the consumption boom and government policies while IT and pharma have gained from the recovery in the global economy and weakening rupee. Among the biggest gainers of the pack are Lupin (599%) and Sun Pharmaceutical Industries (372%). During the past five years, aggregate PAT (profit after tax) of the companies in these performing sectors has grown at a CAGR (compounded annual growth rate) of 21.9%.
Along with reconstitution of the Nifty, the concentration of top-10 stocks too has changed—it is at a five-year high of 59.1% now compared to 53.3% in January 2008. Further, six companies, which were part of the top-10 list in 2008, have now been replaced.
