Industries, India: 1
(→1991-2014: Proposals, actual investment and job creation) |
|||
| Line 30: | Line 30: | ||
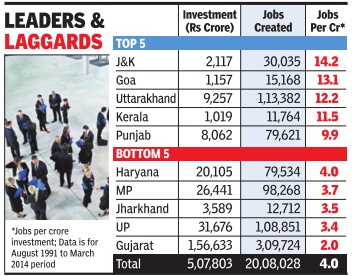
Every crore of rupee invested in Jammu and Kashmir created about 12 jobs, while in Gujarat a crore of investment yielded only two jobs. In the investment to job creation ratio, Jammu and Kashmir is followed by Goa, Uttarakhand, Kerala and Punjab, where ten or more jobs were created per crore of investment. The worst stateUTs in this list are Madhya Pradesh, Jharkhand, Daman & Diu, UP and Gujarat. | Every crore of rupee invested in Jammu and Kashmir created about 12 jobs, while in Gujarat a crore of investment yielded only two jobs. In the investment to job creation ratio, Jammu and Kashmir is followed by Goa, Uttarakhand, Kerala and Punjab, where ten or more jobs were created per crore of investment. The worst stateUTs in this list are Madhya Pradesh, Jharkhand, Daman & Diu, UP and Gujarat. | ||
| + | |||
| + | =2015: Growth 9.8%, highest in 5 years= | ||
| + | [http://epaperbeta.timesofindia.com/Article.aspx?eid=31808&articlexml=Mfg-spurs-industrial-growth-to-5-yr-high-12122015001065 ''The Times of India''], December 12, 2015 | ||
| + | [[File: Why 2015 growth was the highest in 5 years.jpg| Why 2015 growth was the highest in 5 years ; Graphic courtesy: [http://epaperbeta.timesofindia.com/Article.aspx?eid=31808&articlexml=Mfg-spurs-industrial-growth-to-5-yr-high-12122015001065 ''The Times of India''], December 12, 2015|frame|500px]] | ||
| + | [[File: Industrial growth in India, 2011-15.jpg| Industrial growth in India, 2011-15; Graphic courtesy: gc [http://epaperbeta.timesofindia.com/Article.aspx?eid=31808&articlexml=Mfg-spurs-industrial-growth-to-5-yr-high-12122015001065 ''The Times of India''], December 12, 2015|frame|500px]] | ||
| + | |||
| + | '''Mfg spurs industrial growth to 5-yr high''' | ||
| + | | ||
| + | | ||
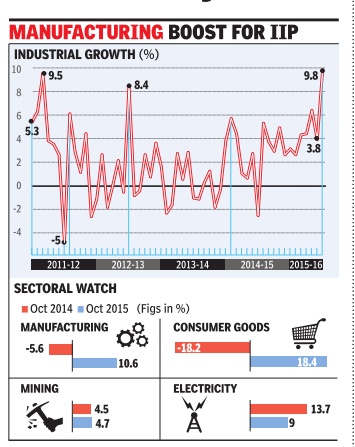
| + | Buoyed by strong festive demand, industrial growth hit a five-year high of 9.8% during October as the manufacturing sector clocked a double-digit rise. But economists warned that too much should not be read into a month's data. | ||
| + | The sharp rise in index of industrial production was propelled by manufacturing, which grew 10.6% in October, data released on Friday showed. | ||
| + | |||
| + | While mining activity saw a marginal pick-up, there was strong growth in electricity too. Industrial activity had contracted by 2.7% during October 2014 and was estimated to have grown by just 3.8% in September, 2015. | ||
| + | |||
| + | Although economists said the higher-than-expected sho wing was on account of a low base, the data is in line with trends from the second quarter GDP data, which had estimated that the manufacturing sector grew by 9.3%.Consumer durables clocked 42.2% growth. Strong industrial growth in October beat analyst estimates and augurs well for the economy and job creation. Consumer durables, evident from auto sales data that were released last month, emerged as a star, clocking 42.2% growth, compared to 35% contraction in October 2014. There was also a strong performance from consumer goods (18.4%) and capital goods (16.1%). In recent months, there has been a revival in the capital goods segment which indicates that the overall industrial activity may be more robust as machinery and equipment will be used for further production in factories and plants. | ||
| + | |||
| + | While there was reason to cheer for the government, there was also a word of caution. “The latest October IIP is very good. It's a high number, good number and encouraging number. But one has to be a little bit careful in interpreting this number... especially this month as there is a Diwali effect,“ chief economic advisor Arvind Subramanian told reporters. | ||
| + | |||
| + | Economists too warned that it may a little early to celebrate. “The moderate 4.8% industrial growth in April-October 2015 (compared to 2.2% a year ago), lends support to the view that a narrow economic recovery is underway . The spike in industrial growth is likely to be a short-lived statistical aberration. With a reversal of the base effect, we expect a substantial moderation in IIP growth in November 2015, in line with the trend recorded by automobile production... Additionally, a sharp slowdown in growth of thermal electricity generation is expected to weigh upon the performance of the IIP in November 2015,“ Aditi Nayar, economist at ratings agency ICRA said. | ||
Revision as of 07:45, 16 December 2015
This is a collection of articles archived for the excellence of their content. |
1991-2014: Proposals, actual investment and job creation
Investment proposals don't meet promises
Atul thakur The Times of India Mar 06 2015
In 23 Years, Rs 5.1L Cr Came, 20.1L Jobs Created Against Proposed Rs 102L Cr, 2.3Cr Employment
Investment proposals by corporates are generally associated with improving business sentiment and often linked with the possibility of job creation. The comparison of proposed investment with actual implementation and job creation in the past 23 years, however, shows that the actual delivery has fallen well short of the promise. Data from the department of industrial policy and promotion shows that between August 1991 and March 2014, the government received about 94,000 investment proposals. These proposals include Industrial Investment Intentions through Entre preneurs Memorandum -IEMs (delicensed sector) and Direct Industrial Licences (licensable sector).
Put together, these proposed the investment of more than Rs 102 lakh crore and were supposed to create 2.3 crore jobs.
The data on actual implementation of these proposals shows that only Rs 5.1 lakh crore was actually invested and just 20.1 lakh jobs created. That's less than 5% of the proposed investments and 8.9% of the promised jobs.
A state-wise analysis of proposals shows that between August 1991 and March 2014 corporates proposed to invest Rs 15.4 lakh crore in Orissa -the highest in the country. It was folllowed by Gujarat and Chhattisgarh receiving over Rs 10 lakh crore of proposed investments and Maharashtra just a tad below that mark. Overall, there were 15 states, which were vestments in these 23 years.When one analyses actual investments, Haryana has been the most successful among these 15 states in converting proposals to reality as 18.9% of the proposed money actually reached the state. It is followed by Gujarat (12.6%) and Uttar Pradesh (11.4%). The states that fared the worst in this conversion are Bihar, Jharkhand, Chhattisgarh and Orissa, where less than 1% of the proposed money actually arrived.
So, what is the investment to job creation ratio? Overall, the Rs 5 lakh crore actually invested created a little over 20 lakh jobs, which amounts to four jobs per crore of inve stment. There were 25 states which witnessed the actual investment of more Rs 1,000 crore. Among these states, Jammu and Kashmir witnessed the most labour intensive investments, while Gujarat had the most capital intensive ones.
Every crore of rupee invested in Jammu and Kashmir created about 12 jobs, while in Gujarat a crore of investment yielded only two jobs. In the investment to job creation ratio, Jammu and Kashmir is followed by Goa, Uttarakhand, Kerala and Punjab, where ten or more jobs were created per crore of investment. The worst stateUTs in this list are Madhya Pradesh, Jharkhand, Daman & Diu, UP and Gujarat.
2015: Growth 9.8%, highest in 5 years
The Times of India, December 12, 2015


Mfg spurs industrial growth to 5-yr high Buoyed by strong festive demand, industrial growth hit a five-year high of 9.8% during October as the manufacturing sector clocked a double-digit rise. But economists warned that too much should not be read into a month's data. The sharp rise in index of industrial production was propelled by manufacturing, which grew 10.6% in October, data released on Friday showed.
While mining activity saw a marginal pick-up, there was strong growth in electricity too. Industrial activity had contracted by 2.7% during October 2014 and was estimated to have grown by just 3.8% in September, 2015.
Although economists said the higher-than-expected sho wing was on account of a low base, the data is in line with trends from the second quarter GDP data, which had estimated that the manufacturing sector grew by 9.3%.Consumer durables clocked 42.2% growth. Strong industrial growth in October beat analyst estimates and augurs well for the economy and job creation. Consumer durables, evident from auto sales data that were released last month, emerged as a star, clocking 42.2% growth, compared to 35% contraction in October 2014. There was also a strong performance from consumer goods (18.4%) and capital goods (16.1%). In recent months, there has been a revival in the capital goods segment which indicates that the overall industrial activity may be more robust as machinery and equipment will be used for further production in factories and plants.
While there was reason to cheer for the government, there was also a word of caution. “The latest October IIP is very good. It's a high number, good number and encouraging number. But one has to be a little bit careful in interpreting this number... especially this month as there is a Diwali effect,“ chief economic advisor Arvind Subramanian told reporters.
Economists too warned that it may a little early to celebrate. “The moderate 4.8% industrial growth in April-October 2015 (compared to 2.2% a year ago), lends support to the view that a narrow economic recovery is underway . The spike in industrial growth is likely to be a short-lived statistical aberration. With a reversal of the base effect, we expect a substantial moderation in IIP growth in November 2015, in line with the trend recorded by automobile production... Additionally, a sharp slowdown in growth of thermal electricity generation is expected to weigh upon the performance of the IIP in November 2015,“ Aditi Nayar, economist at ratings agency ICRA said.
