Industries, India: 1
This is a collection of articles archived for the excellence of their content. |
Contents |
Growth
2011-15
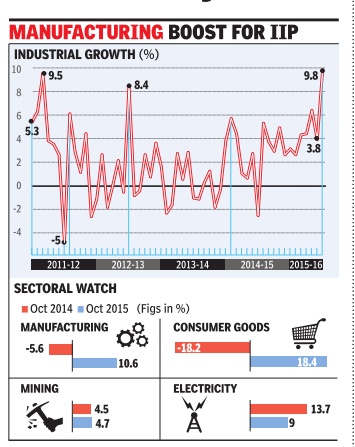
See graphic, 'Industrial growth in India, 2011-15 '
2012-14 vs. 2014-17
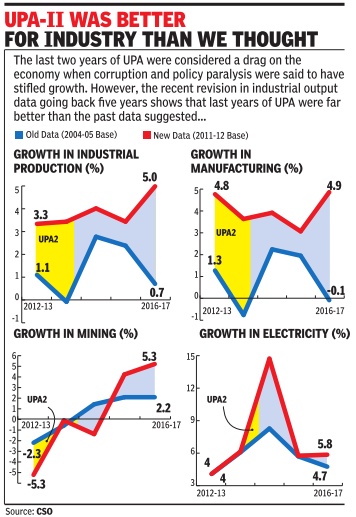
See graphic, ' Industrial growth, 2012-14 (UPA-II) vs. 2014-17'
2015: 9.8%, highest in 5 years
The Times of India, December 12, 2015

See graphic, 'Why 2015 growth was the highest in 5 years '
Mfg spurs industrial growth to 5-yr high Buoyed by strong festive demand, industrial growth hit a five-year high of 9.8% during October as the manufacturing sector clocked a double-digit rise. But economists warned that too much should not be read into a month's data. The sharp rise in index of industrial production was propelled by manufacturing, which grew 10.6% in October, data released on Friday showed.
While mining activity saw a marginal pick-up, there was strong growth in electricity too. Industrial activity had contracted by 2.7% during October 2014 and was estimated to have grown by just 3.8% in September, 2015.
Although economists said the higher-than-expected sho wing was on account of a low base, the data is in line with trends from the second quarter GDP data, which had estimated that the manufacturing sector grew by 9.3%.Consumer durables clocked 42.2% growth. Strong industrial growth in October beat analyst estimates and augurs well for the economy and job creation. Consumer durables, evident from auto sales data that were released last month, emerged as a star, clocking 42.2% growth, compared to 35% contraction in October 2014. There was also a strong performance from consumer goods (18.4%) and capital goods (16.1%). In recent months, there has been a revival in the capital goods segment which indicates that the overall industrial activity may be more robust as machinery and equipment will be used for further production in factories and plants.
While there was reason to cheer for the government, there was also a word of caution. “The latest October IIP is very good. It's a high number, good number and encouraging number. But one has to be a little bit careful in interpreting this number... especially this month as there is a Diwali effect,“ chief economic advisor Arvind Subramanian told reporters.
Economists too warned that it may a little early to celebrate. “The moderate 4.8% industrial growth in April-October 2015 (compared to 2.2% a year ago), lends support to the view that a narrow economic recovery is underway . The spike in industrial growth is likely to be a short-lived statistical aberration. With a reversal of the base effect, we expect a substantial moderation in IIP growth in November 2015, in line with the trend recorded by automobile production... Additionally, a sharp slowdown in growth of thermal electricity generation is expected to weigh upon the performance of the IIP in November 2015,“ Aditi Nayar, economist at ratings agency ICRA said.
2013 Nov-2018 Nov

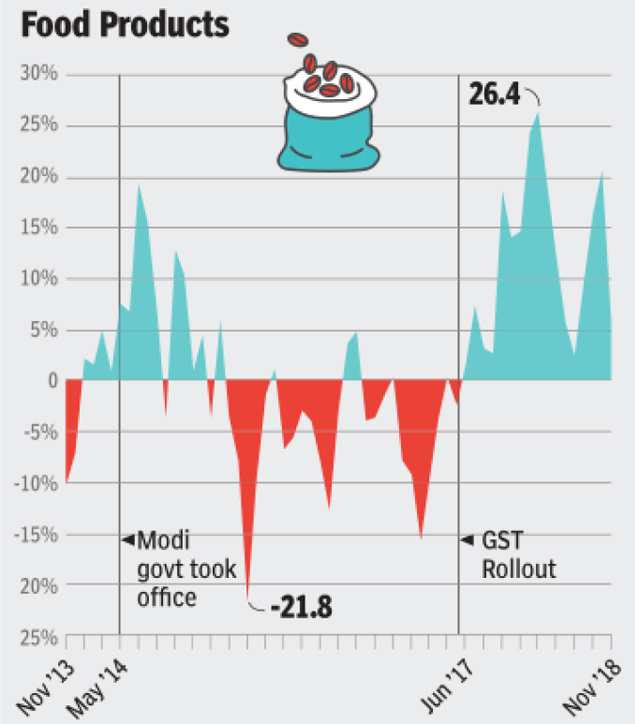
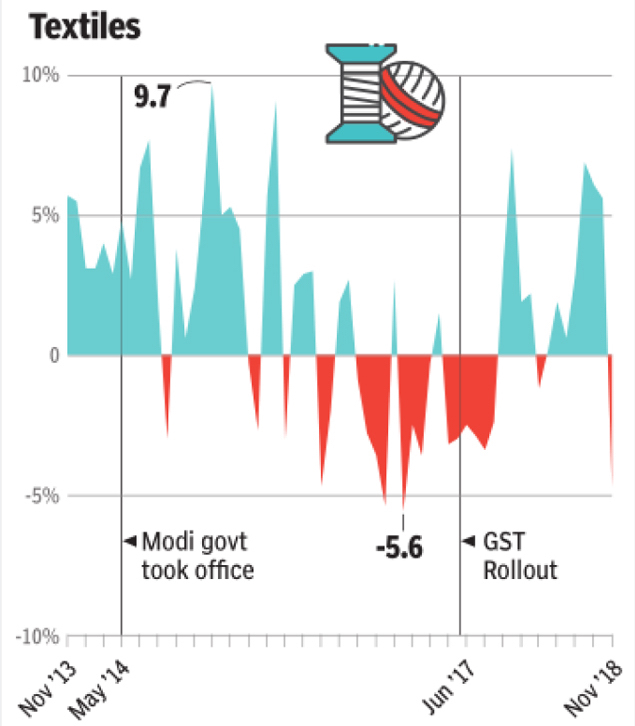
Here's a look at how five key sub-indices of the IIP have performed in the past five years:
Industrial growth in India, 2013 Nov-2018 Nov
From: February 2, 2019: The Times of India
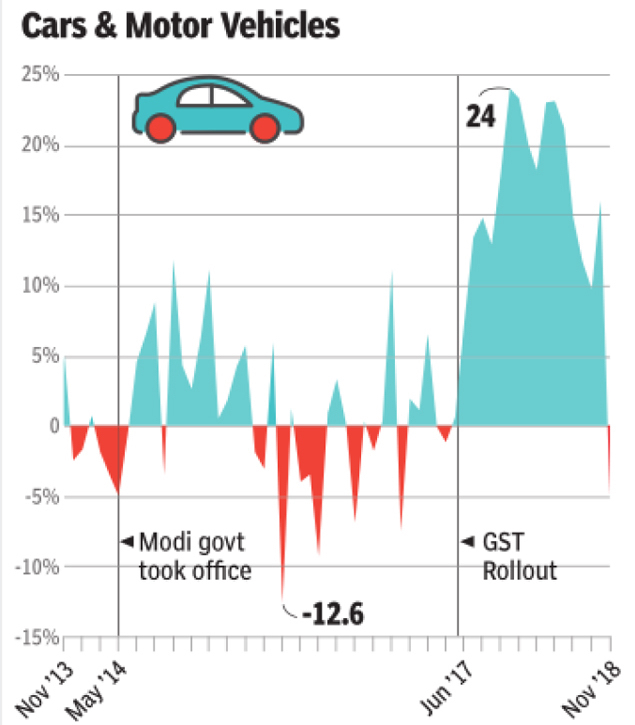
From: February 2, 2019: The Times of India
From: February 2, 2019: The Times of India
From: February 2, 2019: The Times of India

From: February 2, 2019: The Times of India
See graphics:
Industrial growth in India, 2013 Nov-2018 Nov
Car and motor vehicles' growth in India, 2013 Nov-2018 Nov
Food products' growth in India, 2013 Nov-2018 Nov
Textiles' growth in India, 2013 Nov-2018 Nov
2014 May- 2019 Jan
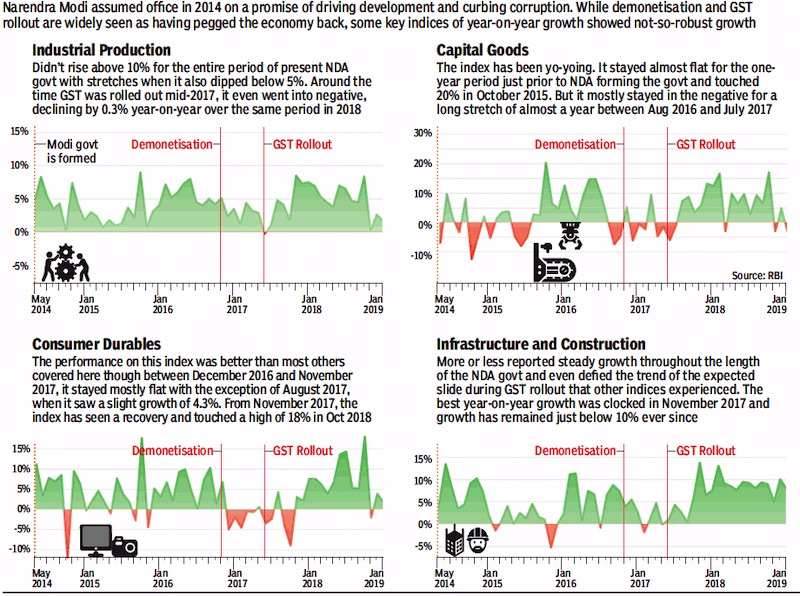
i) Production
ii) Capital goods
iii) Consumer durables,
iv) Infrastructure and construction.
From: April 2, 2019: The Times of India
See graphic:
2014 May- 2019 Jan: The performance of Indian industry
i) Production
ii) Capital goods
iii) Consumer durables,
iv) Infrastructure and construction.
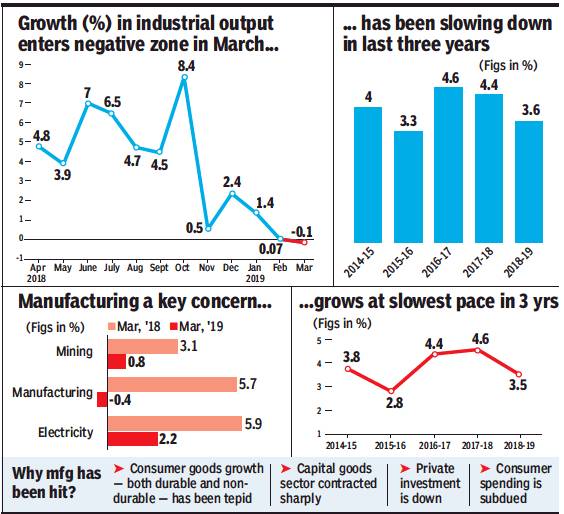
2014-19: output shrinks for first time in 2 years
May 11, 2019: The Times of India
From: May 11, 2019: The Times of India
Industrial output shrinks for first time in nearly 2 yrs
Decline In Mfg Sector Takes Toll Presents Next Govt A Challenge
New Delhi:
India’s industrial output contracted in March — the first time in nearly two years — after being dragged down by a decline in key manufacturing and capital goods sectors. The development poses a tough challenge for the new government, which assumes office later this month, to reverse the slowdown. Data released by the Central Statistics Office (CSO) on Friday showed industrial output fell 0.1% in March, below February’s downwardly revised 0.07%, and 5.3% posted in March 2018. The manufacturing sector, which accounts for over 77% of the index of industrial production (IIP), contracted 0.4% during the month, compared to a 5.7% expansion in March 2018.
The latest data comes against the backdrop of a slowdown in several sectors such as automobiles. GDP growth in the October-December quarter of 2018-19 slowed to 6.6%, while CSO has estimated growth for 2018-19 at 7%, marginally down from the previous estimate of 7.2%. The latest purchasing manager’s index (PMI) showed factory activity slowed to an eight-month low in April.
A finance ministry report also said that the economy appears to have slowed down in 2018-19 and had listed some challenges that need to be addressed for faster expansion.
Economists said the sharp decline in growth was worrisome and much would depend on the policies that the new government adopts to reverse the slowdown. “Consumer spending will increase only gradually and hence there would be a tendency for growth to be subdued in the first few months of FY20. The important part will be government expenditure and the decision taken on capex before the main budget is introduced,” said Madan Sabnavis, chief economist at Care ratings. The RBI is expected to cut interest rates in June.
Index of Industrial Production (IIP)
Changes introduced in May 2017
Puja Mehra, May 17, 2017: The Hindu
• Objective of calculating Index of Industrial Production :
○ To capture the direction and the trend of industrial production in the country, not the absolute value of industrial production in the country.
• Problems till May 2017 :
○ It was measuring industrial output using baskets of production items and producing entities that had remained unchanged since 2004-05.
○ The standard procedure followed was that a list of items was constructed in the base year and for each item the producing entities were identified.
○ If the entity shut down, its output fell to zero. But since the basket was frozen, no new entity could be taken in place of the zero-output one.
○ Over time, an item may fall out of use and more smartphones may be consumed. The IIP was not equipped to capture such changes in the economy.
• Changes introduced :
○ The IIP growth acquired a certain directional bias, which impaired its usefulness.
○ To overcome the weaknesses, the IIP is being made more dynamic. The improvements in the statistics apparatus have been carried out on the recommendations of a committee that the UPA government set up in 2012 under the chairmanship of Saumitra Chaudhari , a member of the Economic Advisory Council of PM Manmohan Singh.
i.) The Central Statistics Office has updated its base year to 2011-12.
-The revision, the ninth such exercise since the original base year choice of 1937, is aiming at capturing the changes that have taken place in the industrial sector since 2004-05.
-New products have been included in the basket, and those that have lost relevance deleted. Fore example, Renewable energy has been included in the electricity index.
ii.) Instead of the periodic baskets revisions, a permanent standing arrangement is being put in place to make sure that the IIP remains representative.
Limitations of the IIP/ As in 2019
July 6, 2019: The Times of India
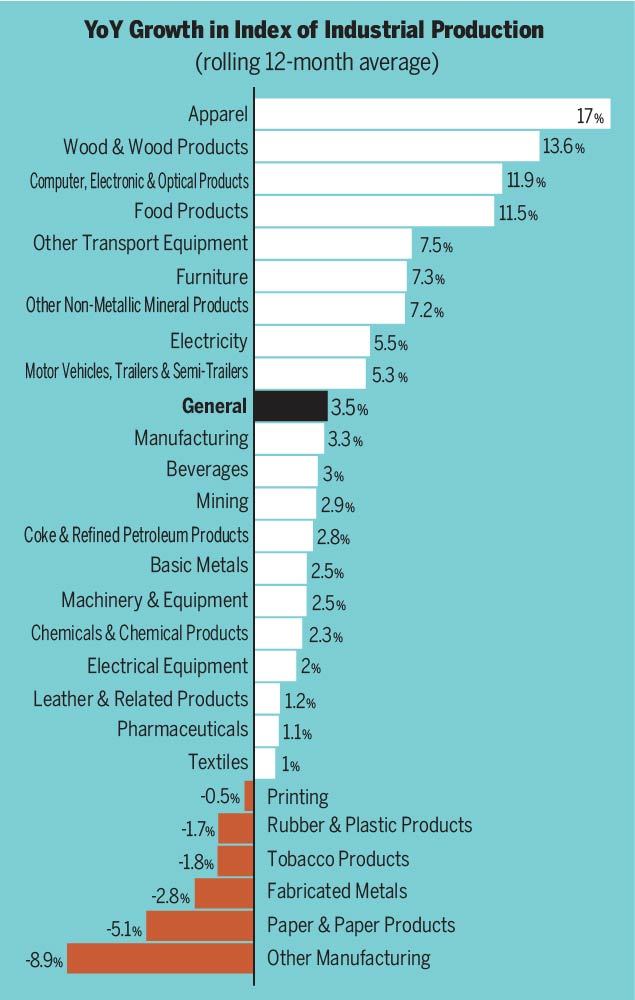
From: July 6, 2019: The Times of India
In April 2019, the overall index of industrial production rose only 3.4% over its level in April 2018. But hidden in this index are indices of industries that grew by over 15% or shrunk by 9% during the same period. It’s these sub-indices that show the true pulse of industry — especially if you are looking at industrial production to spot investment or job opportunities.
- Not just IIP, all indices that capture large sets of data hide important extremes
- For instance, the consumer price index rose just 3.1% in May 2019. Hidden in this average was an 8.1% increase in prices of meat and fish and 5.2% fall in prices of fruits
- To know how much inflation is impacting your family budget, you need to look at these individual price indices and not just the overall price index
Figures are average of annual growth in index of industrial production and its key components for 12 months between May 2018 and April 2019
Investment, job creation
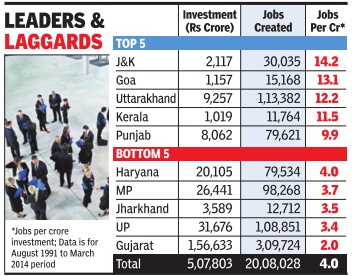
1991-2014: Proposals, actual investment and job creation
Investment proposals don't meet promises
Atul thakur The Times of India Mar 06 2015
In 23 Years, Rs 5.1L Cr Came, 20.1L Jobs Created Against Proposed Rs 102L Cr, 2.3Cr Employment
Investment proposals by corporates are generally associated with improving business sentiment and often linked with the possibility of job creation. The comparison of proposed investment with actual implementation and job creation in the past 23 years, however, shows that the actual delivery has fallen well short of the promise. Data from the department of industrial policy and promotion shows that between August 1991 and March 2014, the government received about 94,000 investment proposals. These proposals include Industrial Investment Intentions through Entre preneurs Memorandum -IEMs (delicensed sector) and Direct Industrial Licences (licensable sector).
Put together, these proposed the investment of more than Rs 102 lakh crore and were supposed to create 2.3 crore jobs.
The data on actual implementation of these proposals shows that only Rs 5.1 lakh crore was actually invested and just 20.1 lakh jobs created. That's less than 5% of the proposed investments and 8.9% of the promised jobs.
A state-wise analysis of proposals shows that between August 1991 and March 2014 corporates proposed to invest Rs 15.4 lakh crore in Orissa -the highest in the country. It was folllowed by Gujarat and Chhattisgarh receiving over Rs 10 lakh crore of proposed investments and Maharashtra just a tad below that mark. Overall, there were 15 states, which were vestments in these 23 years.When one analyses actual investments, Haryana has been the most successful among these 15 states in converting proposals to reality as 18.9% of the proposed money actually reached the state. It is followed by Gujarat (12.6%) and Uttar Pradesh (11.4%). The states that fared the worst in this conversion are Bihar, Jharkhand, Chhattisgarh and Orissa, where less than 1% of the proposed money actually arrived.
So, what is the investment to job creation ratio? Overall, the Rs 5 lakh crore actually invested created a little over 20 lakh jobs, which amounts to four jobs per crore of inve stment. There were 25 states which witnessed the actual investment of more Rs 1,000 crore. Among these states, Jammu and Kashmir witnessed the most labour intensive investments, while Gujarat had the most capital intensive ones.
Every crore of rupee invested in Jammu and Kashmir created about 12 jobs, while in Gujarat a crore of investment yielded only two jobs. In the investment to job creation ratio, Jammu and Kashmir is followed by Goa, Uttarakhand, Kerala and Punjab, where ten or more jobs were created per crore of investment. The worst stateUTs in this list are Madhya Pradesh, Jharkhand, Daman & Diu, UP and Gujarat.
Manufacturing base
1950-2011

From: June 11, 2019: The Times of India
See graphic:
Manufacturing as % of GDP, 1950-2011
2018: 30th on global manufacturing index
India 30th on WEF global mfg index, January 15, 2018: The Times of India
New Delhi/Geneva: The World Economic Forum (WEF) has ranked India at the 30th position on a global manufacturing index — below China’s 5th place but above other BRICS peers, Brazil, Russia and South Africa.
Japan has been found to have the best structure of production in the Geneva-based WEF’s first ‘Readiness for the future of production report’ and is followed by South Korea, Germany, Switzerland, China, Czech Republic, the US, Sweden, Austria and Ireland in the top 10.
Among BRICS nations, Russia is ranked 35th, Brazil 41st and South Africa at 45th place.
The report, which analyses development of modern industrial strategies and urges collaborative action, has categorised 100 countries into four groups — leading (strong current base, high level of readiness for future), high potential, legacy (strong current base, at risk for future), or nascent (limited current base, low level of readiness for future).
India has been placed in the ‘legacy’ group along with Hungary, Mexico, Philippines, Russia, Thailand and Turkey, among others. China figures among ‘leading countries’, while Brazil and South Africa are in ‘nascent’ ones.
The 25 ‘leading’ countries are in the best position to gain as production systems stand on the brink of exponential change, the WEF said in the report published ahead of its annual meeting in Davos, Switzerland later this month.
At the same time, no country has reached the frontier of readiness, let alone harnessed the full potential of the fourth industrial revolution in production.
About India, the fifth-largest manufacturer in the world with a total manufacturing value added of over $420 billion in 2016, the WEF said the country’s manufacturing sector has grown by over 7% per year-on-average in the past three decades and accounts for 16-20% of India’s GDP.
Micro- and small enterprises (MSEs)
2015-18: credit falls from 5.9% to 4.5%
Mayur Shetty, In 3 yrs, credit to MSEs falls from 5.9% to 4.5%, December 3, 2018: The Times of India

From: Mayur Shetty, In 3 yrs, credit to MSEs falls from 5.9% to 4.5%, December 3, 2018: The Times of India
The share of bank credit to micro and small enterprises (MSEs) has been shrinking since three years — from 5.9% in October 2015 to 4.5% in October 2018, data from the RBI show.
While it is clear the sector is facing problems due to the double whammy of demonetisation and GST, it’s unclear whether MSEs are hit by liquidity issues or whether banks do not find them credit-worthy.
In the first seven months of the current fiscal (up to October 26), outstanding loans to MSEs have come down by Rs 8,800 crore to Rs 3.64 lakh crore.
The reason why this decline has not been reflected in the credit to industry numbers is because banks have lent an additional Rs 5,100 crore to large businesses, which owe Rs 22.27 lakh crore — a big chunk of the Rs 26.96 lakh crore credit to the industry. Besides, businesses have raised an extra Rs 59,000 crore from banks by issuing bonds and commercial papers, with banks growing their corporate bond portfolios by 8% to Rs 7.27 lakh crore.
It’s easier for banks to give home loans
Despite overall industry growth being flat, bank credit has been showing a healthy rise because of a big jump in lending to two sectors —NBFCs. Of the Rs 3.14 lakh crore loans that banks have added to their books in the first seven months of FY19, almost half (47%) has been to these two sectors.
Troubled by bad loans, banks have found it easier to give home loans that have low margins and low defaults. According to the the RBI data, in FY19 banks have grown their home loan books by Rs 3.27 lakh crore from March 30, 2018, to Rs 10.62 lakh crore — a 9% increase. Home loans account for 26% (Rs 87,800 crore) of all incremental lending this year up to October.
Outstanding bank loans to NBFCs grew Rs 66,200 crore (13%) from their March-30 level to Rs 5.62 lakh crore by end-October. They are now 7% of all bank credit.
Micro, small and medium enterprises (MSMEs)
2022
See graphic:
Micro, small and medium enterprises (MSMEs): the best and worst states of India, employment generated and investment made: PRESUMABLY AS IN 2022
