Gross domestic product (GDP): India
This is a collection of articles archived for the excellence of their content.
|
Contents |
GDP, other economic indicators
What are GDP/ PPP? How is GDP calculated?
Decoding GDP & other economic indicators, Jun 05 2017: The Times of India
What is GDP?
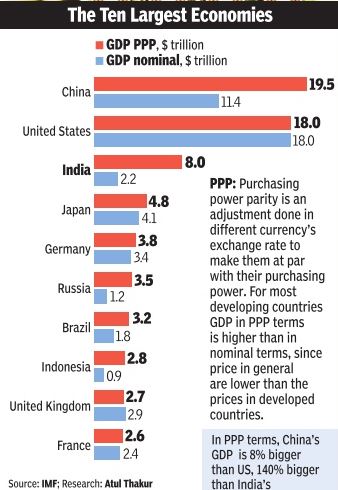
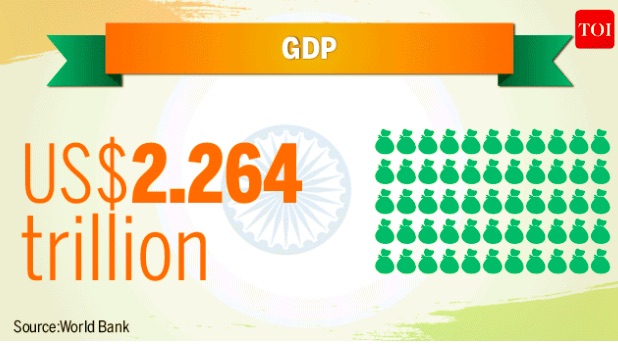
Gross domestic product or simply GDP is the market value of all goods and services produced in an economy in a specific period of time a quarter, a year and so on. In most countries a major share of economic production is done for selfconsumption and hence the GDP gives a rough idea about the general standard of living. It is among the most talked about economic indicators. When expressed in the current exchange value of US dollars, India is the world's seventh largest economy .
Why is GDP sometimes expressed in purchasing power parity (PPP) dollars?
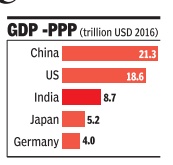
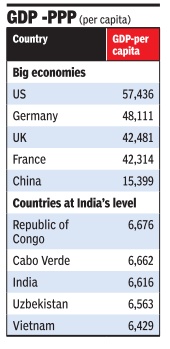
It is the standard practice to convert GDPs to US dollars for international comparisons. Economists, however, point out that currencies of developing countries have a higher purchasing power in their domestic markets than their international exchange rates would suggest. Hence converting into dollars at the prevailing exchange rate tends to understate the actual size of these economies. To overcome this, purchasing power parity (PPP) rates are devised by comparing the prices of a similar basket of goods and services in different countries. Expressed in PPP dollars, the Indian economy is the world's third largest. Does this mean that India is the world's third richest country? Not at all. A better yardstick for measuring the quality of life in different countries even in purely economic terms is their GDP per capita, which is the GDP divided by the population. In PPP terms, a little over 323 million Americans produced goods and services worth $18.6 trillion in 2016. This was much higher than $8.7 trillion the value of goods and services produced by 1.3 billion Indians.Naturally, India's per capita GDP, a rough indicator of the average annual incomes of Indians, is much below US levels and indeed towards the lower end of international comparison lists.
Wouldn't inflation also distort GDP as it is calculated at market value?
Governments across the world have devised various indices to track the movement of prices. For instance, the consumer price index (CPI) measures retail price inflation, the wholesale price index (WPI) is used to calculate the increase in wholesale prices, the producer price index (PPI) tracks inflation at the production stage and so on.The GDP deflator is a more generalised measure of inflation across the economy than any of these specific indices and is used to calculate `real' GDP growth (at constant prices) over a particular base period the year whose prices are used to adjust GDP to inflation.
[In 2017], the base year on the basis of which India's growth was calculated was 2011-12.
Is India among the world's fastest growing economies?
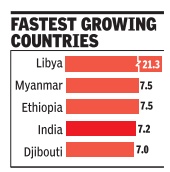
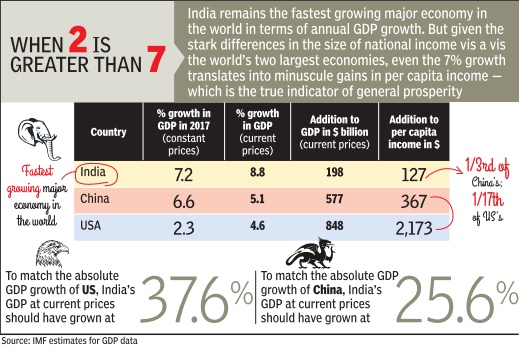
According to the International Monetary Fund's estimates for GDP growth at constant prices, India should grow at the rate of 7.2% in 2017. This is the world's fourth highest rate. The growth rate alone, however, is a misleading indicator as even a small change in the economies of countries with a low GDP base will inflate the percentage figure. For instance, the same estimates show that war-torn Libya is likely to grow at 53.7% in 2017, the highest in the world.
But isn't India a fast growing big economy?
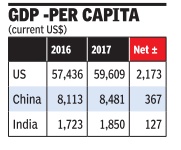
According to the IMF, compared to India's 7.2% growth China will grow at 6.6% while the US will grow at 2.3%. If one looks at growth at current prices (not adjusted to inflation) to see how much we will add in absolute terms, India will grow at 8.8% while China and the US will grow at 5.1 and 4.6% respectively.At absolute level, India will add 198 billion dollars to its economy (current prices) in 2017-18 over 2016-17. In the same period, the US and China's net addition to their GDP was 4.3 and 2.9 times that of India's respectively. India's population is increasing at a higher rate than either of these countries and it is adding far less to its economy in absolute terms when compared to US and China. This is reflected in the net addition in per capita income at current prices. Despite the high growth rate, the absolute increase in the income of an average Indian will remain much lower than for an average Chinese and American.NoteSource: IMF , The projec tions are for 2017-18. Data refer to calendar years, except in the case of a few countries including India that use fis cal years (April-March)
2018: base year changed to 2017-18
February 16, 2018: The Times of India
The government will change the base year to 2017-18 for the calculation of gross domestic product (GDP) and index of industrial production (IIP) numbers, and to 2018 for retail inflation, Union minister D V Sadananda Gowda said on Thursday.
“During 2018-19, the ministry is proposing to initiate steps to revise the base years of GDP, IIP and consumer price index (CPI) to accommodate the changes that take place in the economic scenario of the country,” the statistics and programme implementation minister said at a conference on Budget provisions.
Gowda said the ministry will undertake various steps in the next fiscal that will improve the statistical system and thus help meet data requirements in the emerging socio-economic scenario.
Historical GDP
From the 1st century AD to AD 2000
LONGSTANDING GIANTS
The Times of India Dec 05 2014
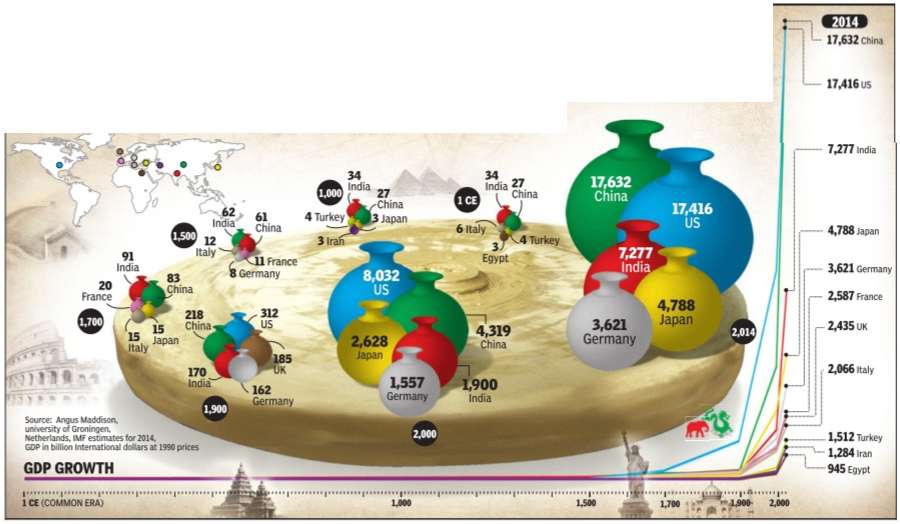
Which will be the world's largest economies in the future? Various studies suggest that it would be either China or India. But what about the largest economies in the past--1CE (Common Era), 1000CE, 1500CE and so on? Interestingly, even these periods were dominated by the Asian giants.For more than 1,700 years, India and China were the world's largest economies. Their dominance ended after the industrial revolution and the subsequent imperialist expansion of European nations which drained the world's wealth to the West. That's what data on historical GDP calculated by the late Angus Maddison, British economist and scholar on quantitative macroeconomic history, shows
GDP rank
7th in Oct 2016, 5th in Dec 2016
2016: India has managed to overtake UK's GDP first time in nearly 150 years.
The shift has been driven by India's rapid economic growth over the past 25 years, the Forbes report said.
The report also gave credit to fall in the value of the pound for India's significant rise in GDP.
With a growth forecast of 7.6 per cent by IMF, India would add $174 billion to its GDP next year, taking its economy size to $2.46 trillion.
On October 8, 2016, International Monetary Fund (IMF) had predicted India to surpass Europeans by the end of the fiscal.
"India is the seventh largest economy worth $2.29 trillion - just $50 billion less than the current UK's GDP, which will be bridged by end of this fiscal," IMF had said.
NEW DELHI: Owing to Britain's recent Brexit-related problems and thanks to India's rapid economic growth, India has managed to overtake its erstwhile colonial master United Kingdom in terms of the size of the economy - the first time after nearly 150 years.
This dramatic shift has been driven by India's rapid economic growth over the past 25 years as well downslide in the value of the pound over the last 12 months, a report published in Forbes magazine said.
"Once expected to overtake the UK GDP in 2020, the surpasso has been accelerated by the nearly 20 per cent decline in the value of the pound over the last 12 months, consequently UK's 2016 GDP of GBP 1.87 trillion converts to $2.29 trillion at exchange rate of GBP 0.81 per $1, whereas India's GDP of INR 153 trillion converts to $2.30 trillion at exchange rate of INR 66.6 per $1," the report said.
Interestingly, economic think-tank Centre for Economics and Business Research (CEBR) had, in December 2011, forecasted that India would become the "fifth largest by 2020" but India has crossed this significant milestone much sooner.
"Furthermore, this gap is expected to widen as India grows at 6 to 8 per cent p.a. compared to UK's growth of 1 to 2 per cent p.a. until 2020, and likely beyond. Even if the currencies fluctuate that modify these figures to rough equality, the verdict is clear that India's economy has surpassed that of the UK based on future growth prospects," the report said.
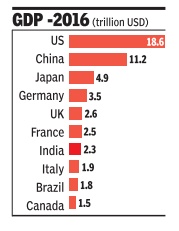
India overtook UK & became 5th largest GDP after USA, China, Japan & Germany."
GDP, year-wise
2015> 2016> 2017
GDP growth unchanged at 7.1% for FY17, February 1, 2018: The Times of India
The Central Statistics Office (CSO) revised the Gross Domestic Product (GDP) growth rate for 2015-16 to 8.2% from the earlier estimates of 8% and kept the 2016-17 growth unchanged at 7.1%. The real GDP or GDP at constant (2011-12) prices for the years 2016-17 and 2015-16 stands at Rs 121.9 lakh crore and Rs 113.9 lakh crore respectively, showing growth of 7.1% during 2016-17 and 8.2% during 2015-16, the CSO said in a statement.
2016-17
7% growth in Oct-Dec despite currency controls
See also:
Demonetisation of high value currency- 1946, 1978: India
Demonetisation of high value currency- 2016: India
GDP grows at 7% in Oct-Dec despite note ban squeeze, March 1, 2017: The Times of India
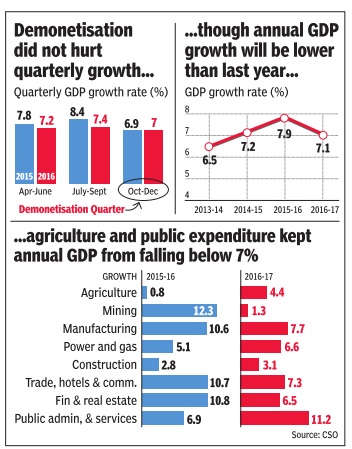
The Indian economy is expected to expand at 7.1% this financial year after factoring in the impact of demonetisation, the Central Statistics Office (CSO) said. Although this is slower than the 7.9% growth registered in 2015-16, it gives the Narendra Modi government the firepower to defend its decision to scrap old Rs 500 and Rs 1,000 notes, which, according to critics, has been disastrous for the economy.
During October-December, CSO's advance estimates showed GDP grew 7%, compared to 7.4% in previous quarter. Opposition parties had said that demonetisation led to massive job losses as companies cut down on production and overall economic activity was disrupted post November 8, even as the government maintained the impact was temporary .While the RBI and the International Monetary Fund have cut growth estimates for the financial year by up to one percentage point, some agencies had predicted sub-6% rise in the December quarter. Those such as Ambit Capital went to the ex tent of projecting less than 4% growth during the year.
Most companies reported a drop in demand during the December-quarter, but official estimates suggest that there was no impact as private final con sumption expenditure as a proportion of GDP remained flat.
The data did result in some elation in the government.“The third quarter GDP numbers are out and, as you have seen, the numbers completely negate the kind of negative projections and speculations made about the impact of demonetisation,“ economic affairs secretary Shaktikanta Das told reporters. Economists, however, pointed out that a revision in the rates for October-December 2015 may have helped improve the performance. “The steep downward revision of Q3 FY16 (October-December 2015) has in turn led to higher growth in Q3 FY17 October-December 2016), thus masking the impact of demonetisation in Q3 figures,“ SBI group chief economic adviser Soumya Kanti Ghosh said in a note.“Overall, the GDP numbers seem to suggest we may have just leapfrogged the impact of demonetisation,“ he added.
Core growth slow to 3.4% in Jan
New Delhi: The growth of eight core sectors slowed down to a five-month low of 3.4% in January, mainly due to contraction in output of refinery products, fertiliser and cement.The growth rate of eight infrastructure sectors of coal, crude oil, natural gas, refinery products, fertilisers, steel, cement and electricity was 5.7% in January 2016. AGENCIES
2017
See graphic:GDP, as in August 2017
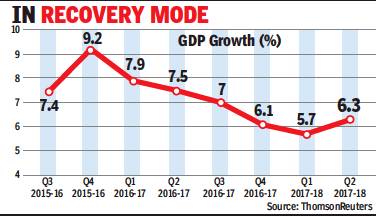
July-Sep 2017: economy grew at 6.3%
December 1, 2017: The Times of India
From: December 1, 2017: The Times of India
India’s growth staged a recovery in the September quarter as the economy emerged from the shadows of the impact of demonetisation and rollout issues linked to GST, prompting the government to say that it was poised for a durable recovery in the months ahead.
Data released by the Central Statistics Office showed that the economy grew 6.3% in July-September, the second quarter of the current fiscal. It grew faster than the June quarter’s 5.7%, with the expansion being led by robust manufacturing. Growth had slowed to a three-year low in Q1as the impact of demonetisation and GST implementation issues hurt expansion.
Impact of poor monsoons on GDP growth
`Poor rains unlikely to impact GDP growth much'
Prabhakar Sinha New Delhi:
TNN [The Times of India Jun 19 2014
Even as country braces for likely deficient monsoon, its impact on GDP may not be very significant.
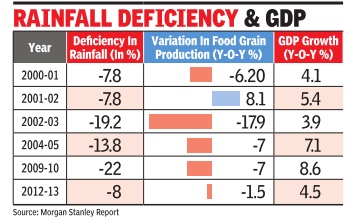
The decline in farm output as a result of shortfall in rains is unlikely to reduce GDP growth rate in 2014 by more than 0.5 percentage points, says global research firm Morgan Stanley in its latest report
The production of pulses and oil seeds, the report points out, may be worst affected, leading to rise in prices of these items and to bridge the demand-supply gap, the country will have to depend on imports.
Trends in monsoon rainfall will be critical for the overall inflation outlook. While food inflation has softened over the last few months, a poor monsoon may reverse the trend. Monsoon rains have an important bearing on inflation with primary and manufactured articles contributing 24.3% weight in overall wholesale price index and 47.6% in the new Consumer price Index. While the countrywide shortfall in rains is expected to be around 7%, the spatial (region-wise) distribution forecast shows that monsoon deficiency in North-West India may be 8% with a 71% probability . But being the most irrigated region in the country , it currently boasts of full reservoirs. So, according to the report, the region that comprises of Punjab, Haryana and Western UP and produces most of the Kharif crops should see a near-normal production.
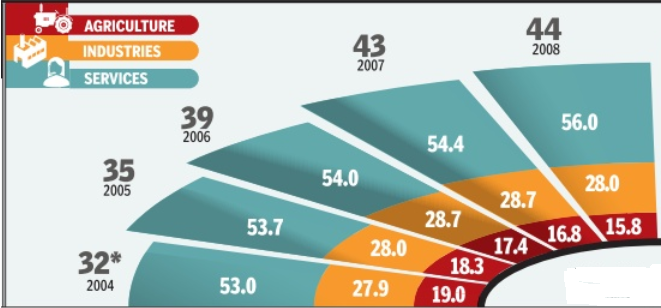
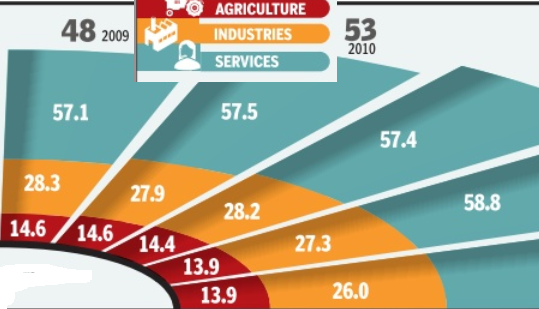
If El Nino fears were to come true, the report says, there will be downside risks to Morgan Stanley's estimate of agricultural growth at 2.4% in 2014-15. With agriculture accounting for only 15% of GDP, one percentage point reduction in agricultural growth rate will lead to 15 basis points (100 basis points make one percentage point) decline in GDP growth.
Therefore, even if there is no growth in the agricultural sector, the direct impact on GDP growth will not be of more than 0.5 percentage point, predicts report.
GDP, India and the world
See graphic.
See also
Gross domestic product (GDP): India
