Gross domestic product (GDP): India
This is a collection of articles archived for the excellence of their content.
|
Developmental indicators
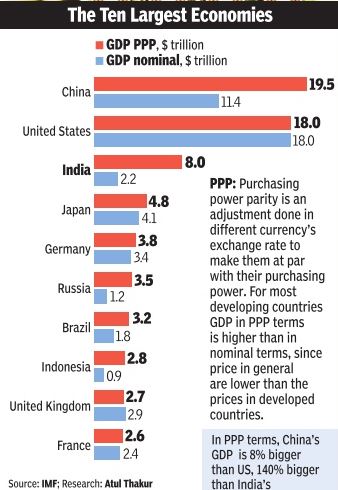
See graphic, The 10 largest economies, including India, in PPP terms (presumably 2014-15)
GDP, other economic indicators
What are GDP/ PPP? How is GDP calculated?
Decoding GDP & other economic indicators, Jun 05 2017: The Times of India
What is GDP?
Gross domestic product or simply GDP is the market value of all goods and services produced in an economy in a specific period of time a quarter, a year and so on. In most countries a major share of economic production is done for selfconsumption and hence the GDP gives a rough idea about the general standard of living. It is among the most talked about economic indicators. When expressed in the current exchange value of US dollars, India is the world's seventh largest economy .
Why is GDP sometimes expressed in purchasing power parity (PPP) dollars?
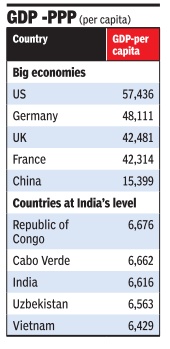
It is the standard practice to convert GDPs to US dollars for international comparisons. Economists, however, point out that currencies of developing countries have a higher purchasing power in their domestic markets than their international exchange rates would suggest. Hence converting into dollars at the prevailing exchange rate tends to understate the actual size of these economies. To overcome this, purchasing power parity (PPP) rates are devised by comparing the prices of a similar basket of goods and services in different countries. Expressed in PPP dollars, the Indian economy is the world's third largest. Does this mean that India is the world's third richest country? Not at all. A better yardstick for measuring the quality of life in different countries even in purely economic terms is their GDP per capita, which is the GDP divided by the population. In PPP terms, a little over 323 million Americans produced goods and services worth $18.6 trillion in 2016. This was much higher than $8.7 trillion the value of goods and services produced by 1.3 billion Indians.Naturally, India's per capita GDP, a rough indicator of the average annual incomes of Indians, is much below US levels and indeed towards the lower end of international comparison lists.
Wouldn't inflation also distort GDP as it is calculated at market value?
Governments across the world have devised various indices to track the movement of prices. For instance, the consumer price index (CPI) measures retail price inflation, the wholesale price index (WPI) is used to calculate the increase in wholesale prices, the producer price index (PPI) tracks inflation at the production stage and so on.The GDP deflator is a more generalised measure of inflation across the economy than any of these specific indices and is used to calculate `real' GDP growth (at constant prices) over a particular base period the year whose prices are used to adjust GDP to inflation.
[In 2017], the base year on the basis of which India's growth was calculated was 2011-12.
Is India among the world's fastest growing economies?
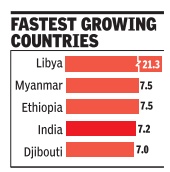
According to the International Monetary Fund's estimates for GDP growth at constant prices, India should grow at the rate of 7.2% in 2017. This is the world's fourth highest rate. The growth rate alone, however, is a misleading indicator as even a small change in the economies of countries with a low GDP base will inflate the percentage figure. For instance, the same estimates show that war-torn Libya is likely to grow at 53.7% in 2017, the highest in the world.
But isn't India a fast growing big economy?
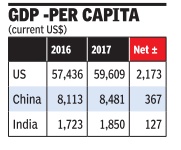
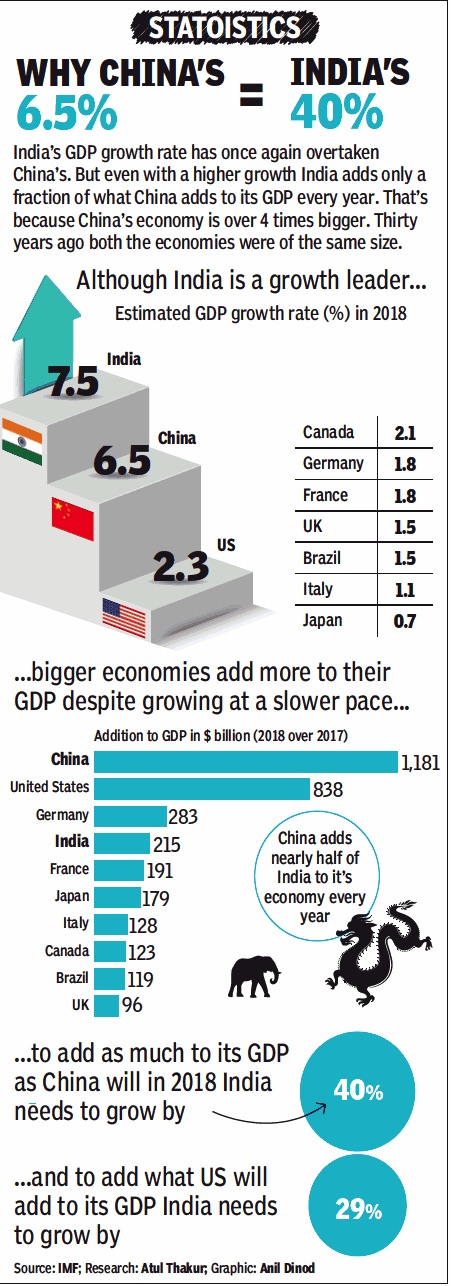
According to the IMF, compared to India's 7.2% growth China will grow at 6.6% while the US will grow at 2.3%. If one looks at growth at current prices (not adjusted to inflation) to see how much we will add in absolute terms, India will grow at 8.8% while China and the US will grow at 5.1 and 4.6% respectively.At absolute level, India will add 198 billion dollars to its economy (current prices) in 2017-18 over 2016-17. In the same period, the US and China's net addition to their GDP was 4.3 and 2.9 times that of India's respectively. India's population is increasing at a higher rate than either of these countries and it is adding far less to its economy in absolute terms when compared to US and China. This is reflected in the net addition in per capita income at current prices. Despite the high growth rate, the absolute increase in the income of an average Indian will remain much lower than for an average Chinese and American.NoteSource: IMF , The projec tions are for 2017-18. Data refer to calendar years, except in the case of a few countries including India that use fis cal years (April-March)
GDP explained further
March 5, 2018: The Times of India
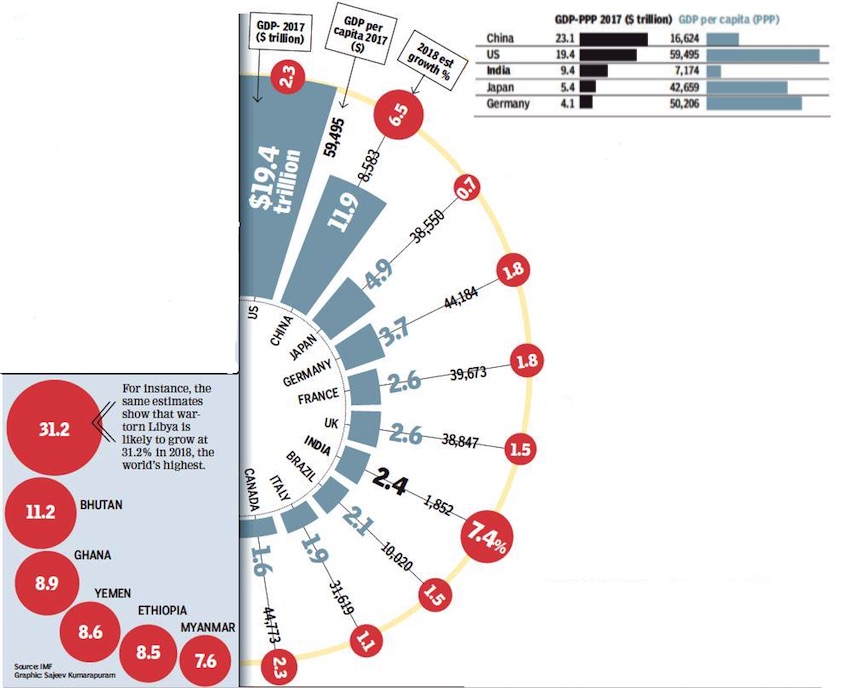
India’s GDP in PPP terms in 2017;
The growth rates of Bhutan, Myanmar and other countries growing faster than India in 2018;
From: March 5, 2018: The Times of India
In 2018: Is India among the world’s fastest growing economies?
IMF estimates for GDP growth at constant prices show India should grow at 7.4% in 2018. This is the world’s seventh highest rate. The growth rate alone, however, is a misleading indicator as even a small absolute change in the economies of countries with a low GDP base will inflate the percentage figure.
How much do large economies add in absolute terms?
Despite growing at a slower rate as compared to India, China, the US and Germany will add far more to their economy. China is expected to add $1,181 billion to its economy at current prices — 5.5 times India’s addition. The US is estimated to have added $838bn, and Germany $283bn, compared to India’s $215bn in 2017-18.
But isn’t over 7% growth rate a significant achievement?
Any improvement in the growth rate is good. But a better yardstick to measure quality of life in various countries even in purely economic terms is GDP per capita, or GDP divided by the population. By this yardstick India stands nowhere compared to other large economies. US’s per capita GDP (larger economy, lower population) is more than 32 times India’s. China has a larger population but its per capita GDP is five times India’s. To significantly increase its GDP at per capita level India will have to maintain double-digit growth for many years and hence 7% is a modest achievement.
2018: base year changed to 2017-18
February 16, 2018: The Times of India
The government will change the base year to 2017-18 for the calculation of gross domestic product (GDP) and index of industrial production (IIP) numbers, and to 2018 for retail inflation, Union minister D V Sadananda Gowda said.
“During 2018-19, the ministry is proposing to initiate steps to revise the base years of GDP, IIP and consumer price index (CPI) to accommodate the changes that take place in the economic scenario of the country,” the statistics and programme implementation minister said at a conference on Budget provisions.
Gowda said the ministry will undertake various steps in the next fiscal that will improve the statistical system and thus help meet data requirements in the emerging socio-economic scenario.
Historical GDP
From the 1st century AD to AD 2000
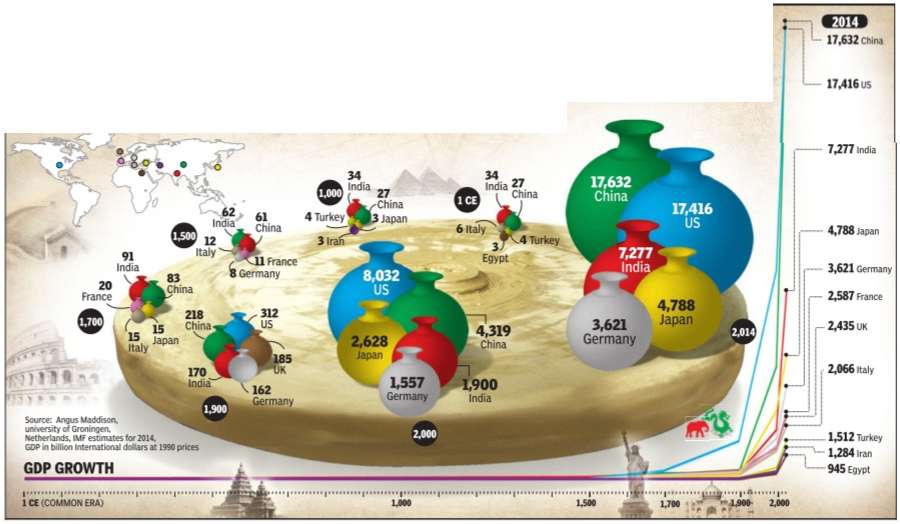
LONGSTANDING GIANTS
The Times of India Dec 05 2014
Which will be the world's largest economies in the future? Various studies suggest that it would be either China or India. But what about the largest economies in the past--1CE (Common Era), 1000CE, 1500CE and so on? Interestingly, even these periods were dominated by the Asian giants.For more than 1,700 years, India and China were the world's largest economies. Their dominance ended after the industrial revolution and the subsequent imperialist expansion of European nations which drained the world's wealth to the West. That's what data on historical GDP calculated by the late Angus Maddison, British economist and scholar on quantitative macroeconomic history, shows
1950- 2015: GDP from Agriculture, Allied Sectors
Gross Domestic Product from Agriculture & Allied Sectors and % Share to GDP 1950-51 to 14-15 at Constant Price & at 2004-05 prices
Gross Capital Formation in Agriculture & Allied Sector (at Current Prices)
|
Year |
GCF in Agriculture & Allied Sector at Current Prices |
GCF of Economy (by industry of use) at cu. Prices |
Share of Agriculture & Allied Sector in Total GCF(%) | ||||||
|
Public Sector |
Private Sector |
Total |
Public Sector |
Private Sector |
Total |
Public Sector |
Private Sector |
Total | |
|
(1) |
(2) |
(3) |
(4) |
(5) |
(6) |
(7) |
(8) |
(9) |
(10) |
|
1993-94 |
4,874 |
13,834 |
18,708 |
79,309 |
1,12,147 |
1,91,456 |
6.15 |
12.34 |
9.77 |
|
1994-95 |
5,952 |
13,633 |
19,585 |
1,02,134 |
1,26,308 |
2,28,442 |
5.83 |
10.79 |
8.57 |
|
1995-96 |
6,678 |
14,900 |
21,578 |
1,05,704 |
1,89,342 |
2,95,046 |
6.32 |
7.87 |
7.31 |
|
1996-97 |
7,214 |
18,930 |
26,145 |
1,08,750 |
2,19,296 |
3,28,046 |
6.63 |
8.63 |
7.97 |
|
1997-98 |
6,779 |
23,694 |
30,473 |
1,12,814 |
2,59,587 |
3,72,401 |
6.01 |
9.13 |
8.18 |
|
1998-99 |
7,476 |
28,570 |
36,046 |
1,28,621 |
2,98,448 |
4,27,069 |
5.81 |
9.57 |
8.44 |
|
1999-2K |
8,668 |
48,124 |
56,793 |
1,38,611 |
3,46,055 |
4,84,666 |
6.25 |
13.91 |
11.72 |
|
2000-01 |
8,176 |
44,750 |
52,926 |
1,45,973 |
3,49,223 |
4,95,196 |
5.60 |
12.81 |
10.69 |
|
2001-02 |
10,354 |
61,342 |
71,696 |
1,60,190 |
4,30,050 |
5,90,240 |
6.46 |
14.26 |
12.15 |
|
2002-03 |
9,565 |
57,957 |
67,522 |
1,68,143 |
4,32,977 |
6,01,120 |
5.69 |
13.39 |
11.23 |
|
2003-04 |
12,219 |
54,472 |
66,691 |
1,90,806 |
5,06,672 |
6,97,478 |
6.40 |
10.75 |
9.56 |
|
2004-05 |
16,182 |
59,909 |
76,096 |
2,24,108 |
7,06,920 |
9,31,028 |
7.22 |
8.47 |
8.17 |
|
2005-06 |
20,739 |
69,203 |
89,943 |
2,71,342 |
8,48,950 |
11,20,292 |
7.64 |
8.15 |
8.03 |
|
2006-07 |
25,606 |
75,496 |
1,01,102 |
3,39,617 |
10,04,157 |
13,43,774 |
7.54 |
7.52 |
7.52 |
|
2007-08 |
27,638 |
95,679 |
1,23,317 |
4,01,326 |
12,40,347 |
16,41,673 |
6.89 |
7.71 |
7.51 |
|
2008-09 |
26,692 |
1,33,655 |
1,60,347 |
4,80,698 |
13,40,401 |
18,21,099 |
5.55 |
9.97 |
8.80 |
|
2009-10 |
33,237 |
1,51,289 |
1,84,526 |
5,43,883 |
15,11,889 |
20,55,772 |
6.11 |
10.01 |
8.98 |
|
2010-11 |
34,548 |
1,59,038 |
1,93,586 |
6,06,245 |
18,68,220 |
24,74,465 |
5.70 |
8.51 |
7.82 |
|
2011-12 |
2,34,269 |
6,62,698 |
20,86,374 |
27,49,072 |
8.52 | ||||
..
Gross Capital Formation in Agriculture & Allied Sector 1993-94 to 2012-13
|
Year |
GCF in Agriculture & Allied Sector at Const. Prices |
GCF of Economy (by industry of use) at 04-05 Const. Prices |
Share of Agriculture & Allied Sector in Total GCF (%) | ||||||
|
Public Sector |
Private Sector |
Total |
Public Sector |
Private Sector |
Total |
Public Sector |
Private Sector |
Total | |
|
(1) |
(2) |
(3) |
(4) |
(5) |
(6) |
(7) |
(8) |
(9) |
(10) |
|
1993-94 |
8,907 |
30,354 |
39,261 |
81,283 |
108,454 |
189,737 |
10.96 |
27.99 |
20.69 |
|
1994-95 |
9,706 |
26,797 |
36,503 |
101,530 |
140,984 |
242,514 |
9.56 |
19.01 |
15.05 |
|
1995-96 |
9,560 |
26,474 |
36,034 |
105,091 |
214,512 |
319,603 |
9.10 |
12.34 |
11.27 |
|
1996-97 |
9,225 |
29,756 |
38,980 |
110,633 |
202,423 |
313,055 |
8.34 |
14.70 |
12.45 |
|
1997-98 |
7,812 |
33,565 |
41,376 |
116,367 |
269,078 |
385,445 |
6.71 |
12.47 |
10.73 |
|
1998-99 |
7,949 |
38,941 |
46,890 |
130,898 |
293,148 |
424,046 |
6.07 |
13.28 |
11.06 |
|
1999-2K |
8,668 |
59,921 |
68,589 |
154,164 |
372,999 |
527,163 |
5.62 |
16.06 |
13.01 |
|
2000-01 |
8,085 |
54,024 |
62,109 |
155,299 |
355,054 |
510,354 |
5.21 |
15.22 |
12.17 |
|
2001-02 |
9,712 |
71,006 |
80,718 |
169,269 |
419,000 |
588,269 |
5.74 |
16.95 |
13.72 |
|
2002-03 |
8,734 |
64,780 |
73,514 |
163,403 |
455,917 |
619,320 |
5.35 |
14.21 |
11.87 |
|
2003-04 |
10,805 |
59,116 |
69,921 |
187,730 |
530,415 |
718,145 |
5.76 |
11.15 |
9.74 |
|
2004-05 |
16,187 |
59,909 |
76,096 |
240,580 |
770,598 |
1,011,178 |
6.73 |
7.77 |
7.53 |
|
2005-06 |
19,940 |
66,664 |
86,604 |
293,350 |
931,331 |
1,224,681 |
6.80 |
7.16 |
7.07 |
|
2006-07 |
22,987 |
69,070 |
92,057 |
356,556 |
1,134,319 |
1,490,875 |
6.45 |
6.09 |
6.17 |
|
2007-08 |
23,257 |
82,484 |
105,741 |
441,923 |
1,401,284 |
1,843,207 |
5.26 |
5.89 |
5.74 |
|
2008-09 |
20,572 |
106,555 |
127,127 |
531,730 |
1,396,160 |
1,927,890 |
3.87 |
7.63 |
6.59 |
|
2009-10 |
22,719 |
110,443 |
133,162 |
592,788 |
1,642,155 |
2,234,943 |
3.83 |
6.73 |
5.96 |
|
2010-11 |
21,500 |
109,723 |
131,223 |
653,959 |
2,065,618 |
2,719,577 |
3.29 |
5.31 |
4.83 |
|
2011-12 |
146,578 |
705,208 |
2,233,249 |
2,938,456 |
4.99 | ||||
..
Gross Domestic Product (GDP) from Agriculture and Allied Sector and its Percentage Share to Total GDP (1954-55 to 2014-15)
|
(Rupees crore) | |||||||||
|
Year |
GDP Total |
GDP Total (at Factor Cost) - in Rs. Cr. |
GDP Agriculture and Allied sector |
% Share of Agriculture and Allied sector to total GDP |
Growth Rate of GDP Agri. & Allied Sector | ||||
|
at current market Prices |
at current prices |
at constant 2004-05 prices |
at current prices |
at constant 2004-05 prices |
at current prices |
at constant 2004-05 prices |
at current prices |
at constant 2004-05 prices | |
|
1 |
2 |
3 |
4 |
5 |
6 |
7 |
8 |
9 | |
|
1954-55 |
11,170 |
10,689 |
325,431 |
4,902 |
168,361 |
45.86 |
51.73 |
-14.93 |
2.94 |
|
1955-56 |
11,371 |
10,861 |
333,766 |
4,753 |
166,906 |
43.77 |
50.01 |
-3.03 |
-0.86 |
|
1956-57 |
13,547 |
12,965 |
352,766 |
6,039 |
175,980 |
46.58 |
49.89 |
27.04 |
5.44 |
|
1957-58 |
13,951 |
13,255 |
348,500 |
5,914 |
168,075 |
44.61 |
48.23 |
-2.08 |
-4.49 |
|
1958-59 |
15,551 |
14,827 |
374,948 |
6,861 |
185,010 |
46.27 |
49.34 |
16.02 |
10.08 |
|
1959-60 |
16,384 |
15,574 |
383,153 |
6,893 |
183,147 |
44.26 |
47.80 |
0.46 |
-1.01 |
|
1960-61 |
17,942 |
17,049 |
410,279 |
7,256 |
195,482 |
42.56 |
47.65 |
5.28 |
6.74 |
|
1961-62 |
19,010 |
17,992 |
423,011 |
7,516 |
195,647 |
41.77 |
46.25 |
3.57 |
0.08 |
|
1962-63 |
20,429 |
19 238 |
431,960 |
7,674 |
191,755 |
39.89 |
44.39 |
2.10 |
-1.99 |
|
1963-64 |
23,462 |
21,986 |
453,829 |
9,031 |
196,241 |
41.08 |
43.24 |
17.69 |
2.34 |
|
1964-65 |
27,367 |
25,686 |
488,247 |
11,034 |
214,343 |
42.96 |
43.90 |
22.18 |
9.22 |
|
1965-66 |
28,857 |
26,895 |
470,402 |
11,004 |
190,675 |
40.91 |
40.53 |
-0.28 |
-11.04 |
|
1966-67 |
32,669 |
30,613 |
475,190 |
12,801 |
187,962 |
41.81 |
39.56 |
16.33 |
-1.42 |
|
1967-68 |
38,261 |
35,976 |
513,860 |
16,019 |
215,914 |
44.53 |
42.02 |
25.14 |
14.87 |
|
1968-69 |
40,512 |
37,938 |
527,270 |
16,512 |
215,572 |
43.52 |
40.88 |
3.08 |
-0.16 |
|
1969-70 |
44,605 |
41,722 |
561,630 |
18,059 |
229,428 |
43.29 |
40.85 |
9.37 |
6.43 |
|
1970-71 |
47,638 |
44,382 |
589,787 |
18,620 |
245,699 |
41.95 |
41.66 |
3.11 |
7.09 |
|
1971-72 |
50,999 |
47,221 |
595,741 |
19,021 |
241,087 |
40.28 |
40.47 |
2.15 |
-1.88 |
|
1972-73 |
56,214 |
51,943 |
593,843 |
20,921 |
228,988 |
40.28 |
38.56 |
9.99 |
-5.02 |
|
1973-74 |
68,420 |
63,658 |
620,872 |
27,570 |
245,479 |
43.31 |
39.54 |
31.78 |
7.20 |
|
1974-75 |
80,770 |
74,930 |
628,079 |
30,204 |
241,740 |
40.31 |
38.49 |
9.55 |
-1.52 |
|
1975-76 |
86,707 |
79,582 |
684,634 |
29,937 |
272,899 |
37.62 |
39.86 |
-0.88 |
12.89 |
|
1976-77 |
93,422 |
85,545 |
693,191 |
30,585 |
257,131 |
35.75 |
37.09 |
2.16 |
-5.78 |
|
1977-78 |
105,848 |
97,633 |
744,972 |
36,212 |
282,937 |
37.09 |
37.98 |
18.40 |
10.04 |
|
1978-79 |
114,647 |
104,930 |
785,965 |
37,217 |
289,452 |
35.47 |
36.83 |
2.77 |
2.30 |
|
1979-80 |
125,729 |
114,500 |
745,083 |
38,501 |
252,475 |
33.63 |
33.89 |
3.45 |
-12.77 |
|
1980-81 |
149,642 |
136,838 |
798,506 |
48,426 |
285,015 |
35.39 |
35.69 |
25.78 |
12.89 |
|
1981-82 |
175,805 |
160,213 |
843,426 |
54,583 |
298,130 |
34.07 |
35.35 |
12.71 |
4.60 |
|
1982-83 |
196,644 |
178,985 |
868,092 |
58,849 |
297,293 |
32.88 |
34.25 |
7.82 |
-0.28 |
|
1983-84 |
229,021 |
209,356 |
936,270 |
70,228 |
327,382 |
33.54 |
34.97 |
19.34 |
10.12 |
|
1984-85 |
256,611 |
235,113 |
973,357 |
75,731 |
332,571 |
32.21 |
34.17 |
7.84 |
1.59 |
|
1985-86 |
289,524 |
262,717 |
1,013,866 |
81,160 |
333,616 |
30.89 |
32.91 |
7.17 |
0.31 |
|
1986-87 |
323,949 |
292 924 |
1,057,612 |
87,111 |
332,250 |
29.74 |
31.42 |
7.33 |
-0.41 |
|
1987-88 |
368,211 |
332,068 |
1,094,993 |
96,905 |
326,975 |
29.18 |
29.86 |
11.24 |
-1.59 |
|
1988-89 |
436,893 |
396,295 |
1,206,243 |
119,678 |
378,113 |
30.20 |
31.35 |
23.50 |
15.64 |
|
1989-90 |
501,928 |
456,540 |
1,280,228 |
132,264 |
382,609 |
28.97 |
29.89 |
10.52 |
1.19 |
|
1990-91 |
586,212 |
531,813 |
1,347,889 |
154,350 |
397,971 |
29.02 |
29.53 |
16.70 |
4.02 |
|
1991-92 |
673,875 |
613,528 |
1,367,171 |
180,313 |
390,201 |
29.39 |
28.54 |
16.82 |
-1.95 |
|
1992-93 |
774,545 |
703,723 |
1,440,504 |
202,219 |
416,153 |
28.74 |
28.89 |
12.15 |
6.65 |
|
1993-94 |
891,355 |
817,961 |
1,522,344 |
234,566 |
429,981 |
28.68 |
28.24 |
16.00 |
3.32 |
|
1994-95 |
1,045,590 |
955,385 |
1,619,694 |
270,107 |
450,258 |
28.27 |
27.80 |
15.15 |
4.72 |
|
1995-96 |
1,226,725 |
1,118,586 |
1,737,741 |
293,701 |
447,127 |
26.26 |
25.73 |
8.74 |
-0.70 |
|
1996-97 |
1,419,277 |
1,301,788 |
1,876,319 |
353,142 |
491,484 |
27.13 |
26.19 |
20.24 |
9.92 |
|
1997-98 |
1,572,394 |
1,447,613 |
1,957,032 |
374,744 |
478,933 |
25.89 |
24.47 |
6.12 |
-2.55 |
|
1998-99 |
1,803,378 |
1,668,739 |
2,087,828 |
430,384 |
509,203 |
25.79 |
24.39 |
14.85 |
6.32 |
|
1999-00 |
2,012,198 |
1,847,273 |
2,246,276 |
455,302 |
522,795 |
24.65 |
23.27 |
5.79 |
2.67 |
|
2000-01 |
2,168,652 |
1,991,982 |
2,342,774 |
460,608 |
522,755 |
23.12 |
22.31 |
1.17 |
-0.01 |
|
2001-02 |
2,348,330 |
2,167,745 |
2,472,052 |
498,620 |
554,157 |
23.00 |
22.42 |
8.25 |
6.01 |
|
2002-03 |
2,530,663 |
2,338,200 |
2,570,690 |
485,080 |
517,559 |
20.75 |
20.13 |
-2.72 |
-6.60 |
|
2003-04 |
2,837,900 |
2,622,216 |
2,777,813 |
544,667 |
564,391 |
20.77 |
20.32 |
12.28 |
9.05 |
|
2004-05 |
3,242,209 |
2,971,464 |
2,971,464 |
565,426 |
565,426 |
19.03 |
19.03 |
3.81 |
0.18 |
|
2005-06 |
3,693,369 |
3,390,503 |
3,253,073 |
637,772 |
594,487 |
18.81 |
18.27 |
12.79 |
5.14 |
|
2006-07 |
4,294,706 |
3,953,276 |
3,564,364 |
722,984 |
619,190 |
18.29 |
17.37 |
13.36 |
4.16 |
|
2007-08 |
4,987,090 |
4,582,086 |
3,896,636 |
836,518 |
655,080 |
18.26 |
16.81 |
15.70 |
5.80 |
|
2008-09 |
5,630,063 |
5,303,567 |
4,158,676 |
943,204 |
655,689 |
17.78 |
15.77 |
12.75 |
0.09 |
|
2009-10 |
6,477,827 |
6,108,903 |
4,516,071 |
1,083,514 |
660,987 |
17.74 |
14.64 |
14.88 |
0.81 |
|
2010-11 |
7,795,313 |
7,248,860 |
4,918,533 |
1,319,686 |
717,814 |
18.21 |
14.59 |
21.80 |
8.60 |
|
2011-12 |
8,974,947 |
8,391,691 |
5,247,530 |
1,499,098 |
753,832 |
17.86 |
14.37 |
13.60 |
5.02 |
|
2012-13 |
10,028,118 |
9,388,876 |
5,482,111 |
1,644,926 |
764,510 |
17.52 |
13.95 |
9.73 |
1.42 |
|
2013-14 (RE) |
11,355,073 |
10,472,807 |
5,741,791 |
1,906,348 |
800,548 |
18.20 |
13.94 |
15.89 |
4.71 |
1970-2017: from world no.9, then no.13 to no.5
June 13, 2019: The Times of India
From: June 13, 2019: The Times of India
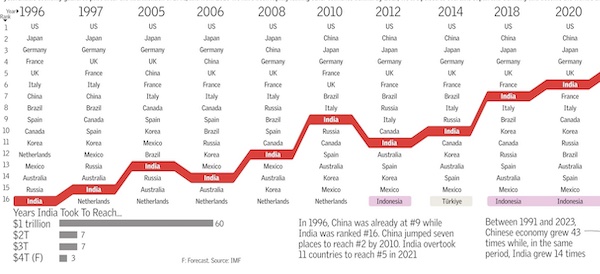
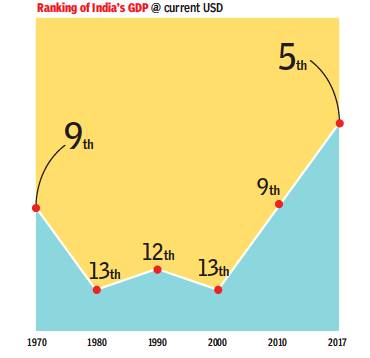
In 17 years, India’s economy rose from 13th position to world no. 5
In 1970, India was the 9th largest economy with a GDP of $62 billion. Only USA, Germany, Japan, France, UK, Italy, China and Canada were larger. By 2000, we slipped to 13th place as Mexico, Brazil, Spain and South Korea shot ahead. But in 2017 — the year for which latest data is available — India had become the 5th largest economy at current exchange rate, and the 3rd largest in terms of purchasing power parity
1996-2013, ’14: State-wise Growth Rate of Agriculture, Allied Sectors
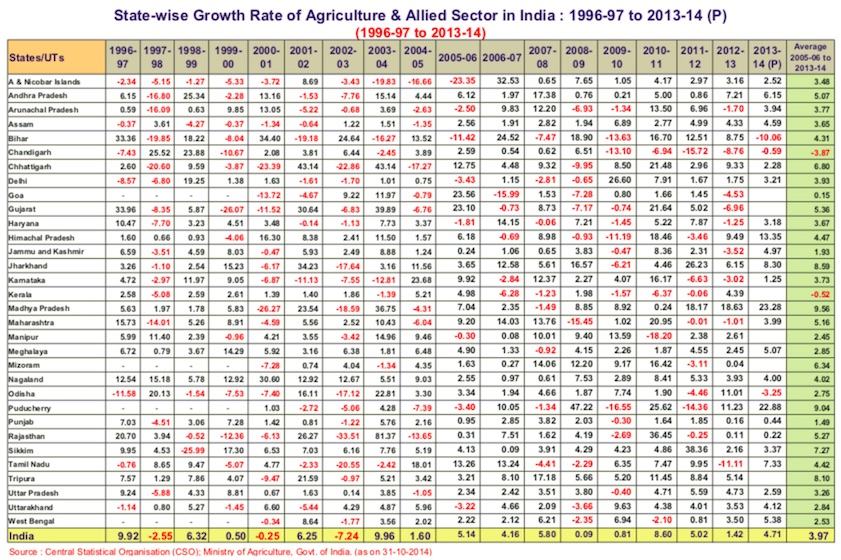
From: The Planning Commission
See graphic:
State-wise Growth Rate (Annual Average in %) of Agriculture & Allied Sector in India : 1996-97 to 2013-14
1994-2012: GDP growth
A new high: GDP grew 10.1% in 2006-07, The Times of India
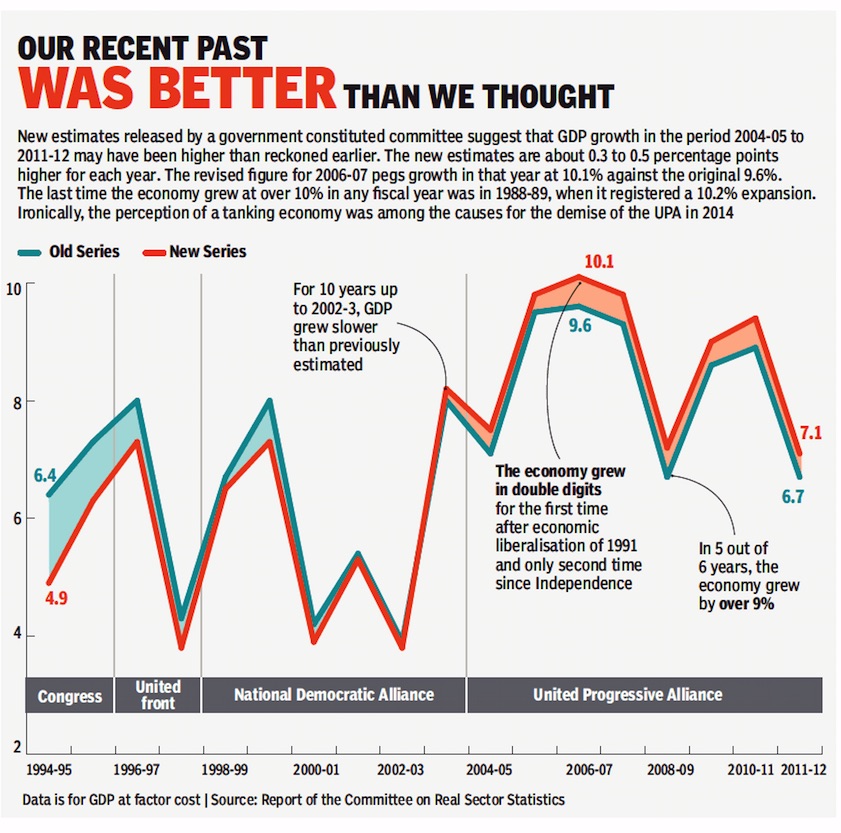
From: A new high: GDP grew 10.1% in 2006-07, The Times of India
A government-appointed panel has estimated that the economy grew at a double-digit rate (10.1%) in 2006-07, a first in the post-liberalisation era and the secondhighest ever. The new series uses 2011-12 as the base year for prices, as against 2004-05 in the old series. The panel headed by Sudipto Mundle concluded that the difference is minimal, addressing concerns often raised about the new methodology and base year.
1996-2020
See graphic:
GDP: India’s rank in the world, 1996-2020
Under various shades of government
1969-1996
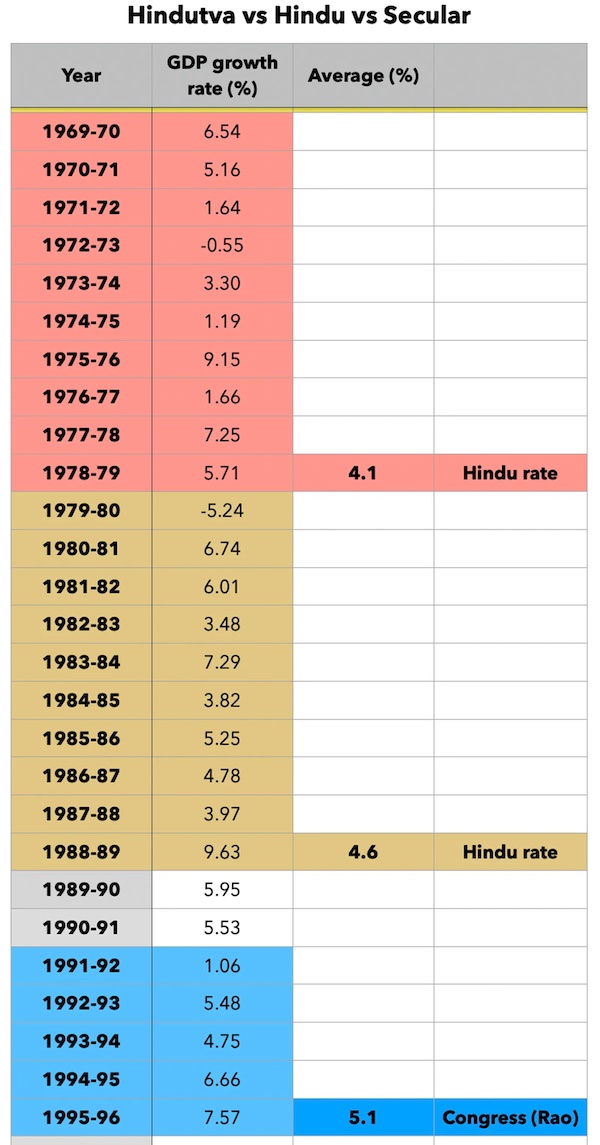
From: Udit Misra, Dec 15, 2023: The Indian Express
See graphic:
The rate of growth of India’s GDP, 1969 – 1996
1998-2023
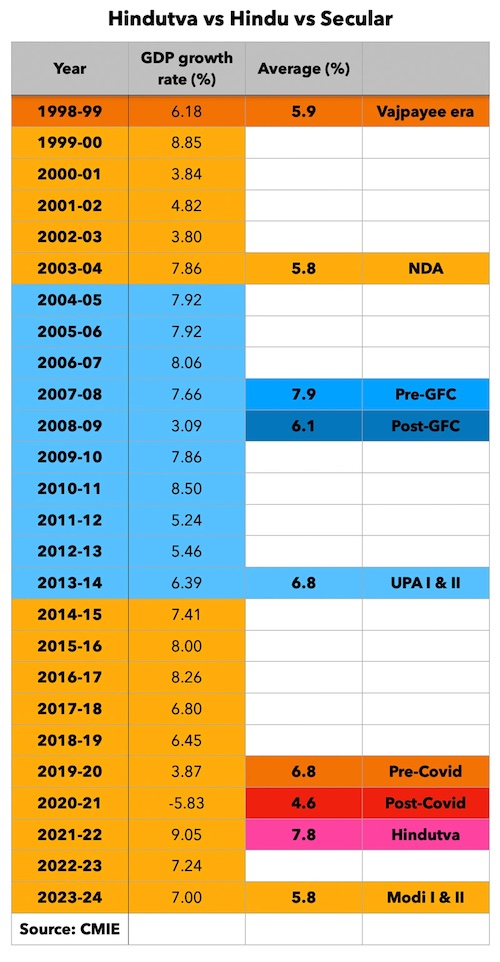
From: Udit Misra, Dec 15, 2023: The Indian Express
See graphic:
The rate of growth of India’s GDP, 1998-2023
GDP rank
7th in Oct 2016, 5th in Dec 2016
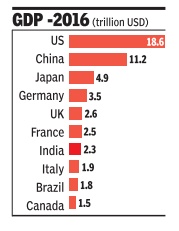
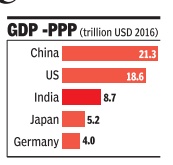
2016: India has managed to overtake UK's GDP first time in nearly 150 years.
The shift has been driven by India's rapid economic growth over the past 25 years, the Forbes report said.
The report also gave credit to fall in the value of the pound for India's significant rise in GDP.
With a growth forecast of 7.6 per cent by IMF, India would add $174 billion to its GDP next year, taking its economy size to $2.46 trillion.
On October 8, 2016, International Monetary Fund (IMF) had predicted India to surpass Europeans by the end of the fiscal.
"India is the seventh largest economy worth $2.29 trillion - just $50 billion less than the current UK's GDP, which will be bridged by end of this fiscal," IMF had said.
NEW DELHI: Owing to Britain's recent Brexit-related problems and thanks to India's rapid economic growth, India has managed to overtake its erstwhile colonial master United Kingdom in terms of the size of the economy - the first time after nearly 150 years.
This dramatic shift has been driven by India's rapid economic growth over the past 25 years as well downslide in the value of the pound over the last 12 months, a report published in Forbes magazine said.
"Once expected to overtake the UK GDP in 2020, the surpasso has been accelerated by the nearly 20 per cent decline in the value of the pound over the last 12 months, consequently UK's 2016 GDP of GBP 1.87 trillion converts to $2.29 trillion at exchange rate of GBP 0.81 per $1, whereas India's GDP of INR 153 trillion converts to $2.30 trillion at exchange rate of INR 66.6 per $1," the report said.
Interestingly, economic think-tank Centre for Economics and Business Research (CEBR) had, in December 2011, forecasted that India would become the "fifth largest by 2020" but India has crossed this significant milestone much sooner.
"Furthermore, this gap is expected to widen as India grows at 6 to 8 per cent p.a. compared to UK's growth of 1 to 2 per cent p.a. until 2020, and likely beyond. Even if the currencies fluctuate that modify these figures to rough equality, the verdict is clear that India's economy has surpassed that of the UK based on future growth prospects," the report said.
India overtook UK & became 5th largest GDP after USA, China, Japan & Germany."
2017: 6th in the world in $ terms
India surpasses France, now 6th largest economy, July 12, 2018: The Times of India
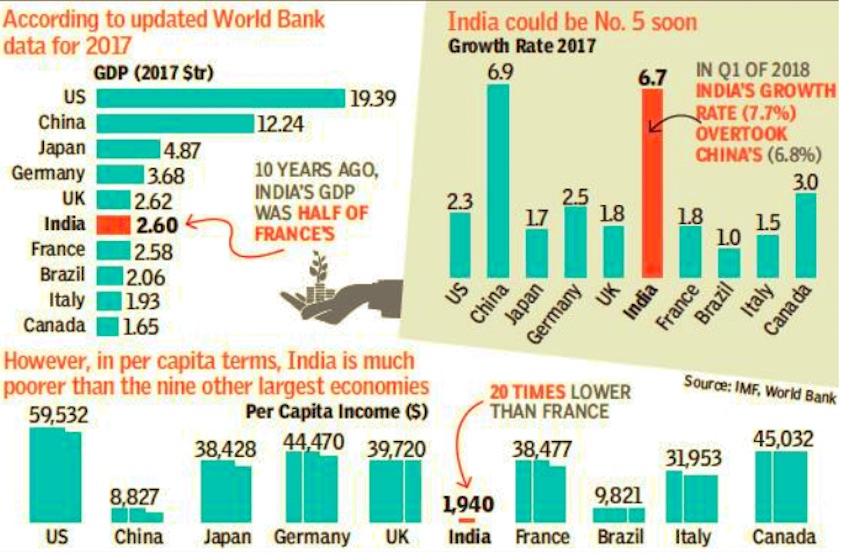
i) Gross domestic products;
ii) Growth rates of their economies; and
iii) Per capita incomes.
From: July 12, 2018: The Times of India
See graphic:
India, China and other major economies in 2017:
i) Gross domestic products;
ii) Growth rates of their economies; and
iii) Per capita incomes.
India emerged as the world’s sixth-largest economy in 2017, surpassing France, and is likely to go past the UK, which is at fifth position, according to an analysis of World Bank data.
In 2017, India became the sixth-largest economy, with a GDP of $2.59 trillion, relegating France to seventh (GDP $2.58 trillion). The UK, which has been facing Brexit blues, had a GDP of $2.62 trillion, which was $25 billion more than India’s.
The US remains the world’s largest economy, with a size of $19.39 trillion, followed by China, Japan and Ger many.
2018/ India slips from no.5 to 7: WB
August 2, 2019: The Times of India
From: August 2, 2019: The Times of India
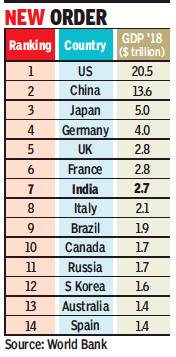
India has been pushed to the seventh place in the global GDP rankings in 2018 with the UK and France forging ahead to the fifth and sixth spots, data compiled by the World Bank showed. In 2017, India had emerged as the sixth largest economy, while France was pushed to the seventh place in the global GDP league table.
The US remains the top economy with a GDP of $20.5 trillion in 2018. China was the second largest economy with $13.6 trillion, while Japan took the third place with $5 trillion. India’s GDP was at $2.7 trillion in 2018, while UK and France were at $2.8 trillion.
In 2017, India was at $2.65 trillion, UK at $2.64 trillion and France at $2.5 trillion, helping the third-largest economy in Asia to emerge as the fifth largest economy at that time.
Economists said India taking the seventh largest global economy tag in 2018 was largely due to the currency fluctuations and slowdown in growth. “In 2017, the rupee appreciated against the dollar, and in 2018 it depreciated against the dollar. So, it is largely due to currency fluctuation and the growth slowdown,” said Devendra Pant, chief economist at India Ratings and research. He added that the ranking could change if growth picks up.
India still remains the fastest-growing major economy in the world, although growth is estimated to slow to 7% in the current fiscal year that ends in March. China is expected to face a sharper slowdown due to the ongoing tariff war with the US.
Last month, research firm IHS Markit had said that India will overtake the UK as the fifth largest economy in the world in 2019 and is likely to shoot past Japan to emerge as the third-largest economy by 2025.
The government has unveiled a plan to emerge as a $5 trillion economy by 2024-25 and the Economic survey for 2018-19 has said that the country needs to sustain a real GDP growth rate of 8% to achieve the goal.
While growth is expected to be in the 7% range in the current fiscal year, most economists and multilateral agencies expect it to gather momentum and push past over the 7% mark next year as the impact of the measures unveiled by the government takes hold.
GDP, year-wise
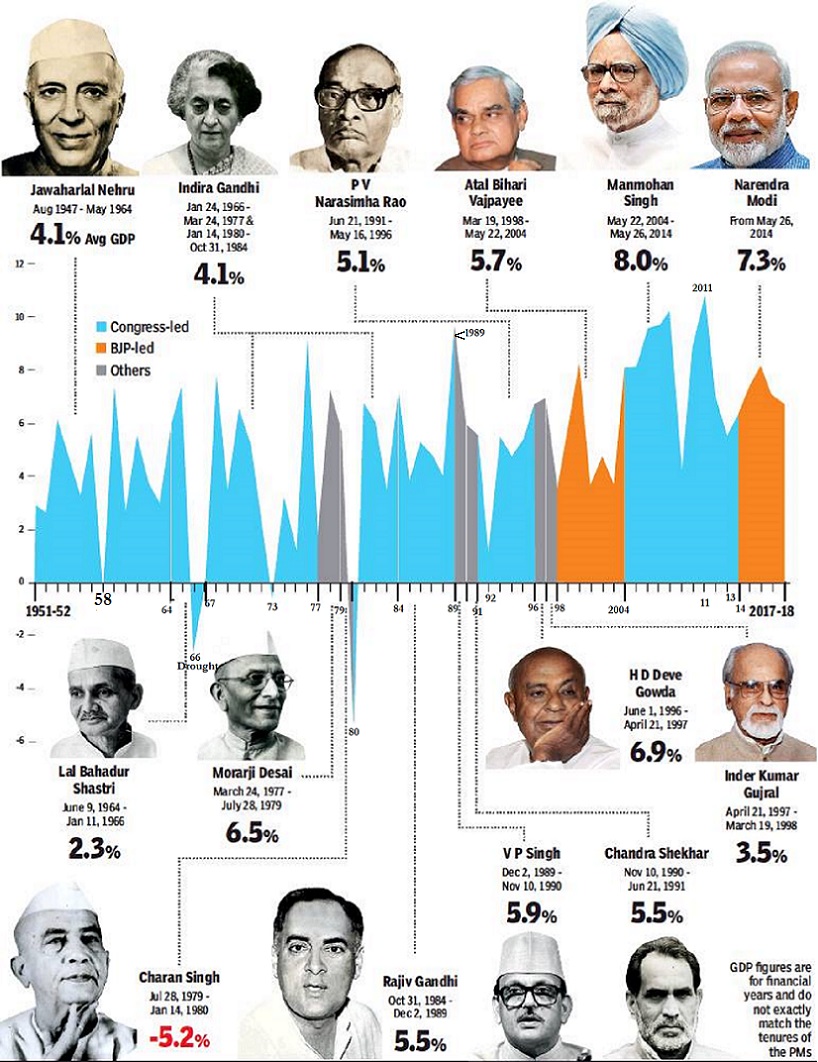
1951-2018: GDP growth under different Prime Ministers
From The Times of India
See graphic:
1951-2018: India’s GDP growth under different Prime Ministers
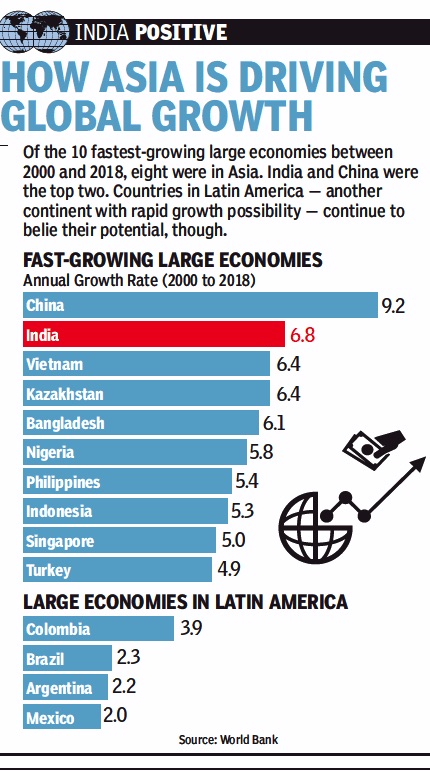
4,2==2000-18: Growth in India, Bangladesh, China + Asian, Latin economies==
From: Sep 3, 2019: The Times of India
See graphic :
2000-18: GDP growth in India, Bangladesh, China + Asian, Latin economies
2005-12 figures were revised downwards in 2018
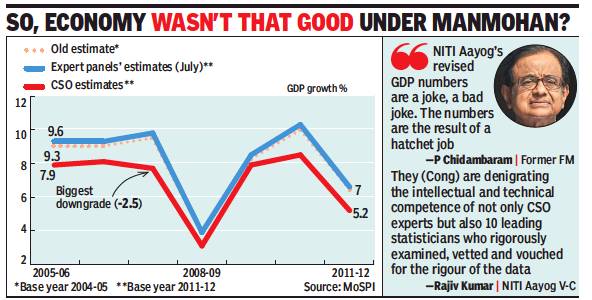
Row erupts as new data trims UPA-era GDP growth figures, November 29, 2018: The Times of India
From: Row erupts as new data trims UPA-era GDP growth figures, November 29, 2018: The Times of India
Congress: Govt Wants People To Believe 2+2=8
The government re-estimated the GDP linked to 2011-12 prices, lowering the growth rates during the UPA regime, prompting a sharp reaction from Congress.
“The Modi government and its puppet Niti Aayog want the people to believe that 2+2=8! Such is the gimmickry, jugglery, trickery and chickanery being sold as ‘back series data’,” the party said.
The back series data from 2004-05 to 2011-12 showed that GDP growth rate in 2011-12 has been revised down to 5.2% from the previous 6.6% expansion that was based on the 2004-05 base year. Similarly, growth for 2010-11 has been pared to 8.5%, from 10.3% under the old series. The base year is revised periodically to reflect changes in the economy.
The Central Statistics Office’s back series data is in sharp contrast to the numbers released by a panel on real sector statistics set up by the National Statistical Commission.
The report by the panel headed by Sudipto Mundle, emeritus professor at the National Institute of Public Finance and Policy, had shown the economy growing 10.8% in 2010-11. But the government had said the data provided by the panel was “not official”.
2015> 2016> 2017
GDP growth unchanged at 7.1% for FY17, February 1, 2018: The Times of India
The Central Statistics Office (CSO) revised the Gross Domestic Product (GDP) growth rate for 2015-16 to 8.2% from the earlier estimates of 8% and kept the 2016-17 growth unchanged at 7.1%. The real GDP or GDP at constant (2011-12) prices for the years 2016-17 and 2015-16 stands at Rs 121.9 lakh crore and Rs 113.9 lakh crore respectively, showing growth of 7.1% during 2016-17 and 8.2% during 2015-16, the CSO said in a statement.
2016-17
7% growth in Oct-Dec despite currency controls
See also:
Demonetisation of high value currency- 1946, 1978: India
Demonetisation of high value currency- 2016: India
GDP grows at 7% in Oct-Dec despite note ban squeeze, March 1, 2017: The Times of India
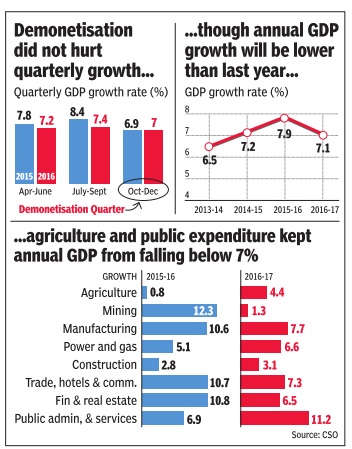
The Indian economy is expected to expand at 7.1% this financial year after factoring in the impact of demonetisation, the Central Statistics Office (CSO) said. Although this is slower than the 7.9% growth registered in 2015-16, it gives the Narendra Modi government the firepower to defend its decision to scrap old Rs 500 and Rs 1,000 notes, which, according to critics, has been disastrous for the economy.
During October-December, CSO's advance estimates showed GDP grew 7%, compared to 7.4% in previous quarter. Opposition parties had said that demonetisation led to massive job losses as companies cut down on production and overall economic activity was disrupted post November 8, even as the government maintained the impact was temporary .While the RBI and the International Monetary Fund have cut growth estimates for the financial year by up to one percentage point, some agencies had predicted sub-6% rise in the December quarter. Those such as Ambit Capital went to the ex tent of projecting less than 4% growth during the year.
Most companies reported a drop in demand during the December-quarter, but official estimates suggest that there was no impact as private final con sumption expenditure as a proportion of GDP remained flat.
The data did result in some elation in the government.“The third quarter GDP numbers are out and, as you have seen, the numbers completely negate the kind of negative projections and speculations made about the impact of demonetisation,“ economic affairs secretary Shaktikanta Das told reporters. Economists, however, pointed out that a revision in the rates for October-December 2015 may have helped improve the performance. “The steep downward revision of Q3 FY16 (October-December 2015) has in turn led to higher growth in Q3 FY17 October-December 2016), thus masking the impact of demonetisation in Q3 figures,“ SBI group chief economic adviser Soumya Kanti Ghosh said in a note.“Overall, the GDP numbers seem to suggest we may have just leapfrogged the impact of demonetisation,“ he added.
Core growth slow to 3.4% in Jan
New Delhi: The growth of eight core sectors slowed down to a five-month low of 3.4% in January, mainly due to contraction in output of refinery products, fertiliser and cement.The growth rate of eight infrastructure sectors of coal, crude oil, natural gas, refinery products, fertilisers, steel, cement and electricity was 5.7% in January 2016. AGENCIES
2017
See graphic:GDP, as in August 2017
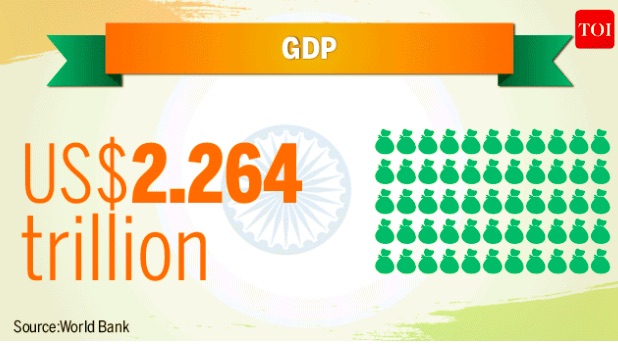
July-Sep 2017: economy grew at 6.3%
December 1, 2017: The Times of India
From: December 1, 2017: The Times of India
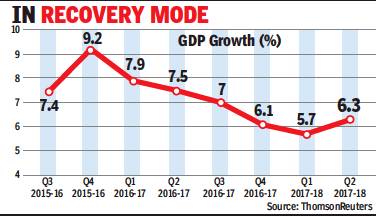
India’s growth staged a recovery in the September quarter as the economy emerged from the shadows of the impact of demonetisation and rollout issues linked to GST, prompting the government to say that it was poised for a durable recovery in the months ahead.
Data released by the Central Statistics Office showed that the economy grew 6.3% in July-September, the second quarter of the current fiscal. It grew faster than the June quarter’s 5.7%, with the expansion being led by robust manufacturing. Growth had slowed to a three-year low in Q1as the impact of demonetisation and GST implementation issues hurt expansion.
2017-18
From: March 16, 2018: The Times of India
See Graphic:
The estimated growth rate of India’s GDP in 2017-18, vis-à-vis that of China and other major economies
2019: govt. revises 2016-18 figures
February 1, 2019: The Times of India
From: February 1, 2019: The Times of India
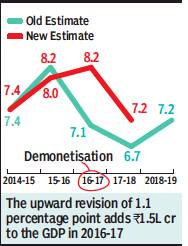
The government sharply revised the GDP growth estimates for the last two financial years, resulting in a 7.2% expansion in 2017-18 and an 8.2% acceleration in economic activity in 2016-17 — making the year of demonetisation the fastest growing fiscal since 2010-11.
The numbers for 2016-17 surprised economists as there was widespread belief that demonetisation slowed down the economy. With quarterly estimates for the year unavailable, analysts were unable to get a fix on the numbers.
“The GDP data for FY17 doesn’t fit in well with high frequency data and the narrative of slowdown after demonetisation. Once quarterly data is released there’ll be more clarity on how growth evolved during that year,” said A Prasanna, chief economist, ICICI Securities Primary Dealership.
Agriculture, real estate witness sharp revision
Another economist suggested that CSO may have over-estimated the extent of economic activity in the informal sector, which is seen to have borne the brunt of the Modi government’s decision to scrap the old Rs 500 and Rs 1,000 notes. Government officials said the demonetisation impact was not felt so significantly up to December, when the old currency could still be used for several transactions.
The economy took a hit in the March-quarter as well as the June-quarter, when the effect of de-stocking ahead of GST launch added to the pressure, according to government officials.
“The revision in the data is surprising and it turns the story of a slowdown beginning from the second quarter of FY17 on its head. It may be noted that first quarter FY17 GDP numbers were at their highest level of 8.1% and then started declining. Thus the common notion was that the slowdown in GDP growth had started well before the third quarter of FY17, when demonetization happened, now begs a completely different explanation,” SBI group chief economic adviser Soumya Kanti Ghosh said. He suggested that demonetisation probably resulted in cash being used for consumption.
Based on the gross value added, at constant prices, the sharpest revision was seen in case of agriculture, real estate, transport, other services and construction, which some of the economists suggested did not tally with the reports postdemonetisation. Policymakers have been ecstatic that India has maintained its position as the fastest growing major economy.
2013-19: a slowdown
June 1, 2019: The Times of India
From: June 1, 2019: The Times of India
From: June 1, 2019: The Times of India
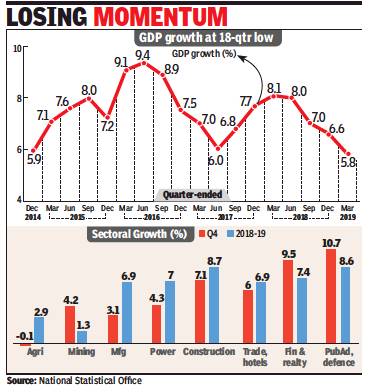
Agri, mfg drag GDP growth below 6% for the first time in 18 quarters
New Delhi:
The Indian economy expanded at its slowest pace in 18 quarters, clocking sub-6% growth in the January-March quarter as demand for cars and consumer goods slumped, while farm output contracted, posing an immediate challenge to the newly sworn in government to reverse the trend.
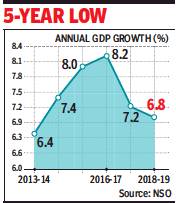
The slowdown in the fourth quarter dragged the annual growth rate to 6.8%, the lowest in five years, according to data released by the National Statistical Office (NSO).
The 5.8% growth registered during January-March 2019 will result in China edging past India for the first time in nearly two years.
The numbers may prompt the monetary policy committee to opt for a fresh round of interest rate reduction when it meets next week as the inflation rate still remains under 3%.
Already, there are demands for a fiscal stimulus from the government, which may pose a tough challenge given that the Centre’s finances are strained.
Slower GDP growth due to temporary factors: Fin secy
Finance secretary Subhash Chandra Garg suggested that the deceleration in growth was due to temporary factors and growth will revive in the coming quarters.
“The slowdown in the fourth quarter GDP was due to temporary factors like stress in the NBFC sector affecting consumption finance. The first quarter of the current fiscal (2019-20) will also witness relatively slow growth and from the second quarter onward it will pick up,” he told reporters. Non-banking finance companies are facing a cash crunch after the collapse of IL&FS, making banks reluctant to lend to them. While there have been demands for reducing taxes on several goods, economists reckon that it may be tough given the fiscal situation. “We expect growth to lift in fiscal 2020, particularly from the second half over a weak base, as normal monsoon, softer interest rates and budgetary measures kick in to support consumption. These factors should help growth cross 7% in fiscal 2020,” said Dharmakirti Joshi, chief economist at rating agency Crisil.
Other economists said there was a need for a fiscal stimulus to combat the slowdown.
“When there is a slowdown, there are two options. Either you accept the slowdown and do nothing or the second is to go for counter-cyclical measures even at the cost of the fiscal deficit target. I would say the second option should be preferred, provided the stimulus is directed at projects which are already on the ground and waiting for funds,” said N R Bhanumurthy, professor at the National Institute of Public Finance and Policy.
2016-19: a slowdown
May 3, 2019: The Times of India
From: May 3, 2019: The Times of India
Eco may have slowed in FY19: Finmin report
‘Declining Growth Of Private Consumption & Muted Exports Are Reasons Behind Slowdown’
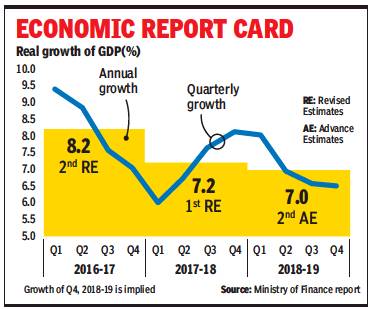
New Delhi: India’s economy appears to have slowed down slightly in 2018-19, a finance ministry report has said, while listing some challenges that need to be addressed to get the momentum going.
The latest comments about growth come in the midst of general elections and are expected to trigger a debate about the health of the economy under Prime Minister Narendra Modi’s watch. The NDA government has showcased high economic growth to highlight its governance record. The monthly economic report of the department of economic affairs listed the factors behind the slowdown. It is a widely acknowledged fact that growth momentum in the fourth quarter of 2018-19 had slowed down due to a string of factors.
“The proximate factors responsible for this slowdown include declining growth of private consumption, tepid increase in fixed investment, and muted exports. On the supply side, the challenge is to reverse the slowdown in growth of agriculture sector and sustain the growth in industry,” said the report.
The report also comes against the backdrop of data pointing to slowdown in some sectors such as automobiles and overall manufacturing. GDP growth in the October-December quarter of 2018-19 slowed to 6.6%, while the Central Statistics Office (CSO) has estimated growth for 2018-19 at 7%, marginally down from the previous estimate of 7.2%.
The Reserve Bank of India (RBI) in its monetary policy statement said that more recent high frequency indicators point to manufacturing growth slowing down while investment demand remaining muted. The central bank has cut rates twice to support growth in the face of slowing inflation.
However, India remains the fastest growing major economy in the world and most multilateral agencies see growth picking up in the months ahead on the back of reform measures undertaken by the government. The new government which assumes office later this month is also expected to unveil steps to boost growth.
The finance ministry report said that on the external front, current account deficit, which is an indicator of the country’s ability to meet its overseas obligations, as ratio to GDP is set to fall in the fourth quarter of 2018-19, which will limit the leakage of growth impulse from the economy.
2015- 22/ 23
February 1, 2023: The Times of India
From: February 1, 2023: The Times of India
Team TOI
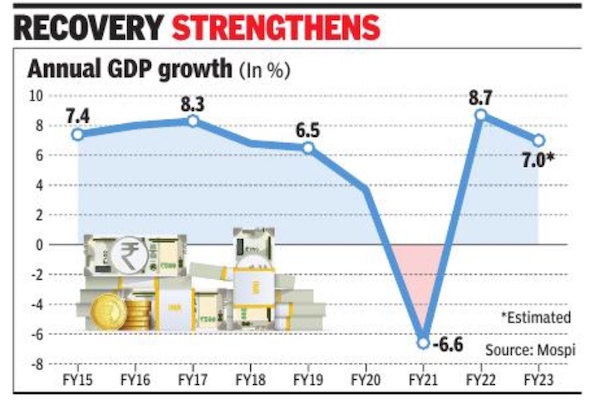
India’s economic growth is projected between 6-6. 8% in 2023-24, depending on the trajectory of economic and political developments globally, the Economic Survey said and asserted that overall, the inflation challenge in FY24 must be a lot less stiff than it has been this financial year.
Against the backdrop of risks, the survey projects a baseline GDP growth of 6. 5% for 2023-24. The GDP growth forecasts of the survey is below the 7% growth estimated for the current fiscal year which ends in March. “The projection is broadly comparable to the estimates provided by multilateral agencies such as the World Bank, IMF, and ADB and by the RBI, domestically. ” according to the survey, which is a snapshot of the economy in 2022-23.
It said the Indian economy, however, appears to have moved on after its encounter with the pandemic, staging a full recovery in FY22 ahead of many nations and positioning itself to ascend to the pre-pandemic growth path in FY23.
It cited several risks for the economy, including slowing global growth, hawkish stance of global central banks on inflation and slowing exports. “While commodity prices have retreated from record highs, they are still above pre-conflict levels. Strong domestic demand amid high commodity prices will raise India’s total import bill and contribute to unfavourable developments in the current account balance,” according to the survey. “Thesemay be exacerbated by plateauing export growth on account of slackening global demand. Should the current account deficit widen further, the currency may come under depreciation pressure. ”
The survey also expects inflation to moderate and remain within range. “It is notwishful thinking that 2023 will show less macroeconomic volatility than its preceding financial year. Both CPI-C and WPI have fallen below 6% (which is the RBI tolerance limit for the former) and are on the descending slope of the surge that hit the economy in the first half ofthe current fiscal. International crude oil prices, the principal drivers of inflation this financial year, have returned to normal levels and so have prices of other major commodities. ”
The survey, authored by chief economic adviser V Anantha Nageswaran, said India’s inflation management has been particularly noteworthy and can be contrasted with advanced economies that are still grappling with sticky inflation rates.
“Due to the anticipated slowdown in advanced economies, inflation risks coming from global commodity prices are likely to be lower in FY24 than in FY23. However, in terms of overall risks to the benign baseline view on inflation, upside risks to India’s projected rates may outweigh the downside. ”
Impact of poor monsoons on GDP growth
`Poor rains unlikely to impact GDP growth much'
Prabhakar Sinha New Delhi:
TNN [The Times of India Jun 19 2014
Even as country braces for likely deficient monsoon, its impact on GDP may not be very significant.
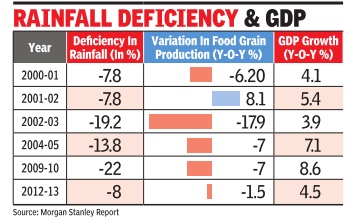
The decline in farm output as a result of shortfall in rains is unlikely to reduce GDP growth rate in 2014 by more than 0.5 percentage points, says global research firm Morgan Stanley in its latest report
The production of pulses and oil seeds, the report points out, may be worst affected, leading to rise in prices of these items and to bridge the demand-supply gap, the country will have to depend on imports.
Trends in monsoon rainfall will be critical for the overall inflation outlook. While food inflation has softened over the last few months, a poor monsoon may reverse the trend. Monsoon rains have an important bearing on inflation with primary and manufactured articles contributing 24.3% weight in overall wholesale price index and 47.6% in the new Consumer price Index. While the countrywide shortfall in rains is expected to be around 7%, the spatial (region-wise) distribution forecast shows that monsoon deficiency in North-West India may be 8% with a 71% probability . But being the most irrigated region in the country , it currently boasts of full reservoirs. So, according to the report, the region that comprises of Punjab, Haryana and Western UP and produces most of the Kharif crops should see a near-normal production.
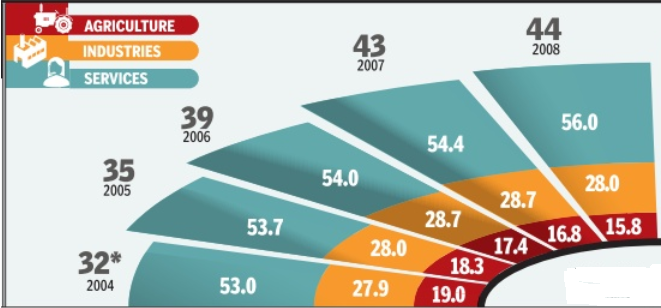
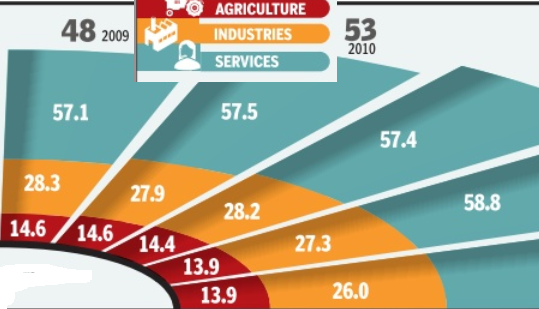
If El Nino fears were to come true, the report says, there will be downside risks to Morgan Stanley's estimate of agricultural growth at 2.4% in 2014-15. With agriculture accounting for only 15% of GDP, one percentage point reduction in agricultural growth rate will lead to 15 basis points (100 basis points make one percentage point) decline in GDP growth.
Therefore, even if there is no growth in the agricultural sector, the direct impact on GDP growth will not be of more than 0.5 percentage point, predicts report.
GDP, India and the world
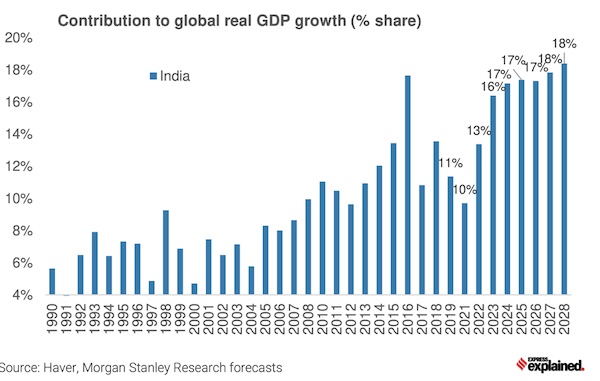
Contribution to real GDP growth in the world: 1990-2023
From: Udit Misra, January 18, 2024: The Indian Express
See graphic:
India’s contribution to global real GDP growth
2002> 16: India vis-à-vis other countries
No evidence of GDP overestimation, February 1, 2020: The Times of India
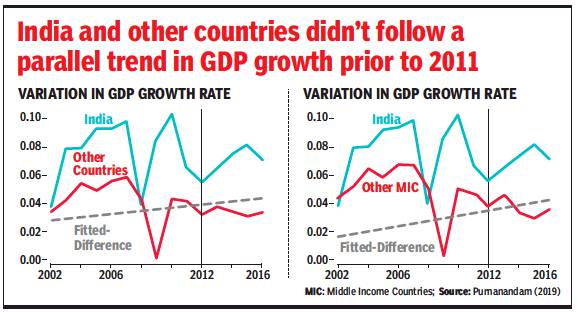
Variation in GDP growth rate, India and other Middle Income Countries, 2002> 16
From: No evidence of GDP overestimation, February 1, 2020: The Times of India
Concerns of overestimation of India’s GDP are unfounded, the Economic Survey said, putting at rest for now the controversy over data triggered by former chief economic adviser Arvind Subramanian.
The survey authored by chief economic adviser Krishnamurthy Subramanian said by using careful statistical and econometric analysis that does justice to importance of this issue, there was no evidence of misestimation of India’s GDP growth. It said countries differ among each other in various observed and unobserved ways.
“Therefore, cross-country comparisons are fraught with risks of incorrect inference due to various confounding factors that stem from such inherent differences. As a result, crosscountry analysis has to be carefully undertaken so that correlation is distinguished from causality.”
“The models that incorrectly overestimate GDP growth by 2.77% for India post-2011 also misestimate GDP growth over the same time period for 51 other countries out of 95 countries in the sample.” It said magnitude of misestimation in the incorrectly specified model is anywhere between +4% to -4.6%, including the UK by +1.6%, Germany by +1.0%, Singapore by -2.3%, South Africa by -1.2% and Belgium by -1.3%.
Citing studies, the report card on economy said India’s improvement in indicators such as access to nutrition and electricity might explain the higher growth rate in Indian GDP post the methodological change.
2016-17: India, China, USA
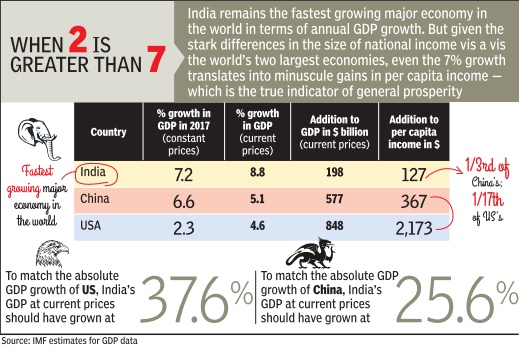
See graphic.
India, China and the USA: GDP growth in 2016-17

From: Oct 15, 2021: The Times of India
See graphic:
2016-20: India’s share of the world’s GDP
2017, 2018: Brazil, China, Europe, India, Japan, Russia
January 14, 2019: The Times of India
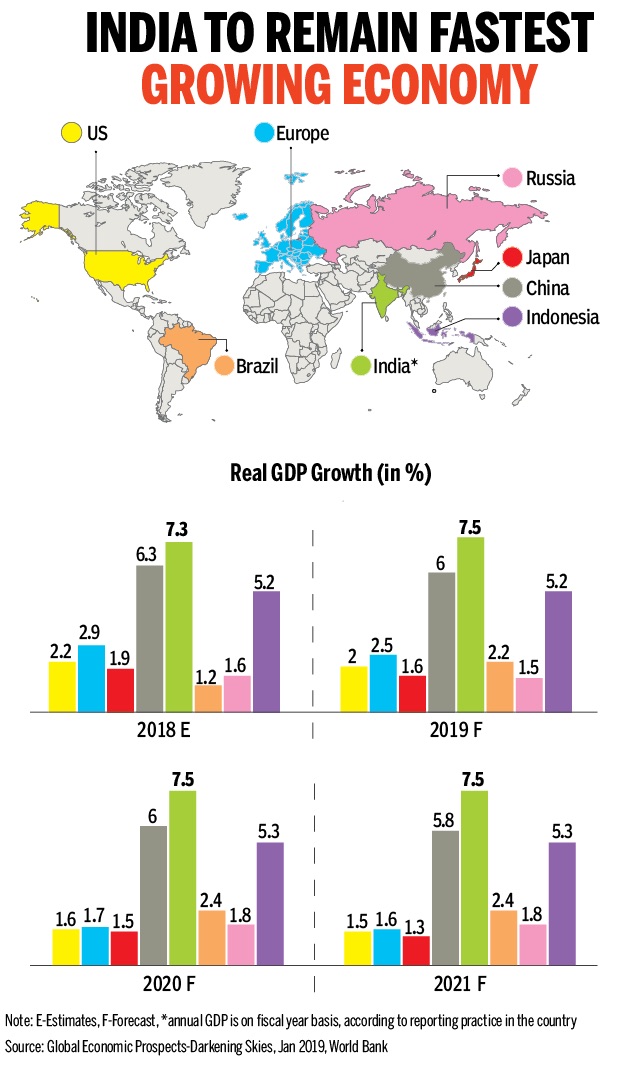
From: January 14, 2019: The Times of India
See graphic:
2017, 2018: India’s GDP growth vis-à-vis that in Brazil, China, Europe, Japan and Russia
Despite all odds, India is expected to remain the fastest growing emerging market economy, at 7.5% rate. At least for three years in a row, according to a recently released report by World Bank. China, on the other hand, will moderate to 6.3% in 2019 and 6% in the following two years.
India’s rank in the world: 2024

From: January 7, 2025: The Times of India
See graphic:
The purchasing power parity adjusted GDP of India and other G20 countries in 2024
Methodology for estimating GDP
The 2019 controversy
May 10, 2019: The Times of India
Controversy over GDP data explained
NEW DELHI: A report by the National Sample Service Office (NSSO) on the services sector revealed that at least 38% of the firms in the MCA-21 database used for calculating GDP numbers were either out of coverage or untraceable. According to some economists, this could lead to overestimation of GDP data and could have an impact on the final numbers.
What does the government say to defend its data system? The results of this NSSO report will be examined by the advisory committee, before finalising the approach and methodology for the proposed new 2017-18 series.
The ministry of statistics and programme implementation (MOSPI) said that there is no impact on the existing GDP/GVA (gross value added) estimates for the corporate sector as care is taken to appropriately adjust the corporate filings at the aggregate level, based on the paidup capital.
What is the new methodology for estimating GDP?
In June 2015, MOSPI unveiled the new series of national accounts with the 2011-12 base year and also inducted a new methodology and data sources. The major components influencing the present revision include:
A) Revision of base year to a more recent year. B) Complete review of existing data base and methodology employed in the estimation of various macro-economic aggregates, including choice of the alternative databases on individual subjects.
What are the new sources for calculating GDP data?
In 2004-05 series, the private corporate sector was being covered by using RBI study on company finances. Estimates were compiled on the basis of financial results of around 2,500 companies.
In 2011-12 series, comprehensive coverage of corporate sector has been ensured in mining, manufacturing and services by incorporating annual accounts of companies as filed with the ministry of corporate affairs (MCA) under their e-governance initiative MCA-21.
Accounts of about five lakh companies have been analysed and incorporated for 2011-12 and 2012-13, while the number of common companies (for which accounts are available for 2012-13) is around three lakh for 2013-14.
In the new series, the coverage of financial sector has been expanded by including stock brokers, stock exchanges, asset management companies, mutual funds and pension funds, as well as the regulatory bodies — Sebi, PFRDA and IRDA. The new series also has an improved coverage of local bodies and institutions.
Efforts have been made to make use of as much current data as possible and results of latest available surveys on employment-unemployment, consumer expenditure, livestock census, housing and population census, construction sector, among others have been included.
What economists are saying?
The new GDP series is no stranger to controversy. Several experts had issues with the new estimation. The government has stoutly defended the method, which it says conforms to global standards.
Pronab Sen, former chief statistician of India, while referring to the controversy, has said NSSO survey on services sector showed that the number of shell companies is large. He said large number of shell companies does not lead to overestimation of GDP. Sen said if the value created by shell companies is not captured then there is a danger of underestimating GDP.
N R Bhanumurthy, professor at National Institute of Public Finance & Policy, said that discrepancies between NSSO surveys and national accounts statistics are long standing. He said it is incorrect to infer that GDP is overestimated as NSSO survey has pointed to a large number of companies as untraceable. “There are other technical issues, an empirical examination of NSSO might help.”
Changes after 2011
June 12, 2019: The Times of India
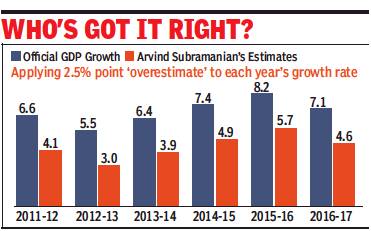
From: June 12, 2019: The Times of India
From: June 12, 2019: The Times of India
Real GDP growth 2.5% lower than official, says previous CEA
Govt: Data Based On Accepted Methods
TIMES NEWS NETWORK
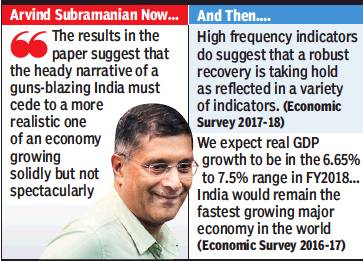
India’s gross domestic product growth rate has been overstated by about 2.5 percentage points per year after 2011, former chief economic adviser Arvind Subramanian has said in a research paper, prompting economists to doubt the size of the claimed overestimation, and the government to defend its data.
He also called for revisiting the methodology for GDP estimation by an independent task force, comprising national and international experts. “…instead of reported average growth of 6.9% between 2011and 2016, actual growth was more likely to have been between 3.5% and 5.5%. Cumulatively, over five years, the level of GDP might have been overstated by about 9-21%,” he wrote in his paper, published at Harvard University.
Change in method post 2011 led to GDP over-estimation: Subramanian
This finding relates to averages over the 2011-2016 period, which encompasses both the UPA-2 and NDA-2 governments. They do not speak to how this average over-estimation may have varied over time within the post-2011 period. At this stage, the data are not adequate to answer such granular questions,” he said.
“It is just a claim in a newspaper article. There may be some overestimation but whether the overestimation is large or not is difficult to tell,” Sudipto Mundle, distinguished fellow at the National Council of Applied Economic Research told TOI. The new GDP methodology uses corporate data from the ministry of corporate affairs MCA-21 database, which some experts have said is flawed and needs a review. Pronab Sen, former chief statistician of India, also expressed doubts about Subramanian’s estimates.
“Using the same data I could very well argue that there was an underestimation of GDP prior to 2011. There is nothing sacrosanct that India should be in line with other countries. We could be an outlier in terms of growth as China was,” Sen said, referring to Subramanian’s comparison of India with other countries. “There may be some overestimation but not that large,” he said.
Subramanian, who was the CEA in the first Narendra Modi government, said a variety of evidence suggests that the methodology changes introduced for the post-2011 GDP estimates led to an over-estimation of GDP growth. He said given the nature of the data, and the impossibility for researchers to reproduce the detailed methodology underlying the GDP estimates, the results in the paper are by no means the final word.
The former CEA, who is now a non-resident senior fellow at Harvard University said further research, building on the results in the paper —which itself builds on preliminary work done in the economic survey— will uncover further insights.
Stating that growth overestimates matter not just for reputational reasons but critically for internal policymaking, Subramanian said if the new evidence is right, it would imply that both monetary and fiscal policies over the last years were overly tight from a cyclical perspective.
“Consider this. Real policy interest rates in the last few years have been at about 2.5%, well above the RBI’s own estimate of the neutral rate of about 1.25-1.5%. Now, if real activity is weak, the policy rate should be below the neutral rate instead of exceeding it: the net difference could have been rates about 150 basis points higher than necessary,” Subramanian said.
“The Indian policy automobile has been navigated with a faulty or even broken speedometer,” he said, stressing the need to revisit the GDP data methodology.
He highlighted two major policy implications of the findings of the research paper. “First, growth must be restored as a key policy objective. Going forward, there must be both the urgency from the new knowledge that growth is weaker-than-believed and the re-embrace of growth as necessary to accomplish other objectives,” he said.
The second implication, according to him, is to improve the quality and integrity of data in the country.
“India must restore the reputational damage suffered to data generation in India across the boardfrom GDP to employment to government accounts—not just by conferring statutory independence on the National Statistical Commission, but also appointing people with stellar technical and personal reputations,” Subramanian said.
“If statistics are sacred enough to require insulation from political pressures, they are perhaps also too important to be left to the statisticians alone. Nothing less than the future of the Indian economy and the lives of 1.4 billion citizens rides on getting numbers and measurement right,” he added.
Natural wealth vis-à-vis created wealth
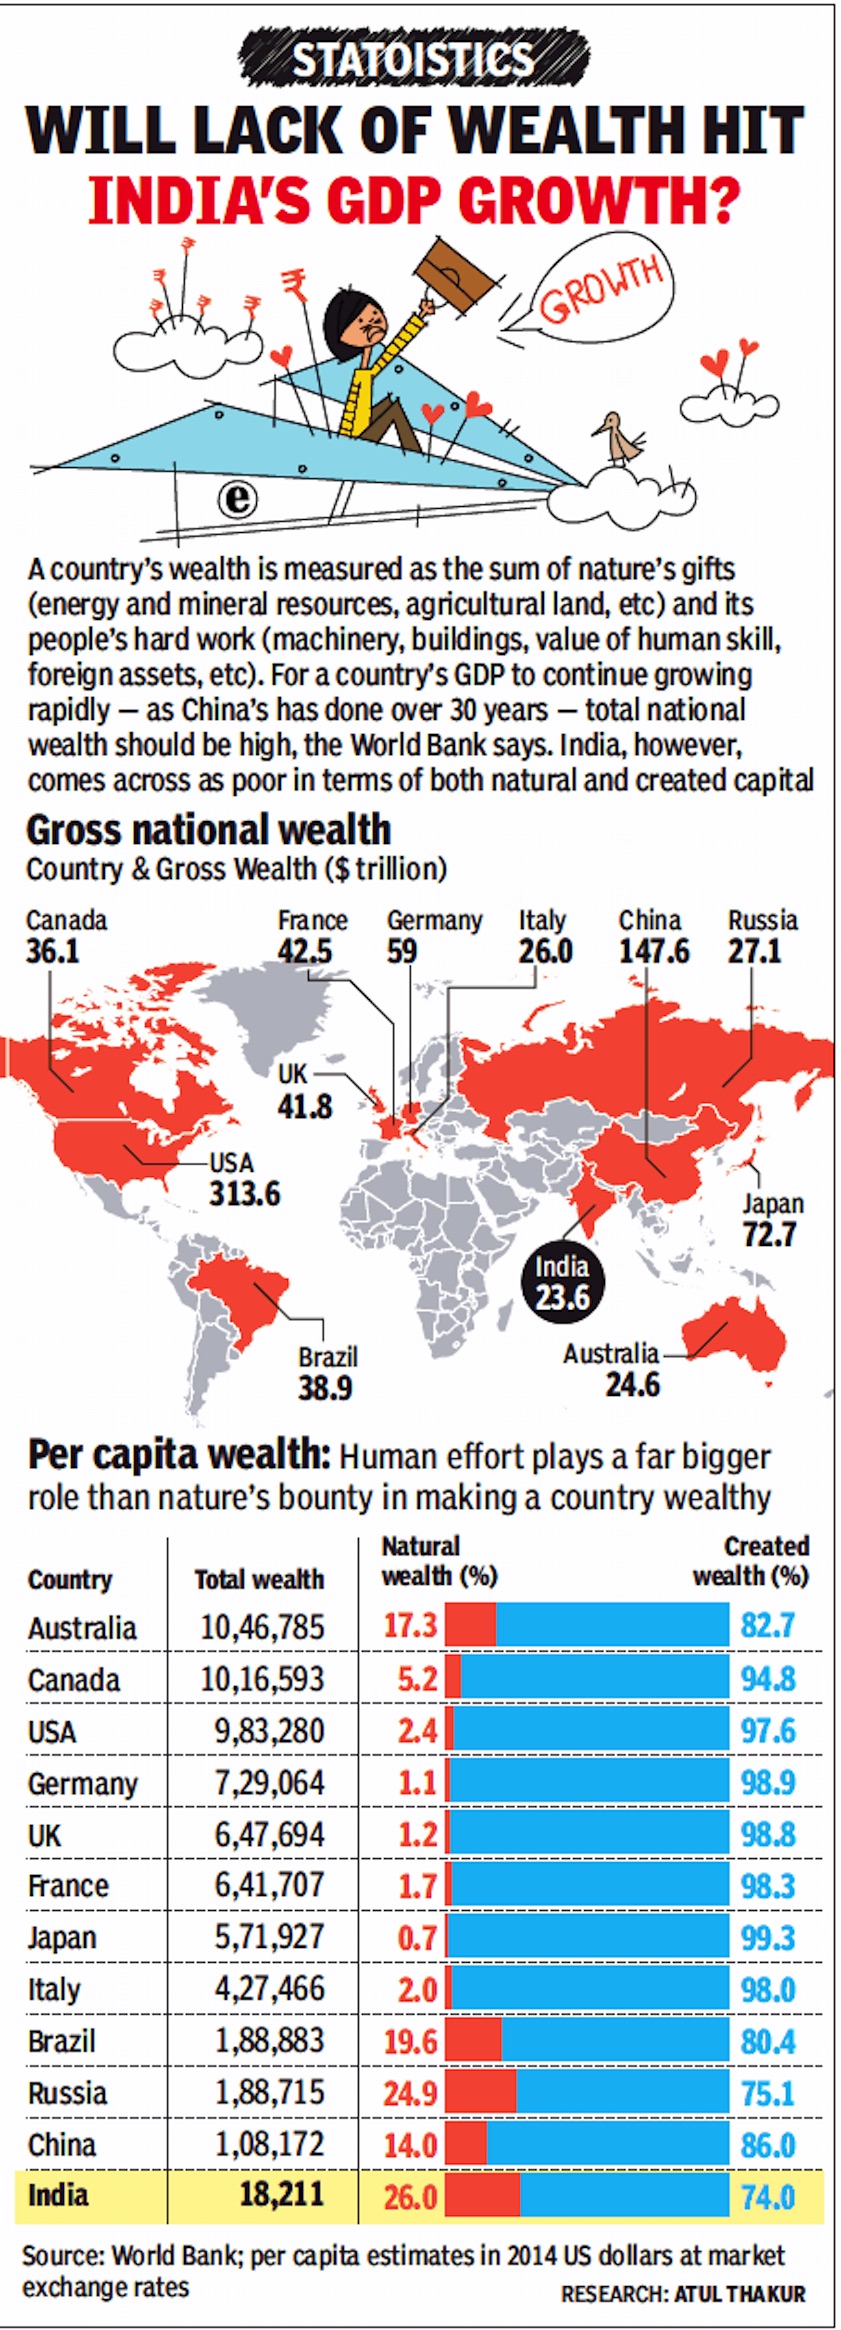
2014: The wealth of India and 11 major economies
From: April 30, 2018: The Times of India
See graphic:
Natural wealth, created wealth and total wealth: India vis-à-vis eleven major economies, 2014
PPP
World's 3rd-largest economy in 2011
India became 3rd-largest economy in 2011 from 10th in 2005
PTI | Apr 30, 2014
India emerged as the world's third-largest economy in 2011.
"The economies of Japan and the UK became smaller compared to the US, while Germany increased slightly, France and Italy remained the same," according to data released on Wednesday by the International Comparison Program (ICP), hosted by the Development Data Group at the World Bank Group.
"The relative rankings of the three Asian economies — China, India, and Indonesia — to the US doubled, while Brazil, Mexico and Russia increased by one-third or more," the report said. The world produced goods and services worth over $90 trillion in 2011 and that almost half of the total output came from low and middle-income countries, it said.
According to the major findings of the ICP, six of the world's 12 largest economies were in the middle-income category (based on the World Bank's definition).
When combined, the 12 largest economies accounted for two-thirds of the world economy and 59 per cent of the population, it said.
The purchasing power parities (PPPs)-based world GDP amounted to $90,647 billion, compared with $70,294 billion measured by exchange rates, it said, adding that the share of middle-income economies in global GDP is 48 per cent when using PPPs and 32 per cent when using exchange rates.
The six largest middle-income economies — China, India, Russia, Brazil, Indonesia and Mexico — account for 32.3 per cent of world GDP, whereas the six largest high-income economies — US, Japan, Germany, France, UK and Italy — account for 32.9 per cent, the report said.
Asia and the Pacific, including China and India, account for 30 per cent of world GDP, Eurostat-OECD 54 per cent, Latin America 5.5 per cent (excluding Mexico, which participates in the OECD and Argentina, which did not participate in the ICP 2011), Africa and Western Asia about 4.5 per cent each.
"China and India make up two-thirds of the Asia and the Pacific economy, excluding Japan and South Korea, which are part of the OECD comparison. Russia accounts for more than 70 per cent of the CIS, and Brazil for 56 per cent of Latin America. South Africa, Egypt, and Nigeria account for about half of the African economy," said the report.
"At 27 per cent, China now has the largest share of the world's expenditure for investment (gross fixed capital formation) followed by the US at 13 per cent.
India, Japan and Indonesia follow with 7 per cent, 4 per cent, and 3 per cent, respectively," the report said.
China and India account for about 80 per cent of investment expenditure in the Asia and the Pacific region.
The report said low-income economies, as a share of world GDP, were more than two times larger based on PPPs than respective exchange rate shares in 2011.
Yet, these economies accounted for only 1.5 per cent of the global economy, but nearly 11 per cent of the world population.
Roughly 28 per cent of the world's population lives in economies with GDP per capita expenditure above the $13,460 world average and 72 per cent are below that average.
The approximate median yearly per capita expenditure for the world — at $10,057 — means that half of the global population has per capita expenditure above that amount and half below, it said.
The five economies with the highest GDP per capita are Qatar, Macao, Luxembourg, Kuwait and Brunei.
The five economies with highest actual individual consumption per capita are Bermuda, US, Cayman Islands, Hong Kong and Luxembourg.
The world average actual individual consumption per capita is approximately $8,647, it said.
Services
1950-2017
June 8, 2019: The Times of India
From: June 8, 2019: The Times of India
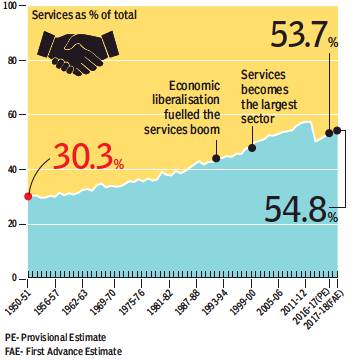
Though prematurely, services’ share in India’s GDP mirrors rich world
As a poor country develops, labour-intensive manufacturing replaces agriculture as its main economic activity. Services doesn’t become its mainstay until it is fairly advanced.
But India’s growth seems to have bypassed the industrial phase as services became the dominant sector of its economy as early as 1999-2000. Many experts point out this development model has brought GDP growth without sufficient jobs.
The states: gross state domestic product (GSDP)
2017-18
Bihar posted highest rise in state GDP in 2017-18, January 22, 2019: The Times of India
From: Bihar posted highest rise in state GDP in 2017-18, January 22, 2019: The Times of India
From: January 22, 2019: The Times of India
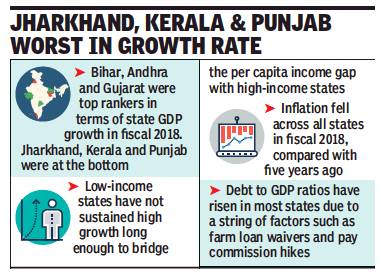
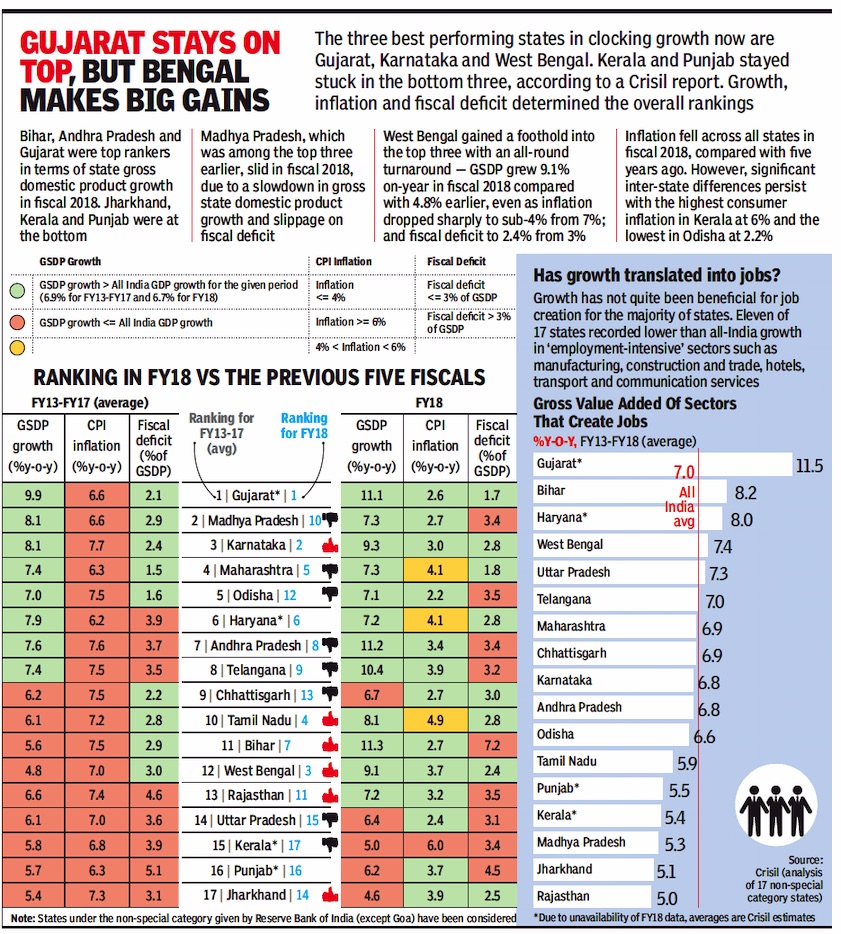
Bihar topped the list of 17 states with 11.3% expansion in terms of gross state domestic product (GSDP) growth in 2017-18, followed by Andhra Pradesh and Gujarat, according to a report by ratings agency Crisil.
In rankings according to growth, inflation and fiscal deficit, Gujarat and Karnataka remained among the top three performing states in fiscal year 2018. Jharkhand, Kerala and Punjab were at the bottom of the table in terms of growth.
The agency ranked 17 states, which are non-special category states on different parameters based on Central Statistics Office data. It left out Goa as it is a small state.
West Bengal gained a foothold into the top three with an all-round turnaround – GSDP grew 9.1% on-year in fiscal year 2018 compared with 4.8% earlier, even as inflation dropped sharply to sub-4% from 7%, and fiscal deficit to 2.4% from 3%.
Defying the national trend of slowdown in GDP growth in fiscal 2018, 12 out of 17 nonspecial states saw faster growth in fiscal 2018 compared with the previous five years. But this growth hasn’t been equitable. Low-income states have not sustained high growth long enough to meaningfully bridge the per capita income gap with the high-income states. In fact, the chasm has widened, the report said.
2023-24
Priyanka Kakodkar, Nov 4, 2024: The Times of India
Mumbai : Although Maharashtra has the highest share in the country’s GDP, it has declined from 15.2% in 2010-11 to just 13% in 2020-21 and 13.3% in 2023-24, according to aworking paper from the Economic Advisory Council to the PM (EAC-PM) published in Sept. This means a decline of 2% during that span.
The paper notes that Gujarat has seen a “significant increase” in its share in India’s GDP in the last two decades. Its share in national GDP rose from 7.5% in 2010-11 to 8.1% in 2022-23. It also notes that Gujarat’s relative per capita income compared to the national average is higher than Maharashtra’s.
The paper, titled Relative Economic Performance of Indian States: 1960-61 to 2023-24, is authored by economist Sanjeev Sanyal, member of the EAC-PM, and its joint director Aakanksha Arora. It analyses data from the Ministry of Statistics and Programme Implementation.
The state’s economic performance especially com- pared to Gujarat is expected to be a key issue raised by the opposition in the run-up to the assembly polls. However, the state had multiple govts in the two decades when its share in country’s GDP declined. The state was governed by the Congress-NCP alliance from 2009 to 2014, then by the BJP-Sena alliance led by Devendra Fadnavis between 2014-19. It was ruled by the MVA alliance under Uddhav Thackeray between 2019 and 2022. And subsequently by the Mahayuti alliance under Eknath Shinde.
“Maharashtra’s economic performance has re- mained steady throughout the period (1960-61 to 2023-24) despite a slight decline in its share over the last decade. Nevertheless, it continues to hold the highest share among all the states,” the paper points out. Regarding Gujarat, the paper says, its share in national GDP remained broadly at the same levels between 1960-61 and 2000-2001, before beginning to increase rapidly. When it comes to relative per capita income compared to the national average, Maharashtra was behind other states including Gujarat in 2023-24, the data showed.
Other states ahead of Maharashtra in relative per capita income in 2023-24 included Sikkim (319.1%), Delhi (250.8%), Telangana (193.6%), Karnataka (180.7%), Haryana (176.8%) and TN (171.1%). Sikkim reported highest relative per capita income followed by Goa which reported a figure of 290.7% for 2022-23.
The paper notes that both Maharashtra and Gujarat had per capita incomes above the national average since the 1960s.
Top 10 states 2023
From: Twitter
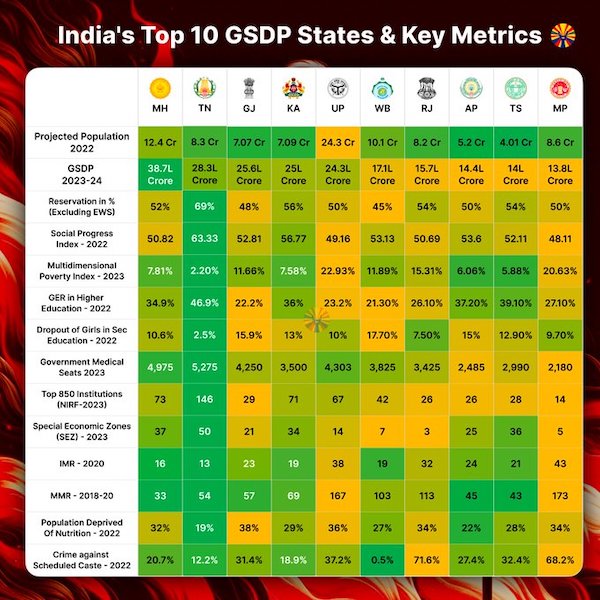
See graphic:
India's top 10 GSDP states and key metrics, 2023
Trade
From: August 29, 2019: The Times of India
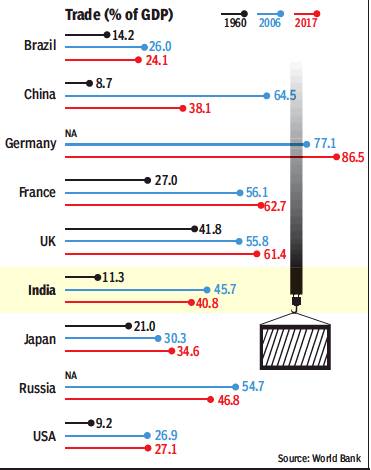
See graphic:
1960-2017: the share of trade in the GDP of India, Brazil, China, France, Germany, Japan, Russia, the UK and the USA.
See also
Gross domestic product (GDP): India
