The population of India: changes, 1901- onwards
This is a collection of articles archived for the excellence of their content. |
Contents |
1901-2011
|
Census Years |
Population |
Decadal growth |
Average annual exponential growth rate (percent) |
Progressive growth rate over 1901 (percent) |
|
|
Absolute |
Percent |
||||
|
1901 |
23,83,96,327 |
|
- |
- |
- |
|
1911 |
25,20,93,390 |
1,36,97,063 |
5.75 |
0.56 |
5.75 |
|
1921 |
25,13,21,213 |
-7,22,177 |
(0.31) |
-0.03 |
5.42 |
|
1931 |
27,89,77,238 |
2,76,56,025 |
11.00 |
1.04 |
17.02 |
|
1941 |
31,86,60,580 |
3,96,83,342 |
14.22 |
1.33 |
33.67 |
|
1951 |
36,10,88,090 |
4,24,27,510 |
13.31 |
1.25 |
51.47 |
|
1961 |
43,92,34,771 |
7,81,46,681 |
21.64 |
1.96 |
84.25 |
|
1971 |
54,81,59,652 |
10,89,24,881 |
24.80 |
2.20 |
129.94 |
|
1981 |
68,33,29.097 |
13,51,69,445 |
24.66 |
2.22 |
186.64 |
|
1991 |
84,64,21,039 |
16,30,91,942 |
23.87 |
2.16 |
255.05 |
|
2001 |
1,02,87,37,436 |
18,23,16,397 |
21.54 |
1.97 |
331.52 |
|
2011 |
1,21,01,93,422 |
18,14,55,986 |
17.64 |
1.64 |
407.64 |
1951-2011
December 22, 2014: The Planning Commission]
Population of India (1951-2011))- (in thousands)
|
Sl No |
States/Union Territorries |
1951 |
1961 |
1971 |
1981 |
1991 |
2001 |
2011 |
|
1 |
Andaman & Nicobar Islands |
31 |
64 |
115 |
189 |
281 |
356 |
381 |
|
2 |
Andhra Pradesh |
31,115 |
35,983 |
43,503 |
53,551 |
66,508 |
76,210 |
84,581 |
|
3 |
Arunachal Pradesh d |
na |
337 |
468 |
632 |
865 |
1,098 |
1,384 |
|
4 |
Assam a |
8,029 |
10,837 |
14,625 |
18,041 |
22,414 |
26,656 |
31,206 |
|
5 |
Bihar |
29,085 |
34,841 |
42,126 |
52,303 |
64,531 |
82,999 |
104,099 |
|
6 |
Chandigarh |
24 |
120 |
257 |
452 |
642 |
901 |
1,055 |
|
7 |
Chhatisgarh |
7,457 |
9,154 |
11,637 |
14,010 |
17,615 |
20,834 |
25,545 |
|
8 |
Dadra & Nagar Haveli |
42 |
58 |
74 |
104 |
138 |
220 |
344 |
|
9 |
Daman & Diu |
49 |
37 |
63 |
79 |
102 |
158 |
243 |
|
10 |
Delhi |
1,744 |
2,659 |
4,066 |
6,220 |
9,421 |
13,851 |
16,788 |
|
11 |
Goa |
547 |
590 |
795 |
1,008 |
1,170 |
1,348 |
1,459 |
|
12 |
Gujarat |
16,263 |
20,633 |
26,697 |
34,086 |
41,310 |
50,671 |
60,440 |
|
13 |
Haryana |
5,674 |
7,591 |
10,036 |
12,922 |
16,464 |
21,145 |
25,351 |
|
14 |
Himachal Pradesh |
2,386 |
2,812 |
3,460 |
4,281 |
5,171 |
6,078 |
6,865 |
|
15 |
Jammu & Kashmir b |
3,254 |
3,561 |
4,617 |
5,987 |
7,837 |
10,144 |
12,541 |
|
16 |
Jharkhand |
9,697 |
11,606 |
14,227 |
17,612 |
21,844 |
26,946 |
32,988 |
|
17 |
Karnataka |
19,402 |
23,587 |
29,299 |
37,136 |
44,977 |
52,851 |
61,095 |
|
18 |
Kerala |
13,549 |
16,904 |
21,347 |
25,454 |
29,099 |
31,841 |
33,406 |
|
19 |
Lakshadweep |
21 |
24 |
32 |
40 |
52 |
61 |
64 |
|
20 |
Madhya Pradesh |
18,615 |
23,218 |
30,017 |
38,169 |
48,566 |
60,348 |
72,627 |
|
21 |
Maharashtra |
32,003 |
39,554 |
50,412 |
62,783 |
78,937 |
96,879 |
112,374 |
|
22 |
Manipur c |
578 |
780 |
1,073 |
1,421 |
1,837 |
2,294 |
2,856 |
|
23 |
Meghalaya |
606 |
769 |
1,012 |
1,336 |
1,775 |
2,319 |
2,967 |
|
24 |
Mizoram |
196 |
266 |
332 |
494 |
690 |
889 |
1,097 |
|
25 |
Nagaland |
213 |
369 |
516 |
775 |
1,210 |
1,990 |
1,979 |
|
26 |
Orissa |
14,646 |
17,549 |
21,945 |
26,370 |
31,660 |
36,805 |
41,974 |
|
27 |
Puducherry |
317 |
369 |
472 |
604 |
808 |
974 |
1,248 |
|
28 |
Punjab |
9,161 |
11,135 |
13,551 |
16,789 |
20,282 |
24,359 |
27,743 |
|
29 |
Rajasthan |
15,971 |
20,156 |
25,766 |
34,262 |
44,006 |
56,507 |
68,548 |
|
30 |
Sikkim |
138 |
162 |
210 |
316 |
406 |
541 |
611 |
|
31 |
Tamil Nadu |
30,119 |
33,687 |
41,199 |
48,408 |
55,859 |
62,406 |
72,147 |
|
32 |
Tripura |
639 |
1,142 |
1,556 |
2,053 |
2,757 |
3,199 |
3,674 |
|
33 |
Uttar Pradesh |
60,274 |
70,144 |
83,849 |
105,137 |
132,062 |
166,198 |
199,812 |
|
34 |
Uttarakhand |
2,946 |
3,611 |
4,493 |
5,726 |
7,051 |
8,489 |
10,086 |
|
35 |
West Bengal |
26,300 |
34,926 |
44,312 |
54,581 |
68,078 |
80,176 |
91,276 |
|
ALL INDIA c |
361,088 |
439,235 |
548,160 |
683,329 |
846,421 |
1,028,737 |
1,210,855 | |
Source : Office of the Registrar General of India, Ministry of Home Affairs & Economic Survey 2013-14.
Notes:
a The 1981 Census could not be held in Assam. Total population for 1981 has been worked out by Interpolation.
b The 1991 Census could not be held in Jammu & Kashmir. Total population for 1991 has been worked out by Interpolation.
c India and Manipur figures include estimated population for those of the three sub-divisions viz. Mao Maram, Paomata and Purul Senapati districts of Manipur.
d Census conducted for the first time in 1961.
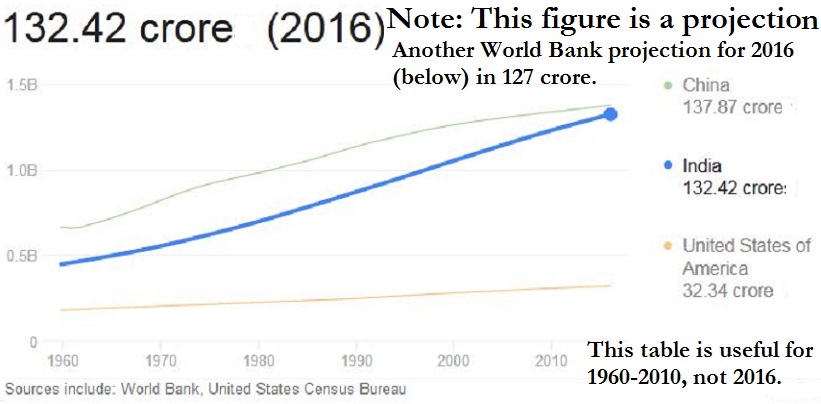
1960-2010
See graphic:
The Population of India, 1960-2010
2001
Age Structure And Marital Status
Age- sex structure is one of the most important characteristics of population composition. Almost all population characteristics vary significantly with age. Age statistics form an important component of population analysis, as most of the analysis is based on age-sex structure of the population. The usefulness of age data is more noticeable when it is cross classified by variables like marital status, literacy educational attainment, economic activity which vary with age in different patterns.
Apart from purely demographic concerns, the age- sex data structure is required for age specific analysis of data for planning, scientific, technical and commercial purposes. The dependency ratio, which is the ratio of economically active to economically inactive persons, is dependent on age composition.
India has one of the largest proportions of population in the younger age groups in the world. 35.3% of the population of the country has been in the age group 0-14 years at the Census 2001. 41% of the population account for less than 18 years of age.
Census 2001 data on marital status of persons show that out of over a billion population of the country, 513 million (49.8%) have reported ad ‘Never married’, mainly due to high proportion of young people. The ‘Married’ constitute about 45.6% of the total population.
POPULATION IN DIFFERENT AGE GROUPS AND THEIR PROPORTIONS TO TOTAL POPULATION
| Age group | Population | Percentage |
| All Ages | 1,028,610,328 | 100.0 |
| 0 - 4 | 110,447,164 | 10.7 |
| 5 - 9 | 128,316,790 | 12.5 |
| 10 - 14 | 124,846,858 | 12.1 |
| 15- 19 | 100,215,890 | 9.7 |
| 20 - 24 | 89,764,132 | 8.7 |
| 25 - 44 | 284,008,819 | 27.6 |
| 45 - 64 | 139,166,661 | 13.5 |
| 65 - 79 | 41,066,824 | 4.0 |
| 80+ | 8,038,718 | 0.8 |
| Less Than 18 | 422,808,543 | 41.1 |
| Less than 21 | 492,193,906 | 47.9 |
| Age no stated | 2,738,472 | 0.3 |
| Source : C2 and C14 Table, India, Census of India 2001. |
The number ‘Widowed’ persons, mostly females, are more than 44 million in the country. In the age group 15-49 years, the prime child bearing age group, 81.4% of the women are married. This percentage is high due to lower female age at marriage in many parts of the country.
POPULATION BY MARITAL STATUS AND SEX: INDIA – 2001
| MARITAL STATUS | NUMBER OF PERSONS (IN '000) | NUMBER OF PERSONS (IN '000) | NUMBER OF PERSONS (IN '000) | PERCENTAGE | PERCENTAGE |
| ...... | Persons | Males | Females | Males | Females |
| Total | 1,028,610 | 532,157 | 496,454 | 100 | 100 |
| Never Married | 512,668 | 289,619 | 223,048 | 49.8 | 54.4 |
| Married | 468,593 | 231,820 | 236,773 | 45.6 | 43.6 |
| Widowed | 44,019 | 9,729 | 34,290 | 4.3 | 1.8 |
| Divorced / Separated | 3,331 | 988 | 2,343 | 0.3 | 0.2 |
| Source : C2 and C14 Table, India, Census of India 2001 |
The following graph present the percentage of males and females to total males and females by their marital status in India as per Census 2001. As per Census 2001, the mean age at marriage for females, who married in the last five years, has been 23.5 years in the country. Among females the mean age at marriage varied from 17.8 years (Rajsthan) to 24.0 years (Goa), while among males it varied from 20.5 years (Rajsthan) to 28.2 years (Goa).
2001> 2011
Population Density (Per Sq. Km.)
| Area Name | Population density | (Persons per sq km) |
|---|---|---|
| 2001 | 2011 | |
| India | 325 | 382 |
| STATES | .... | .... |
| Andhra Pradesh # | 277 | 308 |
| Arunachal Pradesh | 13 | 17 |
| Assam | 340 | 397 |
| Bihar | 881 | 1,102 |
| Chhattisgarh | 154 | 189 |
| Goa | 364 | 394 |
| Gujarat | 258 | 308 |
| Haryana | 478 | 573 |
| Himachal Pradesh | 109 | 123 |
| Jammu & Kashmir | 100 | 124 |
| Jharkhand | 338 | 414 |
| Karnataka | 276 | 319 |
| Kerala | 819 | 859 |
| Madhya Pradesh | 196 | 236 |
| Maharashtra | 315 | 365 |
| Manipur | 97 | 122 |
| Meghalaya | 103 | 132 |
| Mizoram | 42 | 52 |
| Nagaland | 120 | 119 |
| Odisha | 236 | 269 |
| Punjab | 484 | 550 |
| Rajasthan | 165 | 201 |
| Sikkim | 76 | 86 |
| Tamil Nadu | 480 | 555 |
| Tripura | 305 | 350 |
| Uttar Pradesh | 690 | 828 |
| Uttarakhand | 159 | 189 |
| West Bengal | 903 | 1,029 |
| UNION TERRITORIES | .... | .... |
| Andaman & Nicobar Islands | 43 | 46 |
| Chandigarh | 7,900 | 9,252 |
| Dadra & Nagar Haveli | 449 | 698 |
| Daman & Diu | 1,413 | 2,169 |
| Delhi | 9,340 | 11,297 |
| Lakshadweep | 1,895 | 2,013 |
| Puducherry | 2,034 | 2,598 |
2011
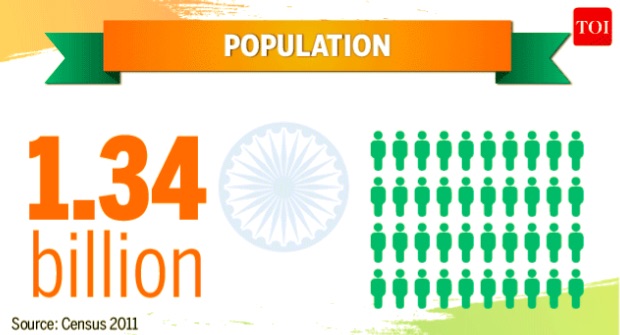
See graphic:
Population, as in 2011
Projected population of Indian states, India: 2011-2101
February 2, 2018: The Times of India
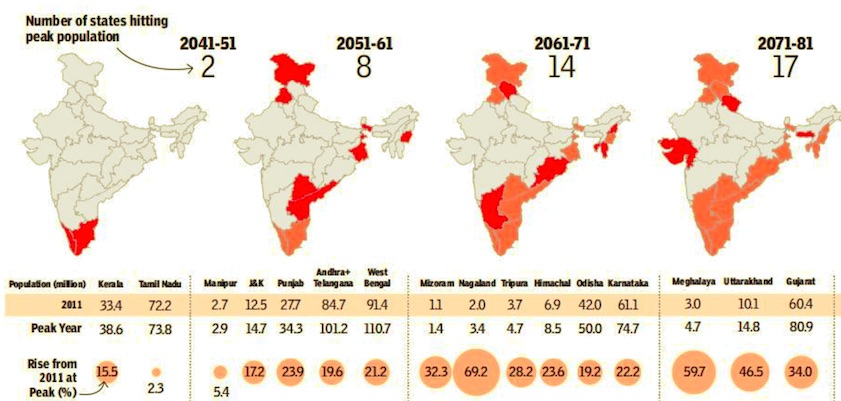
From: February 2, 2018: The Times of India
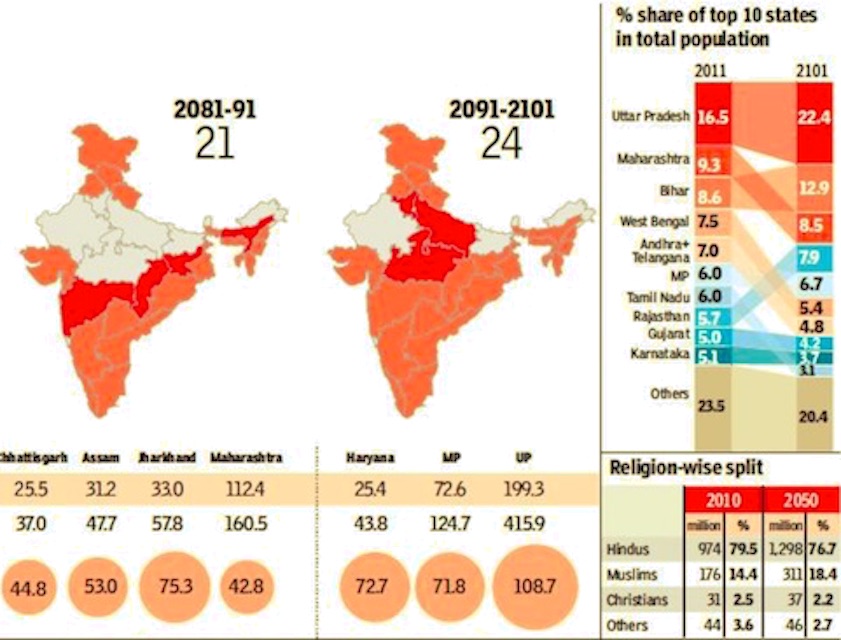
i) of Indian states and India as a whole in 2081 -2101;
ii) the share of the three principal religions of India in the country’s population in 2050; and
iii) % share of top 10 states in total population in 2011 and 2101
From: February 2, 2018: The Times of India
See graphics:
1. Projected population of Indian states and India as a whole- 2011-81
2. Projected population
i) of Indian states and India as a whole in 2081 -2101;
ii) the share of the three principal religions of India in the country’s population in 2050; and
iii) % share of top 10 states in total population in 2011 and 2101
The 1.89 billionth Indian will never be born. India’s population is expected to peak at 1.88 billion 63 years from now. But some states will start shrinking much before that. Kerala and Tamil Nadu will reach their peak in just two decades. At the other end of the spectrum are states such as Bihar, which won’t start shrinking even by 2101, the last year for which we studied the population projection
2016: India vis-à-vis other countries
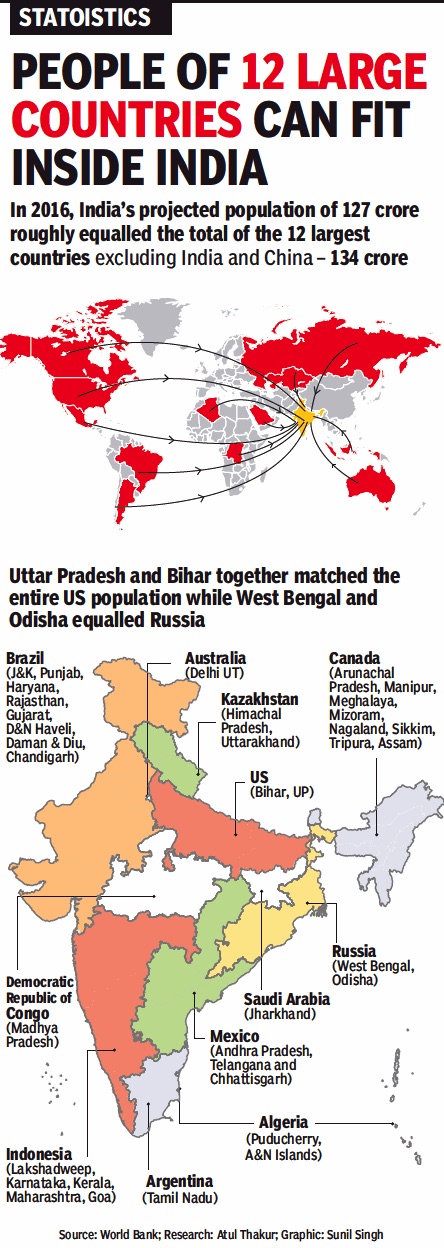
How the population of Indian states compares with that of other countries
From: April 24, 2018: The Times of India
See graphic:
The population of India vis-à-vis that of 12 major countries;
How the population of Indian states compares with that of other countries
India’s least and most populous vis-à-vis US states
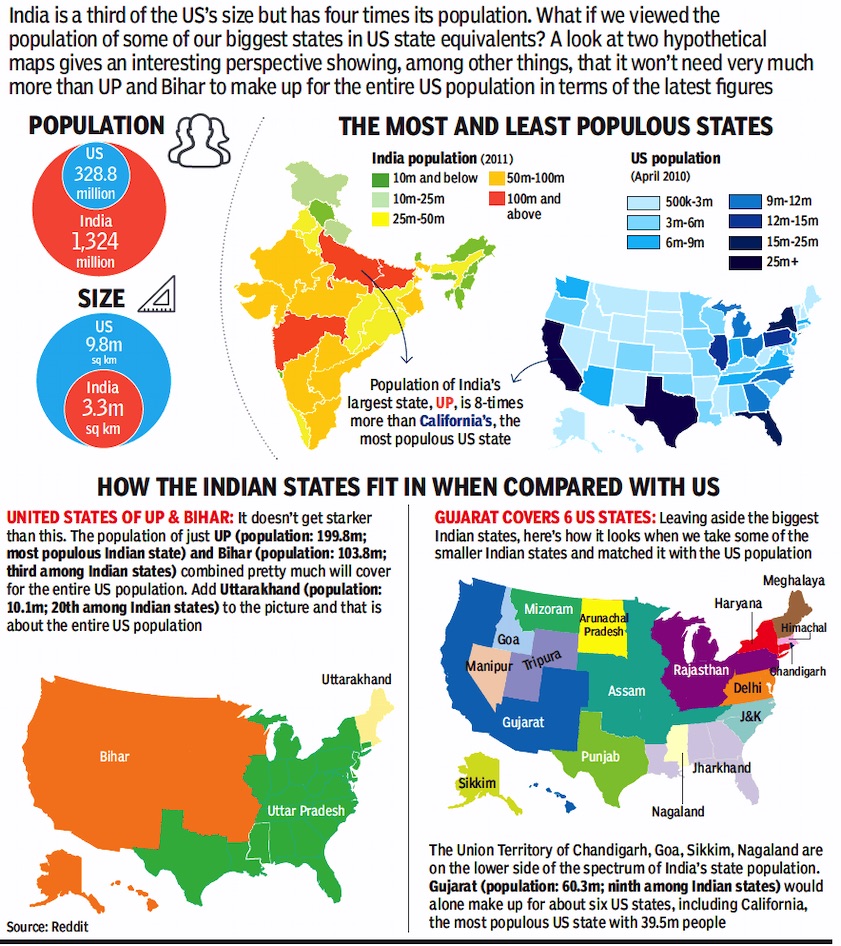
From: November 2, 2018: The Times of India
See graphic:
2011: The population of India’s least and most populous vis-à-vis states in the USA
2022
UN estimates
Esha Roy , Anuradha Mascarenhas, April 20, 2023: The Indian Express
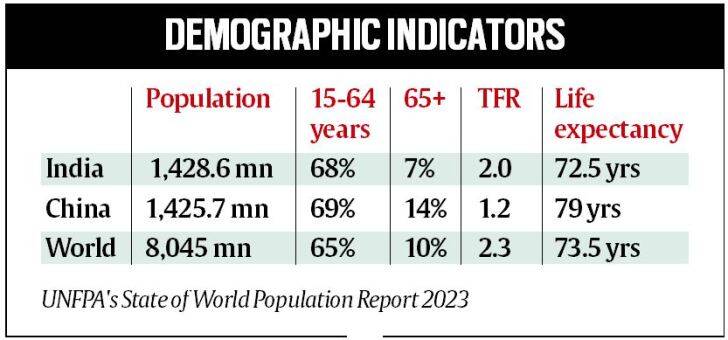
From: Esha Roy , Anuradha Mascarenhas, April 20, 2023: The Indian Express
The latest report also shows that India's total fertility rate (births per woman in the reproductive age) is estimated at 2.0.
With its population estimated to touch 142.86 crore by the middle of this year, marginally ahead of China at 142.57 crore, India is on track to be the world’s most populous country, according to the UNFPA’s State of World Population Report 2023.
According to the report, 68 per cent of India’s total population is between the ages of 15 and 64 years, which is considered the working population of a country. About 25 per cent is between 0-14 years; 18 per cent between 10 and 19 years, 26 percent between 10 and 24 years, and 7 per cent above 65 years. Last year, China remained the most populous country with an estimated 144.8 crore people while India’s population was estimated at 140.6 crore.
Another UN Report, World Population Prospects 2022, that was released in July last year, had said that by 2050, India’s population would reach 166.8 crore, far exceeding China’s declining population at 131.7 crore. In 1950, India was at 86.1 crore, while China was at 114.4 crore. According to the UN projections, India’s population is expected to grow for the next three decades after which it will begin declining.
While the global population touched 8 billion last November, the new UNFPA report said it is growing at its slowest rate since 1950, having fallen under 1 per cent in 2020. According to the report, the estimated global population is 8,045 million, of which 65 per cent is between 15-64 years, 24 per cent between 10-24 years, and 10 per cent above 65 years.
Key India insights
According to the report, the average life expectancy at birth for males in India is 71 years while for females it is 74 years. India’s total fertility rate (births per woman in the reproductive age) is estimated at 2.0.
The report indicates that population anxieties are widespread and governments are increasingly adopting policies aimed at raising, lowering or maintaining fertility rates. Addressing a virtual press conference ahead of the release of the report, Dr Natalia Kanem, Executive Director, UNFPA, said: “But efforts to influence fertility rates are very often ineffective and can erode women’s rights. Women’s bodies should not be held captive to population targets.”
“To build thriving and inclusive societies, regardless of population size, we must radically rethink how we talk about and plan for population change,” she said. “Instead of asking how fast people are reproducing, leaders should ask whether individuals, especially women, are able to freely make their own reproductive choices – a question whose answer, too often, is no,” Kanem said.
As part of the report, a public survey was commissioned by UNFPA and conducted by YouGov, that asked a representative sample of 7,797 people across eight countries – India, Brazil, Egypt, France, Hungary, Japan, Nigeria, and the United States – for their views on population issues.
For India, the total sample size was 1,007 and the survey was carried out online. The analysis has been weighted and is representative of a national urban sample of adults in India (aged 18+).
On identifying population-related matters of greatest importance, 63 per cent of Indians identified economic issues as the top concerns. This was followed by environmental concerns at 46 per cent, and sexual and reproductive health and rights, and human rights concerns at 30 per cent.
The respondents held that India’s population was too large and fertility rates too high. There was no significant difference between the views of men and women on national fertility rates.
The Indian survey findings also suggested that population anxieties have seeped into large portions of the general public.
While there is an increase in absolute numbers, the proportion of young people, which was over 30 per cent of the population in the 2011 Census, is expected to fall to 26.5 per cent, according to the UN’s 2022 projections.
“India outstripping China is no surprise and has been anticipated for some time now. But what has expedited the process is the fact that China’s growth has been slowing. Earlier this year, the National Bureau of Statistics (NBS) in China reported that it had 850,000 fewer people in 2022 than the previous year,’’ Poonam Muttreja, Executive Director, Population Foundation of India.
“What is significant is that India is in a unique position in which the young and working population is larger than the population which needs care (children and the elderly), unlike countries such as Japan with a declining population and an increasing elderly population. Such countries are, and will be, in dire need of skilled labour, and this is something that India can provide, capitalising on our demographic dividend,” said Muttreja.
Projections
2020-2100
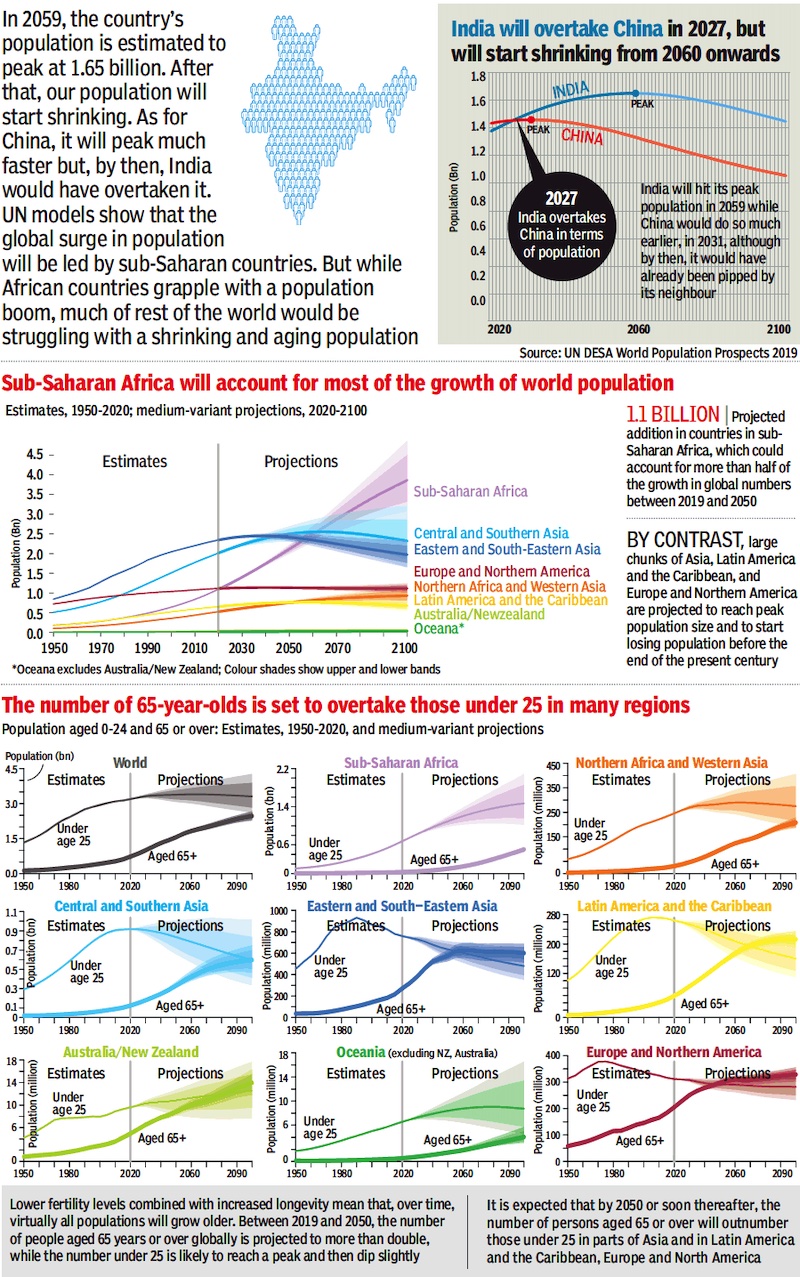
From: June 19, 2019: The Times of India
See graphic:
India will overtake China in 2027, but start to shrink from 2060 onwards; Estimates, 1950- 2020; medium- variant projections, 2020-2100
See also
The population of India: changes, 1901- onwards
