South Asia: Economy
This is a collection of articles archived for the excellence of their content. Readers will be able to edit existing articles and post new articles directly |
Contents |
Economic Reform and Trade Performance in South Asia
REVIEWS: Tricks of the trade
Reviewed by Dr Mahnaz Fatima
The authors of the book under review attempt to gauge the outcomes of trade and investment liberalisation measures undertaken in the ’90s in South Asia. There are six chapters with the first one giving an overview. The remaining five are country-specific case studies on Bangladesh, India, Pakistan, Nepal, and Sri Lanka. Trade performance outcomes are also assessed against the backdrop of the impact of trade on income inequalities and poverty, although only in the case of Bangladesh.
Trade liberalisation measures have resulted in varied performance across key South Asian countries. Trade can affect employment and poverty only if the net impact is favourable on labour-intensive industries. In the case of Bangladesh, the growth performance was impressive during the ’90s, especially during the second half of the decade when it rose to 5.2 per cent per annum. However, the per capita income remained low at $370 as compared to the South Asian average of $440. Three liberalisation scenarios were drawn up for Bangladesh which were government-revenue neutral as tariff reduction was compensated for by taxation — direct or indirect. Income inequality worsened in all three cases, however less, so in the case of the direct taxation scenario gains of beneficiary segments are taxed away partially if not fully.
The high-income urban dwellers gained the most from liberalisation with selective indirect taxation. The incidence of poverty reduction is favourable only in the case of the direct taxation scenario. Supporters of liberalisation are qualified professionals as they gain the most from it. These comprise the pro-liberalisation reform lobby in all countries regardless of the impact on low-income segments.
Having said that, liberalisation significantly affected the external sector in Bangladesh whose economy is now more integrated with the global economy. Exports increased by seven percentage points during the ’90s and imports increased by six percentage points. The current account deficit lowered and the share of foreign trade in GDP increased from 17 per cent to 29 per cent during the same period. However, this was achieved through extreme product specialisation which has raised vulnerability. The overall budget deficit expanded by 0.6 percentage points during the ’90s. This indicates that increase in trade through duty reduction was not compensated by commensurate taxation measures for revenue generation despite higher rates of economic growth which was also not shared equitably as mentioned above.
For India, trade liberalisation in 1991 was a paradigm shift from its planned economy. Indian economic reforms began with an emphasis on the external sector. It began with an initial devaluation, partial removal of the import licensing system, and reduction in some tariff rates and graduated to full convertibility of the Indian rupee on the current account, partial convertibility on the capital account, and removal of the quantitative restriction (QR) regime.
Openness of the Indian economy increased by over eight percentage points during the ‘90s as tariff barriers came down. However, global competitiveness did not improve significantly for India’s trade performance rank improved by 2/3 points as compared to China whose rank improved by 21 and 27 points on exports and imports respectively during the same period. Also, India’s exports to the GDP ratio tapered off after mid-’90s till the end of the decade. Sri Lanka had a similar experience. Similarly, the Indian FDI shows mixed trends especially after 1997/98. While the impact of Indian liberalisation reforms has been mixed, especially on exports and foreign direct investment, it was the share of technology and knowledge-intensive exports that increased whereas the share of labour-intensive exports to total exports decreased. So even though the Indian experience has been in line with global trends, it could not have had a favourable distributional impact within the country.
While the impact of Indian trade reforms on employment, inequality and poverty is not determined, the future of Indian trade reforms depends upon their welfare impact and its equitous distribution among the various segments of society. Thereby, the political-economic determinants of trade reforms also gain salience.
India and Sri Lanka will both need to determine why their exports growth tapered off in the mid ’90s. Equally important is it for India to determine whether to focus on labour-intensive exports or technology and knowledge-intensive exports. That is, the crucial question here is whether to improve upon welfare through labour-intensive exports or to gain global market share through knowledge-intensive exports. India may decide upon a blend of the two. However, it is important to note that even though India opened up, its international competitiveness improved only marginally and the welfare impact is not determined. So should liberalisation reforms aim at more openness for its own sake or on global integration for the sake of greater national integration and welfare of the people?
The case study on Pakistan gives an accurate summary of the country’s trade and investment policy reforms. Despite comprehensive reforms, the pattern of trade is characterised by instability during the ’90s. The major determinants of demand for Pakistan’s exports are found to be incomes of trading partners and real exchange rates. The benefits of trade reforms were very limited for Pakistan even in terms of trade and investment performance. The impact of liberalisation reforms on inequality and poverty in Pakistan is, therefore, besides the point.
Landlocked Nepal is also dependent on trade with India and the Sri Lankan security situation is a major determinant of its economic performance. As for the other three countries, the issues of employment and poverty remain even if exports are favourably affected due to liberalisation reforms, for improved trade performance should be a means to societal welfare and not an end in itself. The latter view is pushed by the upwardly mobile urban dwellers who benefit disproportionately more from trade liberalisation. Trade gains, therefore, need to be viewed contextually before pronouncing them as an unqualified success.
Economic Reform and Trade Performance in South Asia
Edited by Omar Haider Chowdhury and Willem Van der Geest
The University Press Limited, Dhaka.
Available with Oxford University Press, Plot # 38, Sector 15,
Korangi Industrial Area, Karachi.
Tel: 111-693-673.
Email: ouppak@theoffice.net
Website: www.oup.com.pk
ISBN 984-05-1731-7
SARTTAC/ South Asia Training and Technical Assistance Centre
SARTTAC is a collaborative venture between the IMF, the member countries (Bangladesh, Bhutan, India, Maldives, Nepal, and Sri Lanka) , and development partners.
The Center aims at helping its member countries strengthen their institutional and human capacity to design and implement macroeconomic and financial policies that promote growth and reduce poverty in a rapidly growing region that is home to one fifth of the world’s population.
SARTTAC will allow the IMF to meet more of the high demand for technical assistance and training from the region
The IMF’s South Asia Training and Technical Assistance Center (SARTTAC) was officially inaugurated by Secretary Shaktikanta Das of India’s Ministry of Finance in New Delhi on February 13, 2017. Deputy Managing Director Carla Grasso and senior officials from the center’s six South Asian member countries (Bangladesh, Bhutan, India, Maldives, Nepal, and Sri Lanka) and development partners attended the event. Less than a year after IMF Managing Director Christine Lagarde and the Finance Minister of India, Arun Jaitley, signed a Memorandum of Understanding to establish a capacity development center for South Asia, the opening of SARTTAC marks a major milestone in the partnership between the IMF and its member countries in the region.
SARTTAC is a collaborative venture between the IMF, the member countries, and development partners. The center’s strategic goal is to help its member countries strengthen their institutional and human capacity to design and implement macroeconomic and financial policies that promote growth and reduce poverty.
South Asia is a rapidly growing region that is home to one fifth of the world’s population. SARTTAC will allow the IMF to meet more of the high demand for technical assistance and training from the region. Through its team of international resident experts, SARTTAC is expected to become the focal point for the delivery of IMF capacity development services to South Asia.
SARTTAC, the newest addition to the IMF’s global network of fourteen regional centers, is a new kind of capacity development institution, fully integrating customized hands-on training with targeted technical advice in a range of macroeconomic and financial areas, and generating synergies between the two. SARTTAC is located in world class facilities in New Delhi and is financed mainly by its six member countries — Bangladesh, Bhutan, India, Maldives, Nepal, and Sri Lanka — with additional support from Australia, the Republic of Korea, the European Union and the United Kingdom.
Deputy Managing Director Grasso made the following statement: “I am very appreciative of the strong partnerships and determined efforts of so many that have paved the way for SARTTAC’s opening. I am confident that the center will make a very strong contribution to capacity building in South Asia, which is so important for sustainable economic development, growth, and stability.”
Secretary Shaktikanta Das said: “SARTTAC is a pioneering initiative of the Government of India and the IMF. This is the IMF’s first fully integrated capacity development center, which brings together under one roof the two building blocks of capacity development — training and technical assistance. I am sure the center will build on this unique advantage, and over time will evolve as a model for others to emulate.”
Background:
A global network of fourteen regional technical assistance and training centers anchor IMF support for economic institution building and are complemented by global thematic funds for capacity development. They are financed jointly by the IMF, external development partners, and member countries.
COMPARISONS/ YEAR-WISE STATISTICS
1990-2020
October 16, 2020: The Times of India

From: October 16, 2020: The Times of India
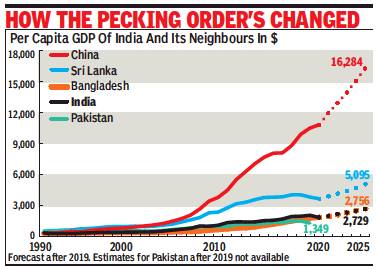
Full circle: B’desh had topped India’s per capita GDP in ’90s
₹ Devaluation Had Reduced Indian Figure In $ Terms
The IMF has projected that Bangladesh’s per capita GDP in 2020 will be higher than India’s in dollar terms, but this is not the first time it would happen. Nearly three decades ago, Bangladesh had a higher dollar per capita GDP for three years running — 1991, 1992 and 1993.
The reason then was a sharp decline in India’s per capita GDP in dollar terms thanks to the devaluation of the rupee starting July 1991. In 1990, the dollar averaged Rs 17.5, for 1991 it was up to Rs 22.7, and by 1993 had risen to Rs 33.4. As a result, India’s per capita GDP fell from $374 in 1990 to $306 in 1993 despite rising in rupee terms. Bangladesh’s per capita GDP in the meantime had remained almost static at $324 in 1990 and $322 in 1993.
Since then, however, India’s per capita GDP has consistently been higher and just a decade ago was more than 80% higher — $1,384 compared to $763 in 2010. Over the last decade, that gap has been rapidly closed and in 2019, India’s per capita GDP of $2,098 was only 16% higher than Bangladesh’s $1,816. In 2020, the IMF estimates that India’s number will shrink by 10.5% due to the effect of the shutdown of the economy in the aftermath of Covid-19 while Bangladesh’s will rise by about 4%, enough for it to just inch ahead. Beyond the India-Bangladesh comparisons, these 30 years have seen dramatic changes in the pecking order in India’s neighbourhood when it comes to per capita GDP in dollar terms.
GDP: B’desh may not be a flash in the pan
In 1990, China had a lower figure than India, though not by much, while Pakistan’s per capita GDP at $495 was about 33% higher than India’s $374. Today, China’s $10,838 as estimated by the IMF is nearly six times India’s $1,877. The IMF has no estimate for Pakistan for 2020, but its 2019 number was 36% lower than India’s. Sri Lanka and Bhutan continue to have much higher per capita GDP than India while Nepal and Myanmar have lower figures. Myanmar, however, has been rapidly catching up. In 1998, the earliest year during these three decades for which the IMF has an estimate for Myanmar, the country’s per capita GDP was barely 28% of India’s. In 2020, its number would be 71% the Indian level. Bangladesh creeping ahead of India may not be a flash in the pan, if the IMF forecasts prove right. By those estimates, it will have lower per capita GDP between 2021 and 2023, but will equal India’s in 2024 and edge a little ahead in 2025.

