Energy: India
What Is the Difference Between Power and Energy? Experts at QUEST explain:
The word “energy” is used to describe many different things—how we heat and cool our homes, how we fuel cars. Energy isn’t something that can be seen or felt, but you can see and feel the effects when energy is transferred from one place to another.
Energy is what makes change happen and can be transferred form one object to another. Energy can also be transformed from one form to another.
Power is the rate at which energy is transferred. It is not energy but is often confused with energy. The watt is the most commonly used unit of measure for power. It measures the rate of energy transfer.
A watt equals a joule per second. If a smart phone uses five joules of energy every second, then the power of the phone is five joules per second, or five watts.
Indpaedia has separate pages on
Energy: India and
Power: India, 1/ Power: India, 2 (ministry data)
This article has been sourced from an authoritative, official readers who wish to update or add further details can do so on a ‘Part II’ of this article. |
A
An overview
1950-2023

Generation
Consumption
Transmission
Sources of energy
Green energy
From: Oct 14, 2025: The Times of India
See graphic:
1950-2023: An overview of the energy sector in India:
Generation
Consumption
Transmission
Sources of energy
Green energy
Some statistics

The graphics are arranged on the right side of this page
B
Ministry data: 2012
The source of this article


INDIA 2012
A REFERENCE ANNUAL
Compiled by
RESEARCH, REFERENCE AND TRAINING DIVISION
PUBLICATIONS DIVISION
MINISTRY OF INFORMATION AND BROADCASTING
GOVERNMENT OF INDIA
Significance
ENERGY is an essential input for economic development and improving the quality of life. Development of conventional forms of energy for meeting the growing energy needs of society at a reasonable cost is the responsibility of the Government. Development and promotion of non-conventional/alternate/new and renewable sources of energy such as solar, wind and bio-energy, etc., are also getting sustained attention. Nuclear energy development is being geared up to contribute significantly to the overall energy availability in the country.
C
Updates after 2012
Diesel generators
Jan 02 2015
Sanjay Dutta
Diesel gensets lose power as reforms start paying off
Diesel-fired gensets appear to be losing power as the mainstay of energy for commercial establishments and other large consumers as the Centre's thrust on raising generation capacity and other reforms in the last few years begin to pay off by way of improved supply from the mains. The average running period for DG sets of all sizes has dropped to 500 hours in a year from 3,942 hours in 201011, a power ministry note says, quoting two separate reports prepared by Petroleum Conservation and Research Association and Bureau of Energy Efficiency .
In terms of average perday operation, gensets are being run for an average 1.37 hours against an average 10.8 hours operated some twothree years back.
This by no means is an end of the road for diesel gensets, which have recorded a growth of roughly 10% in annual sales. “Even though the number of DG sets have grown over the last two years... Basically, the DG sets are being used (installed) as stand-by source of supply ,“ says the note.
The note, thus, gives an in dication of shape of things to come against the backdrop of the Modi government taking steps to ensure 24X7 power supply in the next two-three years.
There are an estimated 24 lakh diesel gensets operating across the country , up from 20 lakh pegged around 2010-11.The report reckons the aggregate capacity of gensets of all sizes operating in the country by the end of 2012-13 to be 105,512 mw. This is roughly 20 times more than Delhi's daily demand for power. Gensets are known as a major contributor to pollution and a fall in their running hours has a positive bearing on the environment.
Conservation of energy
LED bulbs
2016: Ujala makes India world leader
The Times of India, Apr 21 2016
India headed for top slot in global LED light market
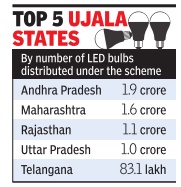
Sanjay Dutta India is poised to emerge as the largest market for lighting systems based on LEDs (light-emitting diodes), thanks to the Narendra Modiled government's UJALA (Unnat Jyoti by Affordable LEDs for All) scheme for replacing all inefficient bulbs with these energy-efficient lamps. “With India selling 770 million LED bulbs every day , the country will soon become the LED capital of the world. Prices of LED bulbs have come down to 55 pence (Rs 52) from over 3.5 pounds (Rs 332) two years ago,“ a government statement quoted power minister Piyush Goyal as telling investors in London on Wednesday . Today , 12% of all LED lighting systems sold in the world is consumed in India, according to Saurabh Kumar, managing director of Energy Efficiency Services. The company , promoted by state-run power utilities, is the nodal agency for implementing the UJALA scheme.
UJALA has brought down the price of an LED bulb to Rs 85 for a 9-watt on an average.
2017: the result of the LED initiative
Modi's LED street lights shine bright, April 29, 2017: The Times of India

21L Conventional Lights Replaced with LED Lamps
More than 21 lakh conventional street lights with high power consumption have been replaced with LED (light emitting diode) lamps across the country so far as civic bodies seek to make the most of falling costs of these energy efficient lighting equipment.
Rajasthan has replaced the highest number of conventional lights under the power ministry's Street Lighting National Programme which is being implemented in 23 states. Some 1.34 crore conventional street lights are to be replaced under the programme.
The total saving from replacements so far is estimated at 295 million units in terms of energy and over 73 mw in terms of generation capacity avoided. In terms of the environment, the replacements are estimated to have reduced carbon dioxide emissions by 2.3 lakh ton nes, according to Energy Efficiency Services Ltd (EESL), the energy saving company under the power ministry that is implementing the replacement project. The programme is progressing on the back of procurement price of LED street lights coming down from Rs 135 per watt to Rs 80 per watt owing to mass procurement of the lights.
EESL makes the entire upfront investment in installation of the street lights and no additional budget allocation from the municipalities is required.
The civic bodies pay EESL from the savings in energy and maintenance cost over a seven-year period, making the LED lights affordable and accessible.
EESL's procurements carry a seven-year warranty against technical defects.The company conducts quality checks right from the bidding stage to the field level. This has resulted in the LEDs' overall technical fault being less than 1% in the 21 lakh lights installed by EESL in the country .
“LED street lights will be consuming up to 60% less energy . The bright lights will lead to safer roads for pedestrians and motorists. Additionally , EESL also plans to install three million LED street lights in the current financial year,“ a company statement quoted MD Saurabh Kumar as saying.
EESL is also implementing a special heritage lighting project, wherein 1,000 LED street lights have been installed in Kashi region of Uttar Pradesh and another 4,000 are being installed.
Challenges ahead in energy conservation
Sanjay Dutta, India muscles its way into high energy table, Mar 31, 2017, The Times of India
HIGHLIGHTS
India is home to about a fifth of the world's population but uses only about 6% of the world’s energy.
Govt’s plans to make modern fuel and quality power accessible are expected to drive India’s hunger for energy.
Ujjwala has already made India the world’s second-largest LPG consumer in the domestic sector.
India is home to about a fifth of the world's population but uses only about 6% of the world's energy. But the government's plans to make modern fuel and quality power accessible and affordable for the vast population, combined with the 'Make in India' initiative, are expected to drive India's hunger for energy. The growth in India's energy demand is expected to outpace China in the next few years.
Rural electrification and Ujjwala played a crucial role in fuelling BJP's rise in UP and will play an important part in stoking the country's hunger for energy. Ujjwala has already made India the world's second-largest LPG consumer in the domestic sector and expanded LPG coverage to 71% of population.
Fielding of the two young ministers is, thus, being seen as a clear signal from the Modi government that India cannot be ignored any longer and must be heard by the global energy market as the voice of developing economies. A fact duly acknowledged by IEA executive director Fatih Birol, when he said, "We can't talk about the future of the global energy markets without talking with India".
India has so far been a partner country. The 'associate' status will make India part of all meetings and dialogues, allowing an opportunity for it to shape relationships in the global energy market. China, the world's second-largest oil consumer, has been an associate member since 2015.
"IEA Association will not entail any additional burden or commitment on the government or people of India. It will help India plan better and serve the needs of Indians better, ensuring energy security for days and years to come," Goyal said.
"IEA has helped in promoting understanding of India's interests and concerns as the third-largest consumer of energy," Pradhan said urging IEA to anchor dialogue between oil sellers and buyers for evolving a balanced market.
Consumption, energy
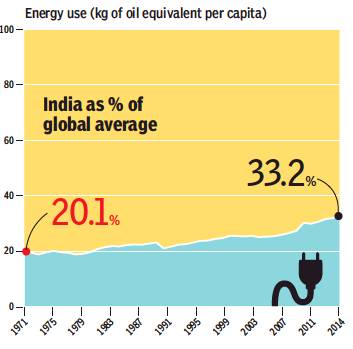
Per person energy consumption, 1971-2014
June 18, 2019: The Times of India
From: June 18, 2019: The Times of India
See graphic:
Per person energy consumption in India, 1971-2014
You can be sure a country is growing richer when its people start consuming more energy. Back in the 1960s, when India depended on farming, its per person energy consumption was 20% of the world average. As manufacturing and services became important, it grew to 33%. Bharat Petroleum estimates India’s share of world energy consumption will rise from 5.6% in 2013 to 11% in 2040
India's total energy mix: 1991-2017
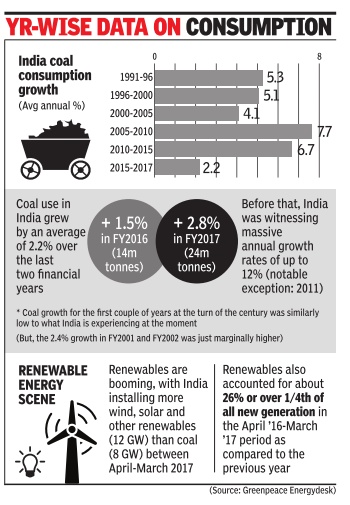
See graphic:: India coal consumption growth, 1991-2017
Boom In the Renewable Sector: Report
Coal will continue to have a prime place in India's total energy mix for the next many years but data shows that the country's coal boom may have been over a couple of years ago, much earlier than expected.
Over the past two years, the country's coal use has increased by an average of just 2.2%, a sharp fall from the previous 10 years when average annual growth was over 6%.
The findings, published by Greenpeace's Energydesk on Wednesday , are significant because India, the world's third largest CO2 emitter after China and the US, is seen as the next big coal frontier. Though the country's per capita carbon emission is much less than these top two emitters, the decline in overall use of coal will help India achieve its goal under Paris climate accord. India has committed to produce 40% of its electricity from non-fossil sources of energy by 2030 under the deal.It, therefore, has planned to scale up targets for renewable energy capacity from 30GW by 2016-17 to 175 GW by 2021-22.
The report shows that the renewable sector is certainly booming in India due to increasingly cost-competitiveness of solar and wind energy installations. “India's demand for the carbon-heavy fuel is not sky-rocketing and the country's energy needs will do nothing to arrest coal's global decline,“ said Ashish Fernandes of Greenpeace energy .
The Greenpeace, however, said there were a number of new coal-based power plants in the pipeline. It said the coal industry has experienced troubles, with many plants running less than half the time due to an over-capacity crunch. It also noted that the slowdown in coal consumption growth was largely due to the cement, iron and industrial power generation sectors burning less.
2008-17: Crude oil imports; Monthly petrol consumption;Monthly diesel consumption

Monthly crude oil imports,
Monthly petrol consumption,
Monthly diesel consumption
From: April 10, 2018: The Times of India
See graphic:
2008-17-
Monthly crude oil imports,
Monthly petrol consumption,
Monthly diesel consumption
Domestic power consumption in India, 2011-14, state-wise
The Times of India Sep 22 2014
See graphic: Domestic power consumption in the various states of India

STATE OF POWER
Domestic power consumption in various states is not uniform and depends on their economic growth. The uneven electrification of households in the country is also responsible for this
2012-17: India vis-à-vis major countries

From: November 14, 2018: The Times of India
See graphic:
2012-17- Green energy in India vis-à-vis major countries
2014, India vis-à-vis China, major countries
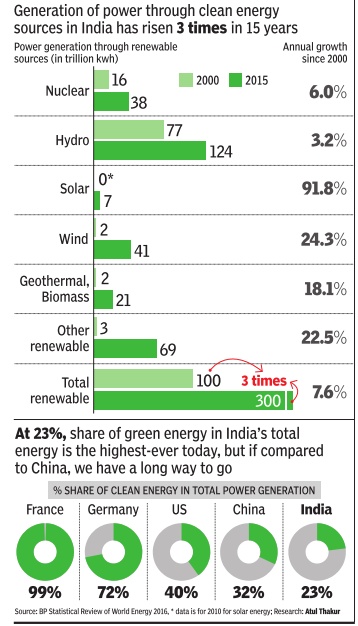
Why India's giant leap in green energy is still a small step
The Times of India Oct 20 2016 : WHY INDIA'S GIANT LEAP IN GREEN ENERGY IS STILL A SMALL STEP
See graphic:
Green energy: India vis-à-vis China and major countries
Why India's giant leap in green energy is still a small step
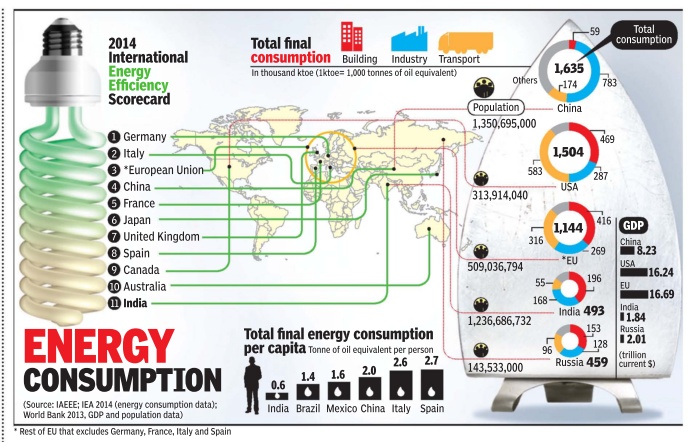
Energy consumption and energy efficiency: 2014
See graphic: Energy consumption and energy efficiency: in India, compared with other countries
The Times of India, December 07 2014
As per December,2014, India is the fourth largest energy consumer in the world, trailing the US, China, and Russia. Currently, India is not able to consistently meet domestic energy demands, which makes securing energy sources one of the top priorities and the largest energy source is coal.
Per capita consumption
2014: India a low no. 105 among 143 countries

See graphic:
Production and consumption of electricity, per capita, and a comparison with BRICS countries, 2014
Showing a significant increase in electricity generation, India is now the third highest producer in the world. Generation alone, however, is a misleading indicator of quality of life because when it comes to per capita consumption of electricity, India ranks 105 among 143 countries for which data is available
2018: Energy demand growth; sources
Source: International Energy Agency

From: Despite C02 dangers, coal still king as India's power demand soars, March 27, 2019: The Times of India

From: Despite C02 dangers, coal still king as India's power demand soars, March 27, 2019: The Times of India
On the back of a strong economy, 2018 saw a considerable increase in global energy demand. But the increased demand was matched by CO2 emissions, with India, China and US at the forefront, according to the International Energy Agency. A look at key trends in energy consumption.
In 2018, global energy consumption rose by 2.3%, which is nearly twice the average growth rate since 2010. Natural gas accounted for nearly 45% of the increase in energy demand. Nearly 70% of the energy demand growth was from burning fossil fuels. Though renewable energy grew at double-digit pace, it wasn’t enough to match energy demand.
STRONG ECONOMY DRIVING ENERGY DEMAND
The increased consumption was largely driven by economic growth and weather conditions. The global economy grew at 3.7% in 2018, highest than the 3.5% average annual growth since 2010. Weather conditions were behind 20% of the increase in energy demand. Hotter summers led to increase in cooling needs in some parts of the world, while colder winters led to an increase in heating demand.
INDIA, CHINA AND US LED THE WORLD IN ENERGY DEMAND GROWTH
China, US and India together accounted for nearly 70% of the rise in energy demand. China also had the world’s largest increase in solar and wind generation. US had the largest increase in oil and gas demand worldwide. Growth in India driven by coal for power generation and oil for transport.
There was 1.7% increase in energy related CO2 emissions in 2018 to a historic high of 33.1 giga tonnes (Gt). A whopping 85% of total emissions came from China, India and US. Two-thirds of the growth in emissions came from the power sector, particularly from coal-fired power generation.
Coal accounted for 30% of CO2 emissions in 2018. Emissions from coal crossed 10 Gtfor the first time, mostly concentrated in Asia.
ENERGY EFFICIENCY HELPING AVOID EMISSIONS
Despite overall increase, some emissions have been prevented. Switching from coal to gas, for example, helped avoid 60 million tonnes CO2 emissions that would have come from coal. A greater shift towards renewable energy in 2018 helped the world avoid 215 Mt in emissions. China and Europe led the global push for green energy. Increase efficiency of energy sources was the biggest saver in emissions, helping avoid nearly 275 Mt in emissions.
2018-23

From: April 22, 2023: The Times of India
See graphic:
Base energy demand in India: 2018-23
Policies/ The Trilemma index
2019: India, South Asia
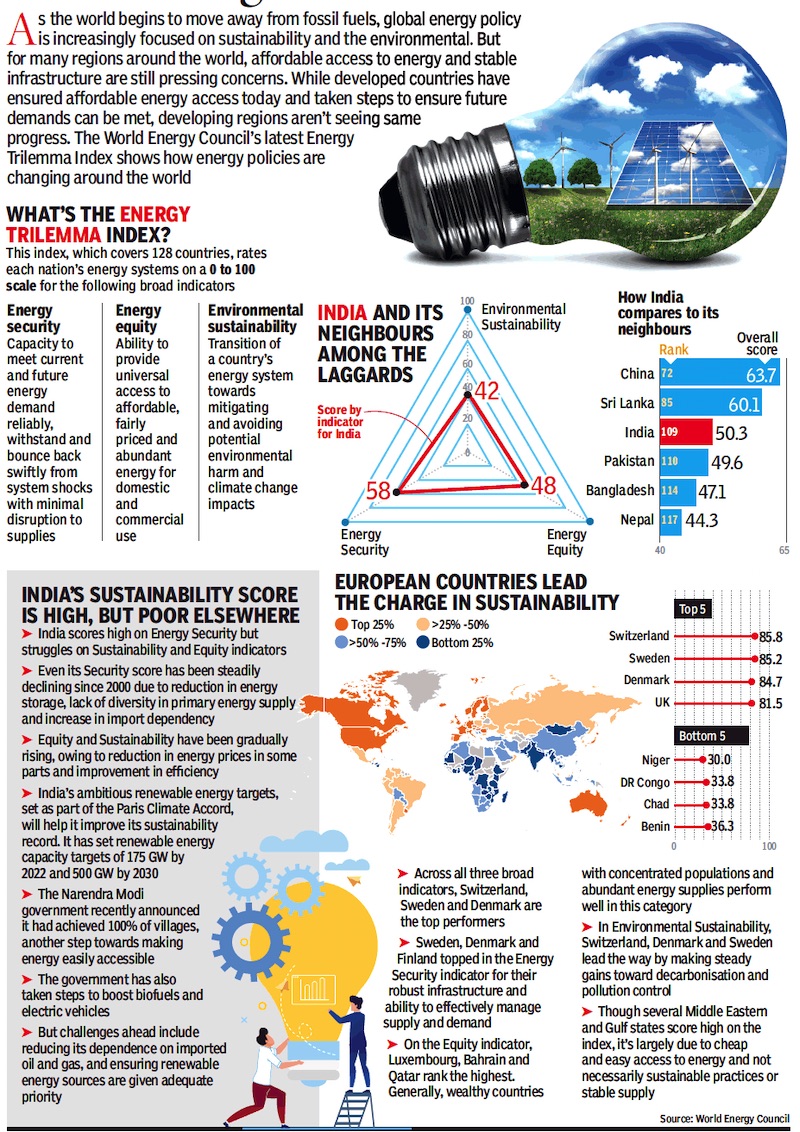
From: Oct 20, 2019: The Times of India
See graphic:
The performance of India, Bangladesh, China, Nepal, Pakistan and other selected countries on The Trilemma index/ presumably as in 2018-19.
Renewable energy in India and the world
2022

From: June 30, 2025: The Times of India
See graphic:
The percentage share of Renewable energy in India, South Asia and the world, 2022
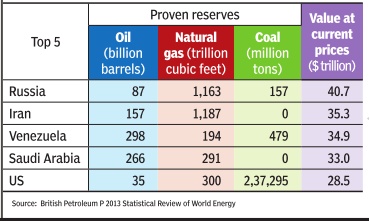
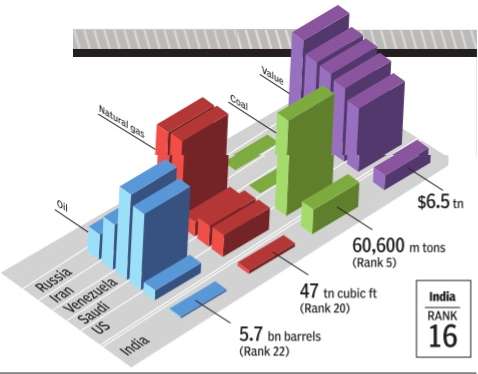
Reserves, energy
2017: Energy reserves
See graphic.

Taxation
Taxing energy use, India and the world: 2015
See graphic: India and the world: Tax rates on emissions from energy use: 2015

See also
Power: India, 2 (ministry data)
Energy: India
Green (renewable) energy: India, 1
Green (renewable) energy: India, 2 (ministry data)
