Delhi: Climate
This is a collection of articles archived for the excellence of their content. |
Contents |
Heat Islands
1972-2014
Jasjeev Gandhiok, July 3, 2021: The Times of India
From: Jasjeev Gandhiok, July 3, 2021: The Times of India
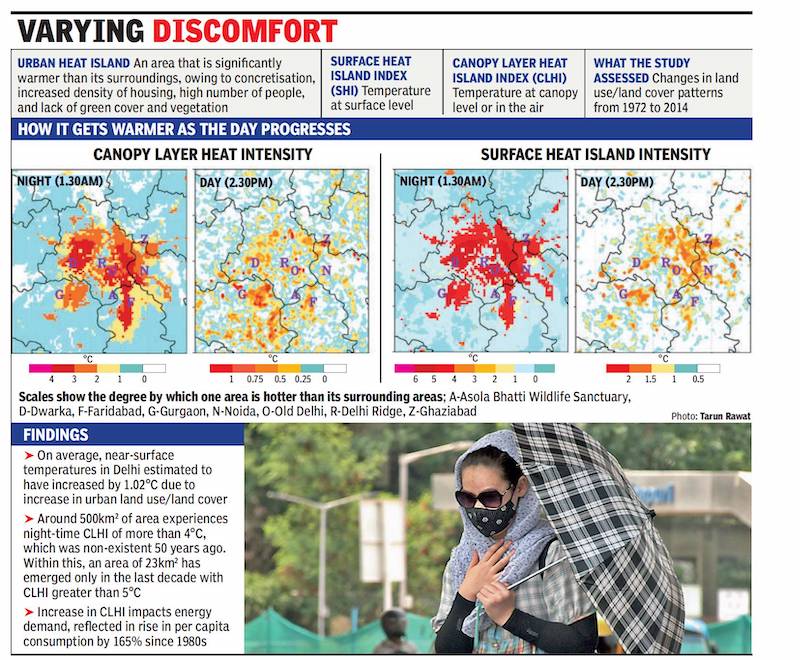
Feeling warmer than normal in some parts of Delhi-NCR compared with other areas? Might not just be the temperature or the humidity alone. It could all be down to the concretised and urbanised landscape around you. The urban heat island effect makes localities hotter than others due to factors like concretisation, population density and the density of the landuse area. A new study has found parts of the city recording an increase in the surface and canopy-level heat index of 4-6 degrees Celsius by 1.30am.
The study, conducted by the Centre for Atmospheric Sciences, IIT Delhi, analysed change in the land use and land cover pattern over the last five decades on the basis of Delhi’s maps between 1972 and 2014 to determine how urbanisation had impacted the urban heat island effect in the Central National Capital Region. The study assessed both the surface heat island intensity (SHI), measured at ground level, as well as the canopy layer heat Island intensity (CLHI), measured in the air. It found that with increasing urbanisation, around 500 square km of Delhi is now experiencing 4-6 degrees Celsius of CLHI at night, something that was non-existent in the 1970s. A dense 23 sq km of Delhi records a CLHI greater than 5 degrees Celsius.
On average, Delhi’s nearsurface temperature has also increased by 1.02 degrees Celsius due to an increase in the urban-land use from 1970 to 2010s. NCR too has seen similar changes, with increases in SHI and CLHI of 4-6 degrees Celsius during the day and 2-4 degrees Celsius at night.
The study also looked at thermal comfort and discomfort due to excess heating and determined that comfortable hours had reduced over the last five decades. “The extremely uncomfortable hours have increased from an average of 10 hours a day to 12–13 hours a day. Similarly, comfortable hours have decreased from around three hours per day to around an hour per day,” says the study, co-authored by Ankur Prabhat Sati and Shweta Bhati.
Manju Mohan, lead author of the study that was published in Urban Climate, said the increase in temperatures is maximum by 1.30am and lowest at 10.30am. “Through the day, surfaces heat up the maximum by 1.30am. In comparison, readings collected at 2:30pm showed an increase in UHI by 2-3 degrees Celsius. By 10.30am, cool night-time temperature has released the heat and makes morning ideal,” explained Mohan, who added that Gurgaon, Dwarka and Faridabad all showed high UHI readings, while locations like Delhi Ridge (north) and Asola Bhatti Wildlife Sanctuary showed little increase in both surface or CLHI at night.
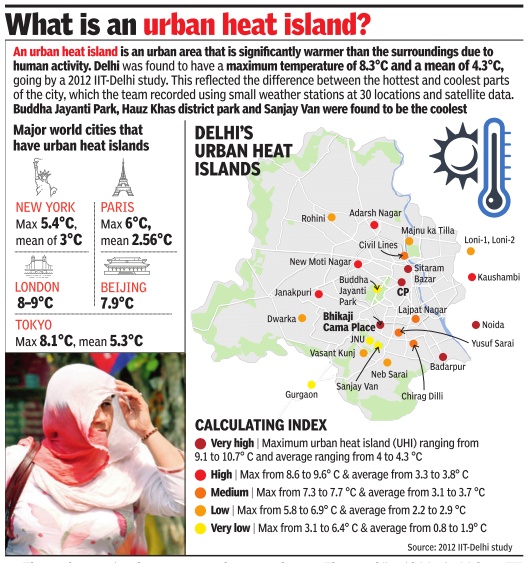
Mohan, in past studies to determine UHI in Delhi, has established locations such as Connaught Place and Sitaram Bazaar as being the hottest, with an average UHI index of over 4 degrees Celsius. JNU and Vasant Kunj had lowest UHI at 1-2 degrees Celsius.
2010-13
Delhi's Heat Islands Warmer Than Other Spots By Almost 10°C
While the summer heat is unbearable for everyone, some parts of the capital may be far warmer than the average. The difference between the coolest part of the city and one of these “heat islands“ could be as high as between 5 and 10 degrees Celsius. Several scientific studies have raised alarm bells about the impact of what they call the “urban heat island“ effect.
Now a latest study (to be published in July) by the CSIRNational Physical Laboratory (NPL) and Indian Meteorological Department (IMD) has compared the average temperature difference between Safdarjung and NPL area near Pusa road between 2010 and 2013 to compute the urban heat island (UHI) and found that Safdarjung experienced an UHI ranging from 0.2 to 3 degrees.
High UHI was observed in morning time as compared to day and night times, with the highest magnitude ranging from 2.8 to 3 degrees Celsius in spring, autumn and winter seasons at morning between 7am and 9 am. “The analysis revealed that UHI effect exists in the Safdarjung area (see graphic) due to presence of more builtup surface and relative lack of vegetation areas as compared to NPL area,“ the study stated.
The study added that a UHI of magnitude 0.2 -3 degrees is capable of rising electricity demand by of 37.87 GWh to 1,856 GWh over the base electricity supply of the city and corresponding rise in CO2 emissions would be 0.031-1.52 million tonnes. In simple terms, the energy demand could rise by as much as 6% if the UHI is 3 degrees. Similarly , Connaught Place in central Delhi is among the hottest parts of the city. The authors pointed out that the UHI effect is linked to land use. Satellite pictures show NPL has much larger area of vegetated land (66.6%) as compared to Safdarjung Bhikaji Cama Place(32.8%) while the built up area in Safdrajung is much large, 67.2%, compared to 33.4% in NPL.
IIT-Delhi's Centre for Atmospheric Sciences has done a number of studies on UHI trends in Delhi. In their 2012 study IIT-Delhi had found very high UHI in certain areas in the range of 8.6 to 10.7 degrees. The green and riverside areas had a low UHI (3.1to 6.9 degrees).
Another trend scientists are noticing is an increase in night-time temperature. “We are noticing that the difference between day time and night time temperature is reducing.During the day the solar heat is absorbed and then it takes very long to escape at night. This is because of more built up area which is trapping the heat. Satellite pictures show that more and more area is getting affec ted,“ said Manju Mohan, IITDelhi professor. AC exhausts also have a major role to play.
On average, the difference in temperature in a heat island compared to the coolest part of the city can be 4 to 5 degrees Celsius. Solutions lie in better urban planning and some immediate interventions. “Greenery to reduce anthropogenic heat, more reflective surfaces, enough space between buildings, greenery on buildings are some of the possible solutions,“ added Mohan.
Statistics, month-wise
March
2007-12, low temperatures
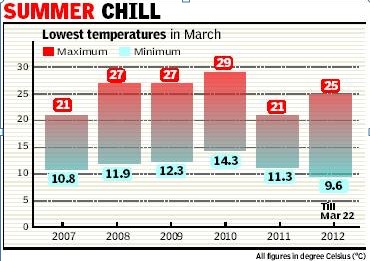
See graphic
2017, rise of 13 degrees in 10 days
HIGHLIGHTS
Delhi sees a whopping 13-degree rise in maximum temperatures in the past 10 days, with spring disappearing almost as soon as it arrived.
Wind circulation features at the moment suggest that the summer season has begun,“ said IMD spokesperson K Sathi Devi.
Such a rapid transition to summer is rather unusual.Such a rapid transition to summer is rather unusual.
NEW DELHI: Light jackets have given way to T-shirts in the span of a week as weather in the capital has transitioned unusually rapidly from late winter to summer this year. Delhi saw a whopping 13-degree rise in maximum temperatures in the past 10 days, with spring disappearing almost as soon as it arrived. Thursday's peak temperature was 37.4 degrees Celsius, seven notches above normal - the highest seen in March since 2010, when the mercury had hit 39.2 degrees on March 22. Just 10 days ago, the maximum had hovered around 24 degrees. Similarly, minimum temperatures have risen by around 9 degrees in this period. Such a rapid transition to summer is rather unusual. The change has been all too sudden also because below normal temperatures prevailed till well after Holi this year, under the influence of a series of active western disturbances that brought rain and snow in the hills. "That influence has waned. At the same time, a wind pattern has formed that's causing heating in the northern plains," said Ravinder Vishen, head of IMD's Regional Weather Forecasting Centre. Met officials said, with the summer wind patterns now in place, temperatures are expected to climb in the coming days. By next week, peak temperatures in the capital could climb close to 40 degrees Celsius.
"Wind circulation features at the moment suggest that the summer season has begun," said IMD spokesperson K Sathi Devi. The cause of the heating is an upper air zone of high pressure, called a ridge, over Rajasthan and parts of central India. "Due to this, there is a downward movement of air, which is leading to temperatures way higher than normal in northern India," said Vishen.
The heat is in line with IMD's seasonal forecast for March and April that said average temperatures may be one degree above normal in northern India. The forecast was based on IMD's computer models that take into account global features such as the current heating up of the Pacific Ocean. Being a transition month, March sees a large variation in weather patterns. Last year, for example, the month began on a very hot note. Maximum temperatures were around 31-32 degrees C. The month ended at around 37 degrees. Thus, the variation in peak temperatures was just around 6-7 degrees. In 2015, the variation was much larger - around 16-17 degrees C over the 31-day period. The previous year, 2014, showed an altogether different pattern. Maximum temperatures in the beginning of the month were around 21 degrees C while the month-end temperatures were in the 30-31 degree range.
April
2012
Neha Lalchandani
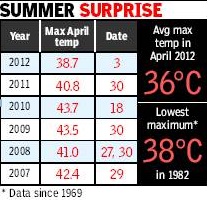
This was the coolest April in 30 years
The month’s highest temperature in 2012 — 38.7 degrees celsius on April 3 —was the lowest maximum in April since 1982, and the second lowest since 1969. A spate of fast-moving western disturbances were responsible for this freakish cool spell, say weather experts. As a result, there was not a single day when heat wave was declared in any part of northwest India during the month. If all this wasn’t unusual enough, Delhi also witnessed moderate fog on the morning of April 27, a phenomenon that has probably never occurred in the capital city this time of the year. A western disturbance is the name given to cool air currents blowing towards north India from the Mediterranean Sea, particularly in winter when these bring in snow, rain and cold winds. String of wet days kept temp down New Delhi: For the first time in 18 years, the capital witnessed a more-or-less pleasant April, with the temperature never touching 40 degrees Celsius. The average maximum temperature for the month was 35.7 degrees Celsius, against a normal average of 36 degrees. The average minimum was 21.7 degrees while the average day temperature was 28.7 degrees. Since 2007, there have been at least three years that have experienced lower average daily temperatures. These include 2007, 2011 and 2001 in which the average monthly temperature was 26.6 degrees, 28.1 degrees and 28.4 degrees, respectively. B P Yadav, director IMD, said April this year was also characterized by eight days of rain, all occuring in the last 20 days. “The first 10 days were completely dry and characterized by high temperatures. The city recorded 18.3 mm rain against a normal of 11.5 mm. This is quite unusual but in the 125 years of India’s meteorological history, we have had at least 12 such years in which April saw below 40 degrees temperatures and higher than average rainy days,” he said. Senior Met scientists attributed the unusual weather to about six western disturbances that affected northwest India in the second half of the month. “Normally WDs would have moved northwards by now and would not have affected northwest India this actively. However, so far the WDs have continued on their more southerly track and brought rain to the plains. Delhi has witnessed some amount of rain every alternate day since April 10 which has kept temperatures low this season,” said a senior scientist. Dr R K Jenamani, director in-charge IGI Met, added that the WDs also moved much faster this time, assisted as they were by strong westerly winds.
June
2012-16
See graphic
July
2015
The Times of India, Aug 01 2015
July surprise: Rain kept weather mild, air clean
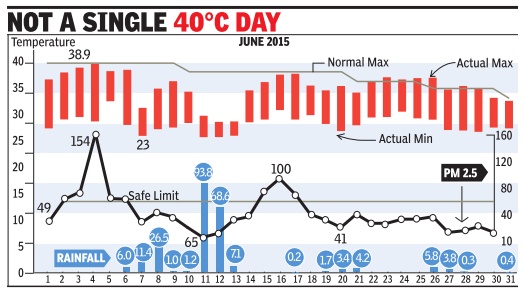
Beating forecasts of a relatively dry and oppressive month, the weather in Ju y came as a pleasant surprise or Delhiites. The city saw as many as 18 rainy days, which kept temperatures in the mild zone for most part of the month. The rainfall also ensured hat air pollution levels in July were among the lowest in recent months, with the PM2.5 evel breaching the safe limit of 60 microgram per cubic metre only on eight days.
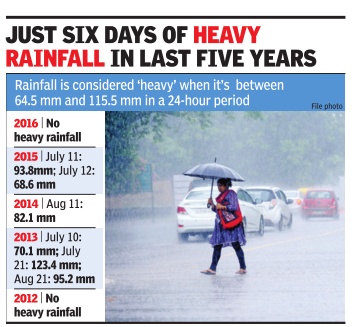
The city received total rainfall of 235.4mm during he month, 12% above the normal of 210.6mm. What stood out in the rain pattern was its distribution through the month, with the first shower being recorded on July 6 and he last on the 31st. Only on two days -July 11 (93.8mm) and July 12 (68.6mm) --did the rain turn into a deluge and caused major disruptions in the city's traffic flow.
July usually has the most oppressive weather of the year in Delhi, with high humidity coupled with heat pushing up use of air-conditioners for periods longer than any other time of the year. That's why the city invariably reaches its highest peak electricity load in July , beating the record high of the previous year. But 2015 has been different. This year, the peak load was reached in June and it was less than last year's record. While June saw the maximum temperature in Delhi hitting 45 degree Celsius as a heatwave across India made international news, July did not see the mercury touch 40 degrees on any day .
The maximum temperature during the month was 39.8 degrees C recorded on July 4. In contrast, July last year had six 40 degree-plus days. The unusually mild July weather this year was not without precedent. It closely resembled conditions experienced in 2013, when the highest July rainfall in 10 years was recorded in Delhi. The difference, however, was that a markedly different weather was expected in 2015, because it's an El Nino year.
August
2015: August rainfall 21% below normal
The Times of India, Sep 01 2015
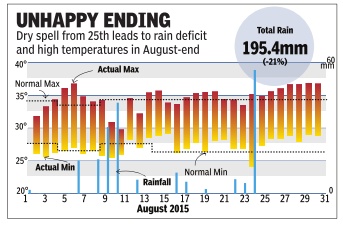
Rains dried up in last week of August, leading to a monsoon deficit of 21% for the month and ushering in days of relatively high heat and humidity . The dry spell, from August 25 onwards, was part of a larger weakness in the monsoon which affected the entire northern plains of the country .
For the capital, however, the absence of rain interrupted what had been till then a pleasant month of August, with frequent rainy days and temperatures firmly in the pleasant zone.
According to readings at the Safdarjung station, the month had 14 rainy days, three more than normal. Despite that, August ended with a high rain deficit mainly because there were hardly any spells of sustained heavy rain. The wettest day of the season (Aug 24) saw 56mm rainfall, hardly much for August. In fact, August has seen wetter days in each of the past 10 years.
December
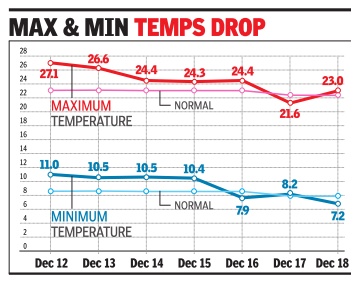
Maximum and minimum temperatures in Delhi, 12-18 Dec, 2016
The Times of India
