Computers, access to, and internet/ digital penetration: India

This is a collection of articles archived for the excellence of their content. Readers will be able to edit existing articles and post new articles directly |
Digital penetration: India and the world
2013
Graphic courtesy: The Times of India
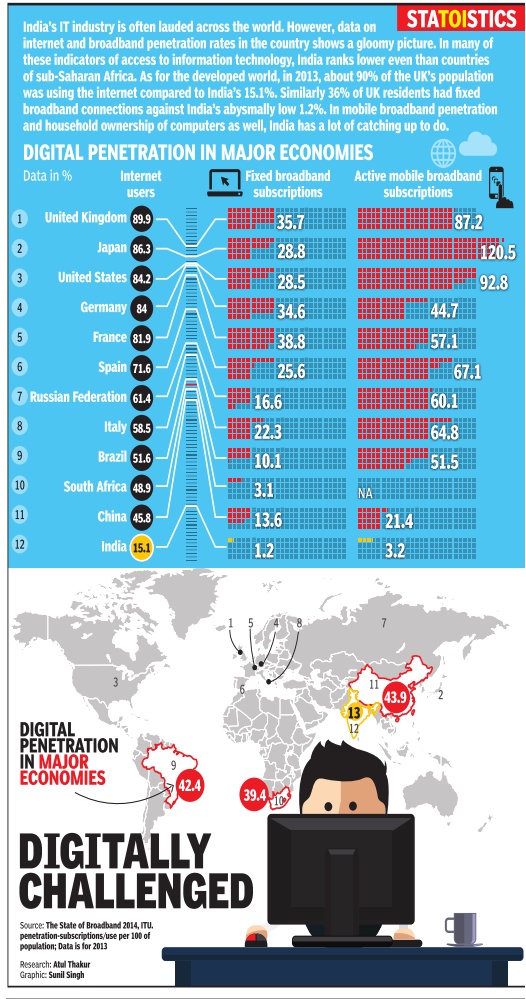
See graphic:
Digital penetration: India and the world
2012- 23

From: May 19, 2023: The Times of India
See graphic:
Internet penetration in India, 2012- 23
Digital Quality of Life
2020

From: Sep 27, 2021: The Times of India
See graphic:
Digital Quality of Life in India, 2020
Digitisation of the economy
2014-2018: rapid growth

From: April 13, 2019: The Times of India
See graphic:
2014-2018: How India became a digital miracle
2018: India world’s 2nd fastest digitising economy
March 31, 2019: The Times of India
From: March 31, 2019: The Times of India
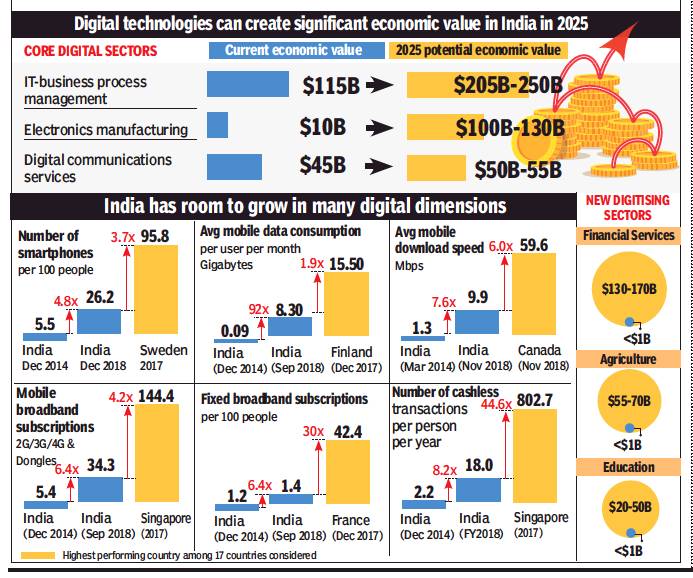
INDIA’S THE SECOND FASTEST DIGITISING ECONOMY IN THE WORLD: McKINSEY
The fast-growing digitisation of the Indian economy has potential to not only boost core sectors like IT, digital communication, and online retail but also transform several other areas of the economy — financial services, agriculture, logistics and education.
India had 560 million connected internet users, and citizens downloaded 12.3 billion mobile applications in 2018, more than any other country except China. The average Indian social media user spends 17 hours on the platforms each week, more than social media users in China and the US, says a new study by McKinsey Global Institute.
The study finds that India is the second fastest digitising economy after Indonesia when compared to 17 mature and emerging economies, including the US, UK, China, and Brazil.
“The opportunity for leapfrogging is available to the poorest sections of society, as the lowest income states have seen the biggest jump in mobile internet subscribers. So now education, healthcare and livelihood opportunities can be delivered to them which won’t have been possible in the PC driven internet age,” said Alok Kshirsagar and Anu Madgavkar, co-authors of the report. “This is not just about startups but also incumbents who are able to use technology to drive 30-40% change in business outcomes.”
This digital economy is also expected to drive change in the nature of work. About 60-65 million jobs could be created by the productivity surge by 2025 in sectors like construction, manufacturing, agriculture, trade, hospitality, finance, media and logistics. But at the same time, this change may also need redeployment or loss of 40-45 million jobs like data-entry operators, bank tellers, clerks, insurance claims and policy-processing staff which may get automated. - TNN
2018: rural-urban divide
Surojit Gupta, Nov 25, 2019: The Times of India
Nearly 4.4% of rural households and 23.4% urban households had a computer while 14.9% of rural households and 42% of urban households had internet facility, a survey conducted by the National Statistical Office showed.
The survey on ‘Household Social Consumption: Education’ conducted by the NSO showed that in rural areas, among persons of 5 years and above, 9.9% were able to operate a computer, 13% were able to use internet and 10.8% used internet during the last 30 days before the survey period In urban areas, among those who were 5 years and above, 32.4% were able to operate a computer, 37.1% were able to use internet and 33.8% used internet during the last 30 days. The main objective of NSS’s 75th round survey on ‘Household Social Consumption’ was to build indicators on participation of persons of age 3 to 35 years in the education system, expenditure incurred on education of the household members and various indicators of those currently not attending education. The survey showed that the literacy rate among those 7 years and above was 77.7%. It was 73.5% in rural areas and 87.7% in urban areas. Among those of 15 years and above, in rural areas, 30.6% had completed secondary or above level of education while in urban areas it was 57.5%.
The survey also showed that 10.6% of those 15 years and above had completed graduate level or more of education. This was 5.7% in rural areas and 21.7% in urban areas. In terms of enrolment among the age group of 3 to 35 years, 13.6% never enrolled, 42.5% enrolled but were currently not attending and 43.9% were currently attending. In rural areas, 15.7% never enrolled, 40.7% enrolled but were currently not attending while 43.5% were currently attending. In urban areas, 8.3% never enrolled, 46.9% enrolled but were currently not attending while 44.8% were currently attending.
Among males, 11% never enrolled, 42.7% enrolled but were currently not attending while 46.2% were currently attending. Among females, 16.6% never enrolled, 42.2% enrolled but were currently not attending while 41.2% were currently attending. The gross attendance ratio at primary level was 101.2%. The figure was 94.4% at ‘upper primary/middle level’ and 98.7% at ‘primary and upper primary/middle level’. The net attendance ratio at primary level was 86.1%. It was 72.2% at ‘upper primary/ middle level’ and 89% at ‘primary and upper primary/ middle level’.
Nearly 96.1% of students were pursuing general courses and 3.9% were pursuing technical/professional courses, the survey found. Among male students, nearly 95.5% were pursuing general courses and 4.5% were pursuing technical/professional courses. Among female students, nearly 96.9% were pursuing general courses and 3.1% were pursuing technical/professional courses.
In rural areas, average expenditure per student pursuing general courses in the current academic year was Rs 5,240 while in urban areas it was Rs 16,308.
Usage of the Internet
1990-2017: growth in India, South Asia, world

From: March 14, 2019: The Times of India
See graphic:
1990-2017: the growth of Internet usage in India, South Asia, world
2012-15, India had world’s most first-time internet users

From: Dipak Dash, `From '12 to '15, India had highest No. of first-time internet users', October 29, 2017: The Times of India
India saw the highest number number of people going online for the first time during 2012-15 period among all countries, according to a recent report of the UN Conference on Trade and Development (UNCTAD). About 17.8 crore people went online during this three-year period, which is much more than that of China, Brazil, Japan and neighbouring countries of Pakistan and Bangladesh.
The report titled “Measuring the Evolving Digital Economy“ was released last week indicate that this trend of more people going online will spur purchase of goods and services resulting in greater inclusion and involvement of citizens with the government and economic growth.
“Nearly 90% of the 750 million people that went online for the first time between 2012 and 2015 were from developing economies, with the largest numbers from India (178 million) and China (122 million),“ the report said. The findings will come as a big boost to the government at a time when it's pushing for digital literacy and promoting doing things digitally .Government sources said the number of people going online must have gone up in the past two years.
The report says in India, Mexico and Nigeria, the annual growth rates of internet use were between 4-6% from 2012 to 2015, whereas the growth rates have been much slower in developed economies, except for Japan, as the markets have already reached near saturation.
According to the report, in many developing countries, nearly half or more of the internet users went online for the first time in the last three years, as in Bangladesh, India, Iran and Pakistan. In Brazil and China, more than 50% people used the internet whereas in India only slightly more than a quarter use it.
“The next billion internet users will also be primarily from developing economies,“ the global report said.
Projecting trends of the future, the report said people doing online transactions will shift from traditional debit and credit cards to new methods of payment. “Their share is expected to drop to 46% by 2019, as e-wallets and other alternative payment methods (such as mobile money) gain in importance. In developed regions, digital payments are dominated by credit and debit cards, followed by e-wallets. In developing countries, by contrast, credit cards are rarely the most important payment method for e-commerce, and the uptake of digital payments is often low,“ the report said.
The UNCTAD report has also raised the concern of how companies, organisations, governments and individuals will need to pay more attention to protect their online data and devices as more economic activities go digital.
2014-17: prices fall, speed and usage increase rapidly
From: Pankaj Doval, Rising speed, falling prices make Indians gorge on data, June 3, 2018: The Times of India
People Switch To Smart TVs, Streaming
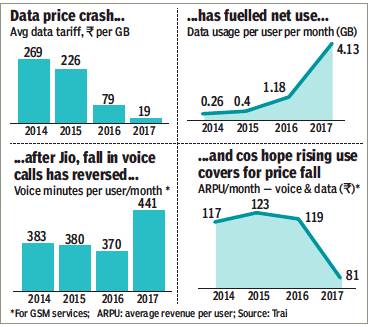
Indians are chugging data like never before. In just three years from 2014, monthly data usage in the country increased 15 times, as smartphones and mobile internet became cheaper and faster. At the end of 2014, the average monthly data consumption was only 0.26GB per person, which increased to over 4GB at the end of 2017, Trai figures show.
Usage has increased not only because fast 4G data is now very cheap, but due to sources of content for smartphones having multiplied. Most online videos are seen on smartphones, and a study by media analytics company Comscore shows 89% of Indians go online on phones and tablets — the highest share among large data-consumption economies. 4G, which promises speeds of at least 10Mbps, is the main driver of wireless data consumption, accounting for nearly 82% of total usage last year.
Data prices tumble to ₹19 from ₹269 per GB in 2014
4G data prices have fallen from an average of Rs 269 per GB in 2014 to Rs 19 now — and even lower in case of bundled individual data packs. It’s 7% of what customers paid earlier.
Prices dropped sharply after Reliance Jio, which has a 4G-only business model, launched in September 2016. However, with rising internet usage, rival companies like Airtel, Vodafone, Idea Cellular and BSNL have also expanded their 4G network.
Increasing wireless data consumption has been a boon for streaming services like YouTube, Gaana and Hotstar. Some, such as Netflix and Amazon Prime, have even started commissioning and sourcing content in Hindi and other Indian languages.
Sales of “smart” or internet-ready TVs are also up. Rahul Tayal, a director at LG India, said smart TVs make up 40% of their TV sales now. Many TVs now come with apps such as Netflix, YouTube and Hotstar and consumers mirror-cast from their smartphones.
Not only data but also voice calls have increased after a dip. To keep up with Jio’s offering of free calls, competing operators have come up with their own schemes, effectively reducing voice prices to nil in case of bundled data offers.
Higher usage has not meant higher revenues and profitability for the companies. The average revenue per user (ARPU) — a key measure of a telecom company’s health — has been for GSM players from Rs 117 at the end of 2014 to around Rs 80 at the end of 2017.
The pressure is telling on older telecom players even as Jio remains aggressive and reports profits. Airtel, the country’s biggest mobile operator, has seen a decline in profitability since Jio’s launch and suffered its first loss (in Indian operations) during the January-March period this year.
2015: 375 million internet users

From: December 7, 2015: India Today
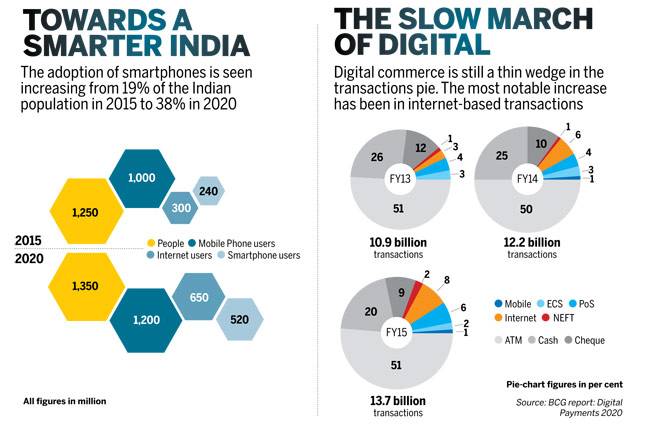
See graphic:
Usage of internet in India, some statistics- 2015
India's internet user base is expected to touch 400 million by the end of 2015, making it the second largest in the world.
2016: Rural India saw 22% jump in internet use in one year: Unicef
December 12, 2017: The Times of India
There has been a massive growth in the number of internet users in rural India registering an increase of 22% in just one year, says an Unicef study which for the first time comprehensiely looked at the different ways digital technology is affecting children’s lives across the world.
According to the report, despite children’s massive online presence – one in three internet users worldwide is a child – too little is done to protect them from the perils of the digital world and to increase their access to safe online content.
A flagship report of the Unicef released on Monday, “State of World’s Children 2017: Children in a digital world,” says internet users in rural India saw a jump of 22% between between October 2015 and October 2016 to reach an estimated 157 million. Urban internet users in the country grew by 7% during the same period to touch 263 million.
“For better and for worse, digital technology is now an irreversible fact of our lives,” said Unicef executive director, Anthony Lake, adding, “In a digital world, our dual challenge is how to mitigate the harms while maximising the benefits of the internet for every child.” The report argues that governments and the private sector have not kept up with the pace of change, exposing children to new risks and harm and leaving millions of the most disadvantaged children behind.
2016> 2018: major increase
From: Chethan Kumar, Internet access in India has crossed 50-crore milestone, December 28, 2018: The Times of India
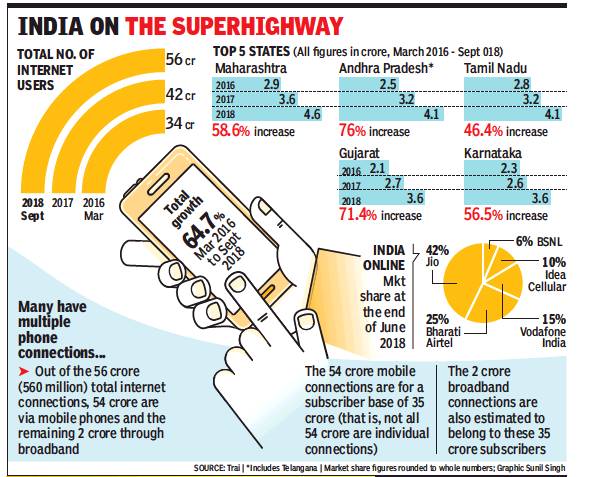
54 Crore Out Of The Total 56 Crore (Or 96%) Online Connections In The Country Are Via Mobile Phones
The number of internet connections in India has grown by 65% from March 2016 to cross the 50 crore mark in 2018, in line with the target set by the Narendra Modi government three years ago.
As per the latest information from the Telecom Regulatory Authority of India (Trai), by the end of September 2018, there were 56 crore narrowband and broadband connections in India.
Comparatively, there were just 34 crore connections as of March 31, 2016, which increased to 42 crore by March 31, 2017. By March 31, 2018, the total number of internet connections stood at 49 crore. That number increased to 51 crore internet connections at the end of June this year before the figure touched 56 crore as of September 30, 2018.
In December 2015, Union telecom minister Ravi Shankar Prasad had said: “My plan is to make 50 crore internet connections in India by 2018... I’m convinced that in the coming 2-3 years, India will become equal to China as an IT market of the world.”
Of the 56 crore connections, 64%, or 36 crore, are in the urban areas and 36%, or 19.4 crore, in the rural areas. While more service providers are focusing on rural areas, experts credit the increase in the hinterland to the infrastructure created by the government. The massive growth in urban centres on the other hand is attributed to the entry of Reliance Jio.
Professor Debabrata Das from the International Institute of Information Technology-Bangalore (IIIT-B), who was an integral part of the Centre’s National Information Infrastructure version 2.0 (NII 2.0), says: “The infrastructure created by staterun BSNL and the Centre’s BharatNet project that envisages connecting all gram panchayats with internet through an optical fibre network must be seen as crucial for the rural connections.”
Just five states — Karnataka, Tamil Nadu, Andhra Pradesh (including Telangana), Gujarat and Maharashtra — account for 20 crore or 36% of all internet connections in India.
Compared to 2016, Karnataka reported a 58% growth in the number of internet connections, while the same was 45% for Tamil Nadu, 76% for Andhra Pradesh, 56% for Maharashtra and 70% for Gujarat.
“The huge increase is largely because of Jio. While BharatNet has created the infrastructure, the actual number of people using it is not much given that most subscribers have wireless connections,” Aravind Kumar, senior advisor, TRAI, told TOI.
Separate data from Trai shows that as of June 30, 2018, Reliance Jio was way ahead of all the other players in terms of market share, with state-run BSNL at the fifth spot. Sources in Trai said the same internet service providers continued to hold the top five positions.
Boosting rural connectivity, the Centre’s BharatNet project has so far connected 1.1 lakh gram panchayats (GPs)with internet through a network of optical fibre cable. Of the states, UP has the maximum GPs connected (27,940), followed by Maharashtra (15,126) and Madhya Pradesh (12,689).
2017: Increased use
Shalina Pillai & Anand J, Cashing in on local lingo The Times of India, September 7, 2017


Lower smartphone and data costs, and technology platforms like Aadhaar and UPI are making it viable for entrepreneurs to offer more products and services to tier 2 and 3 cities, and lower income groups.
And as they do, ventures offering local language content and support are becoming important
A nuradha Agarwal first realised the potential of a smartphone when she visited her hometown Jaipur for a break in 2016, and saw the interest in learning English among many of the women members in her Marwari family .Although English didn't come naturally to many of her relatives, they all had one thing in common expensive phones. “I directed them to a few apps but they weren't comfortable with any ,“ says Agarwal. So she started a few customised chapters, which soon turned into a Facebook page with over 45,000 followers. And before long, it grew into a venture called MultiBhashi, a mobile platform that helped users learn English from 10 regional languages and vice versa. The app has seen over 95,000 downloads.
The growth of regional language users on the internet has been tremendous. A recent report by KPMG India and Google found that Indian language internet users have grown from 42 million in 2011 to 234 million in 2016, a number much higher than the 175 million English internet users in India in 2016. This spurt has helped entrepreneurs like Agarwal.
Lower data & smartphone costs
Indus OS, a mobile operating system targeted at Indians and which provides everything from the interface to app store in 12 Indian languages, works with eight Indian mobile brands including Micromax and Karbonn.Founder Rakesh Deshmukh says when they first tied up with Micromax in 2015, they were told that there would be a long term partnership only if 50,000 units were sold in a month. But in just 17 days of launch, 85,000 devices were sold. Today , Indus OS has 8 million users, and 77% of customers come from tier 2-3 cities.
Several factors have accelerated the pace in recent times lower cost of smartphones and data, the rise of Jio, and the government's focus on digital. Aadhaar, eKYC, and the UPI layers of India Stack too are helping startups, says Bala Girisaballa, Microsoft Accelerator's residence-in-chief.
“We are starting to see a lot more activity (in local languages),“ he says. The accelerator's latest batch has two AI-based startups Liv.Ai, and MegDap, which help convert local speech into text and translate one language to another.
The government's push for digital in particular its dot Bharat domain registration scheme in 2014 is what helped Ajay Data, founder of Jaipurbased Data Xgen, to come up with the idea of offering email domains in Indian languages.People can use the solution to send emails from addresses created in Indian language scripts to Gmail, Outlook, and others, as also communicate in those scripts. The company has part nered with the Rajasthan Government to provide a free email service in Hindi to all citizens.
Plenty of challenges still
Data Xgen has over 2 lakh users. But Data says he is finding it hard to scale due to challenges in integration with mainstream social media and e-commerce channels, which don't accept linguistic email address es as valid logins.
Agarwal's MultiBhashi is yet to find a viable revenue model for its consumer solution, partly because most users are from tier 2-3 cities and are unwilling to pay for the app. Agarwal, who is part of Axilor's latest accelerator batch, is trying to overcome this by targetting enterprises. She is doing pilots with a few companies to help their employees learn other languages.
The enterprise route is one that others have tried with success. Reverie Language Technologies, founded in 2009, provides language localisation for technology platforms right from the interface to the keyboard. It has 30 enterprise customers, including government bodies, internet companies and original equipment manufacturers. It has worked with the central government for its online commodities trading platform and the Karnataka government for digitising land records, says founder Arvind Pani
Investors warm up
Investors are warming up to this space, especially with the success of local language content ventures like Dailyhunt and InShorts. Virendra Gupta's Dailyhunt, an Indian language news aggregator, is the most funded in this space with $84 million. With a reach of 50 million monthly active users, Gupta says advertisements are a big opportunity. “Both financial and non-financial investors are interested in companies like ours as we are catering to the mass market,“ Gupta says.
Liv.Ai's founder Subodh Kumar agrees: “One year ago, investors didn't value regional languages much. Now they have understood the paying capacity of these regions,“ he says. His company has raised $4 million.
Asutosh Updahyay, head of programmes at Axilor, says a lot of players have emerged in the local language space. “You will have to rely on strategies that can effectively manage the app store ratings, discounts, get the right engineering, and build products which are engaging. There will be some amount of consolidation,“ he says.
2018: usage in India lowest in world

From: India closer to China in smartphone sales, but internet use as small as in Africa, July 28, 2018: The Times of India
See graphic :
In 2018 Internet usage in India was the lowest among the countries surveyed.
India is second only to China in the number of people with internet on their phone, that is owning a smartphone. But it has the lowest internet use — just about half that of China. At 25%, internet penetration in India is closer to rates of some African countries, which are among the lowest in the world. This, despite the fact that the next generation of internet users is coming online via smartphones. In fact, a Pew Research Center survey of 39 countries found that despite internet and smartphone access rapidly expanding globally, the digital divide remains in developing countries.
2018-20
Sindhu Hariharan, June 4, 2021: The Times of India
From: Sindhu Hariharan, June 4, 2021: The Times of India
The year 2020 saw slower addition of new internet users but logged increased usage of the web by existing users.
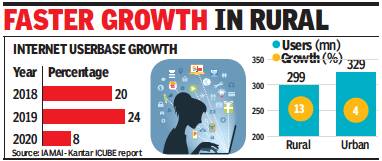
While the total internet user base of India grew 20% in 2018 and 24% in 2019, in 2020 there was just 8% growth, according to an IAMAI-Kantar ICUBE study released on Thursday. This was primarily due to a dip in new mobile connections because of lockdown restrictions last year and the mass movement of migrants. Telecom regulator Trai’s estimates show that the number of mobile connections fell 0.7%, 0.5% and 0.3% respectively in April, May and June 2020.
The active internet user base (those who have accessed the internet in the last one month) stood at 622 million individuals as of 2020, and this pool grew faster in rural India at the rate of 13% to reach 299 million compared to a 4% growth rate in urban India, which had 323 million users. However, as of 2020, nine out of 10 active internet users accessed the web every day, and on average spent around 107 minutes actively on it — a growth of almost 21% from the previous year. This is also one of the highest singleyear growths compared to preceding year.
While the number of users did not grow at the same pace as previous years, the frequency of usage and the number of activities engaged in on the internet went up in 2020, Kantar executive VP (insights division) Biswapriya Bhattacharjee said. “Hence, the digital divide widened a bit more in the year,” he added.
As many as 96% of active users surfed the internet for entertainment-related activities during the year, followed by online communication (text, voice & video chats, emailing, etc.) and social media at 90% and 82% respectively, the study showed. The rise of online gaming and digital payments were more pronounced in 2020, it added. “We observed significant changes in sources of entertainment for users with more people getting on to OTT platforms compared to video streaming platforms earlier. The frequency of use of communication apps also increased,” Bhattacharjee said.
Mobile phones remain the most used device for accessing the internet on the back of cheaper data plans and growing prevalence of Indic language content on the world wide web. Out of the 622 million active internet users in India, 58% are male and remaining female. “The internet user market is still a male preserve in India, underlining the digital gender gap. However, the gender digital divide is now closing,” the study noted.
2019: more rural net users than urban
Bengaluru:
For the first time, India has more internet users in rural areas than in urban cities. The report by the Internet & Mobile Association of India (IAMAI) and Nielsen showed rural India had 227 million active internet users, 10% more than urban India’s about 205 million, as of November 2019.
The numbers were boosted by the cheapest internet connections in the world.
In addition, there are around 71 million kids, aged 5-11 years, who go online using devices of family members. With this, India surpassed another milestone of having 504 million active internet users who are 5 years old or above — 53 million more than 451 million in March 2019. Active internet users are defined as those who use the internet at least once a month.
At 40%, India lags behind US, China in internet penetration
With 504 million active internet users who are 5 years old or above , India has become the second-largest internet user market behind China, which has about 850 million users. The United States has about 280-300 million users.
India remains behind both countries in internet penetration, which stands at 40% compared to over 88% for the US and 61% for China. The report by the Internet & Mobile Association of India and Nielsen also added that the increase in female internet users was much higher at 21% as compared to 9% for males during the March-November period. It said 26 million new female users went online during this period.
The potential of adding new users in the hinterland still remains “immense” in the coming few years, according to the report. The top eight metros had an internet penetration of 65% as of November 2019, compared to 63% as of March 2019.
These changes can be seen on women-focused platforms like POPxo, which has seen increasing users from small towns and in local languages. Founded in 2014, the platform tried an experiment with local languages, starting with Hindi four years ago, but shut it down as it didn’t attract enough users. It started Hindi again last year, which attracts as many pageviews as English now. A majority 13 million of the 22 million average monthly pageviews are in local languages — Hindi, Marathi and Bengali — with the remaining coming in English.
2020: 75cr connections
Chethan Kumar, November 16, 2020: The Times of India
From: Chethan Kumar, November 16, 2020: The Times of India
The number of internet connections in India has breached the 75-crore milestone as of August 31 this year, 25 years after the service was thrown open to the public on August 15, 1995.
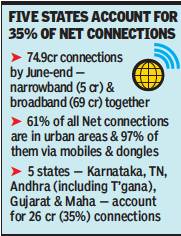
The number of connections more than doubled from 34 crore in March 2016, coinciding with Digital India programme launched in 2015. Most connections are in urban areas and availed of through mobile phones and dongles. As per Trai, there were 74.9 crore internet connections by the end of June 2020 — narrowband (5 crore) and broadband (69.2 crore) together. Broadband-specific data shows the country had 71 crore connections by the end of August 2020.
India’s internet connections: 61% in urban areas, 97% are wireless
Even if narrowband connections remained the same as in June, the total number of internet connections stood at 76.7 crore at the end of August. Both datasets were released last week. India hit the 50-crore mark in September 2018, as first reported by TOI. The country has since, on average, added 86 lakh connections each month.
While the overall subscriber data is available up to August, the breakups are available only up to June 30, 2020. As per that information, 61% of all connections were in urban areas and 97% of them were wireless. Lieutenant General (retired) SP Kochhar, director general, Cellular Operators Association of India (COAI), told TOI: “While we have 97% of our broadband connections on mobiles, adequate network coverage of the population is hovering around 50%. There have to be more network rollouts; it must be affordable while ensuring quality of service.” He said the government must support telecom as a foundational sector since it enables many other sectors. COAI has proposed to Trai to introduce a minimum floor price for data on a trial basis, which the latter has said would be considered for an openhouse discussion. It has asked the government to reconsider spectrum charges and revisit other fees and charges causing distress to the sector.
Five states — Karnataka, Tamil Nadu, Andhra Pradesh (including Telangana), Gujarat and Maharashtra — account for 26 crore (or 35% of all) internet connections. Separate data shows that as of June 30, 2020, Reliance Jio had the most market share.
2021
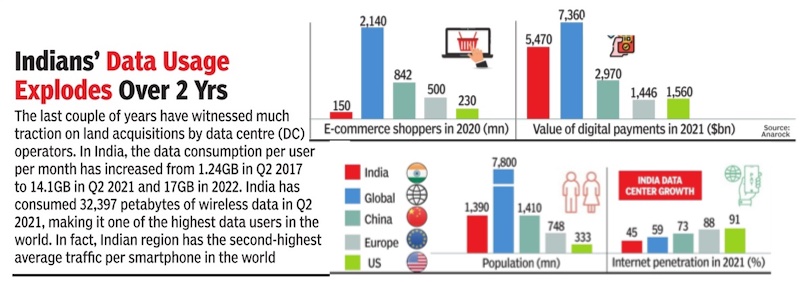
From: Oct 5, 2022: The Times of India
See graphic:
India data centre growth, 2017
1995-2025: India’s population using the Internet
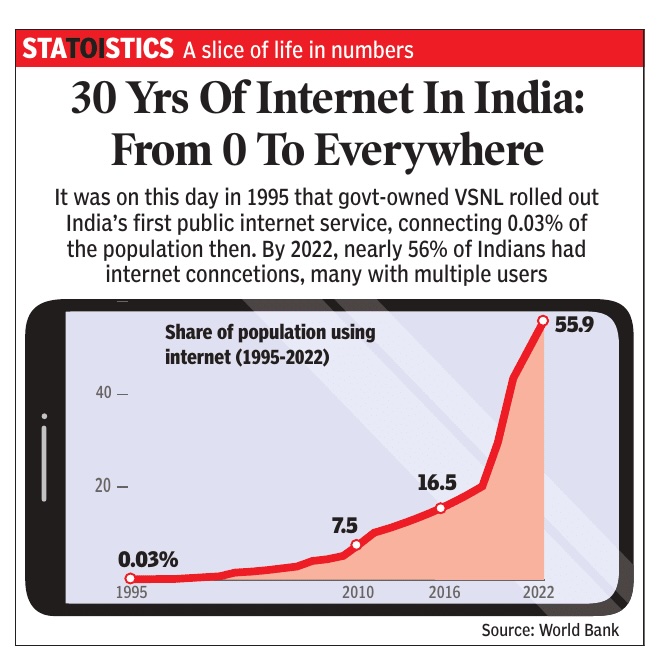
From: August 15, 2025: The Times of India
See graphic:
The share of India’s population using the Internet, 1995-2025
See also
Computers, access to, and internet/ digital penetration: India
Computers, India: history, milestones
