Bhavnagar City and Villages, 1931
This article has been extracted from DELHI: MANAGER OF PUBLICATIONS |
NOTE: While reading please keep in mind that all articles in this series have been scanned from a book. Invariably, some words get garbled during Optical Recognition. Besides, paragraphs get rearranged or omitted and/ or footnotes get inserted into the main text of the article, interrupting the flow. As an unfunded, volunteer effort we cannot do better than this.
Readers who spot errors in this article and want to aid our efforts might like to copy the somewhat garbled text of this series of articles on an MS Word (or other word processing) file, correct the mistakes and send the corrected file to our Facebook page [Indpaedia.com]
Secondly, kindly ignore all references to page numbers, because they refer to the physical, printed book.
Towns, The City Of Bhavnagar And Villages
61. Reference to Statistics.-Imperial Table III classifies the urban ana. rural population of the State by Mahals; Imperial Table IV classifies onlythe urban population, and shows its variation since 1911; and Imperial Table V gives. the ~gures of, relig~ous composition?f t~e urban population. Only' the proportionate figures will, therefore, be gIVen m the margmal and Subsidiary Tables ,embodied in the letter-press.
62. Definition of Town.-According to the Census Code, Municipalities,.
Cantonments and Civil Lines and all other places having a population of more
than' 5,000, which the' Provincial Superintendent may decide to treat as such
for Census pti~poses, are towns. This State is concerned with only one 'aspect of
this definition; as there is no place with a population of more than 5,000 without
a municipality.. All the Mahal head-quarters like Umrala, Lilia, and Talaja with:
a population below 5,000 come under the category of Census towns on account of
theirhaving,municipalities. Since 1911, when the Imperial Tables for the State
were'for the•first tim~ printed in the form of a booklet, the towns have remained
coinCident. 'Their number and area have remained unchanged. Moreover, with
the ,solitary' .exception of the Mahal of Victor, all head-quarters of Mahals.
are towns. ,Discretion is given by the Code to the Provincial. Superintendent to•
treat 'as town'it place without a municipality, when its population exceeds 5,000'
and possesses a truly urban character. The possession of the latter characteristic
is, however, to be assumed in the case of a municipal area which is to be
ipso facto consigned to the category of a town, even if its population is:
below 5,000.
The population living in towns is regarded urban, and the rest rural. The idea behind this classification of population into urban and rural is "to separate people living, in sparsely settled regions and small villages from those living in towns: and cities, on the theory that the former lead a more individualistic life,. while the latter lead a more communal life," I it being also supposed that the u~ban and rural populations live and work under different conditions.
As only the municipal centres have been treated as towns, there is not the least likelihood of any fluctuation being recorded in the urban and. rural-population of the State by the transfer of rural places to' the urban, as in, the case of other Indian States and British Provinces where the discretion afore• said• ,has very often been used to show a fair number of urban places in, their jurisdiction. '
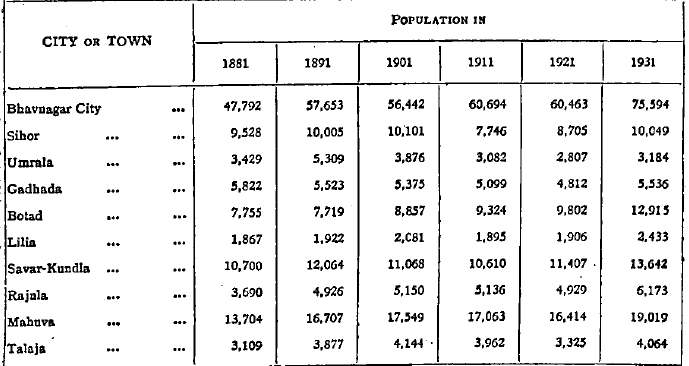
63. Growth of Urban Population.-Of the total popujation of 5,00,274' persons, the urban population claims l,52,6090r 30'5 per cent. ~f the..latter, the City .. of Bhavnagar alone claims 75,594 or 15 per cent., the remaining 77,015 .or 16 per cent. being distributed among the towns' of Mahuva, Savar-Kundla, Botad,. Sihor, Rajula. Gadhada, Talaja, Lilia and Umrala. All these. with the exception of Rajula f~rm the seats ofyahivatdar's kacheri. The figures on the margin
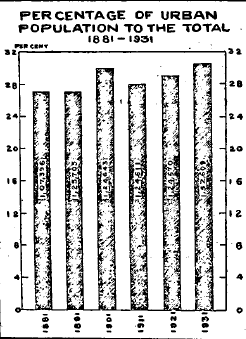
But the• total increase in the urban popa. lation itself during the past decade amounts to 22 per cent, The urban . .. . population in 1881 was 1,07,396 over which the present population sh~ws. an increase of 42 per cent. during the last fifty years, The margmal table gIVes . the percentages of the urban population to the total since 1881, It has gone from 107396 in 1881 to 1 52609 in 1931; and its percentage to the total has. , , , , risen during that period from 26'8 t() 30'S~
them will make this point clear, It will be also observed that the present Census spasses all the Censuses that have been hitherto taken, in that it has not only got the highest number of persons classed as urban but that the percentage of the urban popula •tion to the total is also the 'highest, In 1901, the urban population formed 30'2 per cent, of the total, But from this no sudden improvement in the process of urbanization should be inferred during the decade 1891- 1901. The higher percentage in 1901 was due to the Immigration. of the people from villages to Mahal head'quarters for famine relief during the fa mine of 1900,as the acuteness of the disaster had forced the people in rural' areas to leave their native villages and flock to towns. On the whole, compared to other Indian States and British India, there is Though the 3£tuaI numbers of the urban population have varied but little from 1891 to 1921, the percentages of the urban to the total population recorded at each successive Census show appreciable variations. The marginal diagram which shows the percentage of urban population to the total by bars of proportionate length with the figures of actual population written in.
a very high degree of urbanization In this State, While the percentage of urban;: population of India as a whole has increased a little from 10'2 in 1921 to 11 atthe current Census, that of the Bombay Presidency which registered the highest degree of urbanity (22'9 per cent.) a decade ago has slightly dropped. down to. 21'2. But the State of ~h~vnagar ~ 30'S per cent. of its .present population. shown as urban, The Similar proportion for the States compnsedinthe Western India States Agency comes to 22'1. . '. ... –
64. T ypea of To~-Before tne various types of towns are distinguished..
it IS necessary to pomt out that SaYar Samapadar and Kundla which forthe
purposes of the Imperia! Tables have been treated separately ~ pursuance
'of the past practice, have for the purposes of this chapter ,been treated as -one town under the name of Savar-Kundla. It will be remembered that both of them have a municipality in common, and are situated one below the other_ The river Na vii which runs between these two places, and seems to separate them, "l"eally serves as a link between them in the form of a bazaar which is held in its dry river bed. The people of both the places lead a common social and economic life. And as one has merged into the other, and produced one homoaen_ -eous town, it will be hardly fair to treat them as two separate and independent urban centres. If an attempt be made to classify the towns according to the main factors to 'Which they owe their urbanity, the towns of the State may" be roughly divided
- into (J) industrial and commercial towns, (iJ) market towns and railway centres,
!iii) old established towns, (iv) temple towns, and (v) agricultural towns. The marginal table shows the number and population of each of the various types of towns. It also gives the proportion per cent. and the average population of each type. The City of Bhavnagar with its growing trade and commerce is
decidedly a rising industrial and commercial centre. It claims 50 per cent. of the total urban population of the State. Mahuva, SavarKundla, and Botad owe their position, among other things, mainly to their be. ing railway centres, and market places. Among the old established urban towns should be included Sihor, Umrala, and Rajula; whereas Gadhada with the temple of Swaminarayan, and Talaja with the Jain temples are the temple towns noted for their being centres of pilgrimage. Lilia has no such relieving feature as the others mentioned above. It is agricultural, and would not have merited the position of a town but for its having a municipality and being the head-quarters of .a Mahal. The average population of a town comes to 15,261, and is exceeded -only by the industrial and commercial centre of Bhavnagar and the market town of Mahuva. In alIiance with the City which has 50 per cent. of the urban popula. tion, the towns of Mahuva, Savar-Kundla and Botad alone claim 1,21,170 or 80 "per cent. of the total urban population. Thus the major portion of the urban population lives in commercial and market towns. Amongst the old established towns, Sihor is prominent and without it the average of this class would have been ~onsiderably reduced. Their share amounts to 19,406 or 13 per cent. The temple and the agricultural towns contribute but very little, their respective quota being only 6 and 1 per cent. of the urban population of the State. The types as defined above represent only the salient feature of the urban life of that particular group. It is only representative and by no means pure and unalloyed. For, Bhavnagar ,City which is a commercial centre is also a great centre of railway. Mahuva, Savar-Kundla, and Botad which are market towns and railway centres, and the temple town of Talaja are also in a way old established towns. Sihor, over and above its being an old town, is also a railway centre; and so are all the rest. It need hardly be added that it is the main characteristic whicl1 is marked and im. portant that is emphasized.
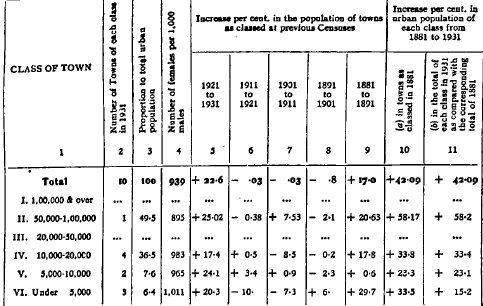
65. Towns classified by Population.-Imperial Tables III and IV should be referred to for the absolute figures of towns falling under different population classes, as also for the figures of variation since 1881. Percentage variation will be found in the following Subsidiary Table.
There is no town in the State having a population of 1,00,000 and over. In. the second class with a population ranging between 50,000 and 1,00,000 falls City of Bhavnagar with a popUlation of 75,594. . The City' will ?e considered i?detail at its proper place, and so only a paSSIng reference Will be made to It wherever necessary. The'absence of any place in the third class with a population between 20,000 and 50,000 discloses the lack of towns of middle size. This. phenomenon is common to the whole ofIndia. At the top, there are a few industrial and commercial cities like Bombay and Calcutta, some medium sized towns in the• middle and a large number of agricultural and rural villages at the bottom. There, are 4 towns with a population between 10,000 and 20,000.
These are Mahuva, Savar-Kundla, Botad, and Sihor. They claim 36.5 per cent. of the total urban population of the State. This class seems to have suffered a decline in its population for 20 years since 1891. But it has more than regained its former position within the last ten years when it seems to have progressed with redoubled energy, and shows an increase of 17'4 per cent. During the last five decennia, this class has increased by 35 per cent. The fifth class having population between 5,000 and 10,000 has showed continued progress except during• the unhappy decade 1891-1901. It has got two places and its increase during the past decennuim is as great as 24 per cent. This class represents only 7'6 per cent. of the total urban population. The last urban class with places having less than 5,000 has three towns, and claims only 6'4 per cent. of the town-dwelling population. Though losses in the population of this class between 1901-11 and 1911-21 are fairly high amounting respectively to 7 and 10 per cent., it has not been backward in making them up during the past decade which records an increase of 20'3 per cent. upon the numbers of 1921. During the past fifty years its gains amount to 33 per cent. But according to its present classification as compared with the correspondinO" total in 1881, the increase registered is 15 per cent. It indicates that durina th~ past five decennia much of the population of this class has been lost to the hlgherclasses The net progress of the urban population as a whole, as also of each of the population classes is indeed very striking~ Since 1881, though the. population in
the towns has risen by 42 per cent., the total number of places classed as urban has
remained stationary. The percentage of increase indicates the growing nature of
those towns which are thriving for various reasons. The growth of the urban
population of the State 'represents the growth of the towns of Mahal head-quar.
ters and the greatest quota is contributed by the capital. Growth of commerce
due to the prosperity of the Port of Bhavnagar, extension of railway communica.
tions, and the development of market centres like Botad and Kundla are the chief
causes of the increase in the urban popul<\tion of the State. Since 1891, it has
shown a slight but continuous decrease upto 1921. During the decennium 1901-
1911 which registered an increase of 6'9 in the total population, the decrease recor.
ded in the urban population was '03 per cent. It was the last decade alone which
favoured a great. percentage increase amounting to 22'6 per cent. For thirty
years from 1891.1921, the occupations in towns do not appear to be attractive
. enough to draw the inhabitants of villages to urban areas, and there seems to have
been no appreciable development of the urban occupations during this period.
The rerriarkable commercial development during 1921-31is reflected in the growth
• of the town•dwelling population. The rise which is abrupt and sudden is spread
• over all the classes of population. Such a wide and varied expansion in the urban
population of this State has never heen observed before. The tendency of the
• urban population to live and flourish in larger and growing towns will be noticed
from the fact that 86 per cent. of the urban population live in towns with popula•
tion above 10,000.
66. Progressive Towns.-Having considered the variation and distri.
,bution of the population in towns, those among them which are exhibiting
'progressive tendencies will now be marked out. Among them Botad, Savar.
Kundla, Lilia, Rajula, and Mahuva are the most important. The growth of
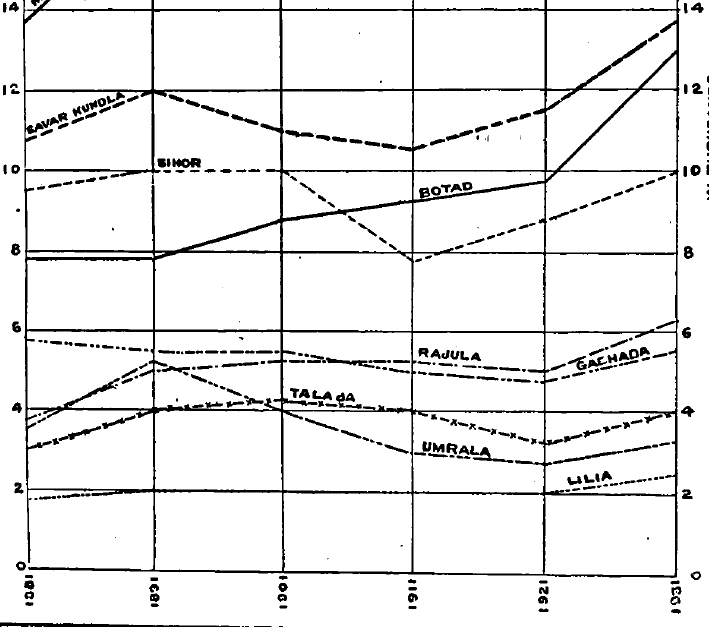
the City will be separately surveyed.
. The table above and the diagram opposite point to the steady and uniform progress of some of these towns. Mabuva is a flourishing market town. Since 1881 it has added 5,315 souls to its population, and in 1901 its population rose to d,S49. Though the nex.t two decades register~d slight b~t n~gligible decreases in its population, dunng the last 10 years Its population Increased by '2605 or 16 per cent. It is an old port of the State, and used to attract a fair ,a:nount of coastal trade to its shores. The extension of the B. S. Railway from Kundla to Mahuva offered great facilities for the expansion of its internal trade,
by establishing contact with the people of the neighbouring tract& Added t~ it are the recent erection of a spinning mill and rich gardeo soil SIllTounded by mango plantations all of whom have accelerated the growth of Ma~uva into a middle size market town. Almost all the progressive towns owe their growth to the working of the same phenomenon. The impetlls given by the extension of the, railway line is in all the cases great, and cannot be minimized. In 1891, the. population of Savar-Kundla rose to 12,064, and declined at the two succeedingCen5u~ es. The rise noticeable in 1921 in spite of the plague and influenza epidemics continued till 1931 with greater speed, resulting in an increase of 20' per cent. To a less extent than Botad, Savar-Kundla is also a eotton growing tract. It possesses a press, and ginning factories which have played an important part in the growth of its population.
It has also established its reputation for the manufacture of iron scales and other iron wares, which are sent ,outside in an increasing quantity. With an important market for disposing. of agricultural produce of the surrounding villages, Kundla has secured to itself, the status of a rising urban centre. But Botad has grown wonderfully during:; the last thirty years. It remained stationary in 1881 and 1891. But since 1901, its progress has been swift and continuous. It has already been seen that it is a rising cotton growing tract surrounded by ginning factories. Its position as a junction statioo on the Bhavnagar State Railway has greatly' contributed to its growth as a prosperous market town. During the past decennium its population recorded an increase of 32 per cent. To every hundred of its population in 1881, Botad has added 65 during the last fifty years.
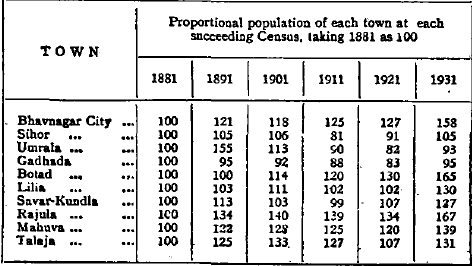
This' is by no means an ordinary rate of increase which is slightly beaten by Rajula whose progress was still more rapid and amounted to 67 per cent. Rajula showed a sudden rise in 1891, which was sustained even during the famine 'Census of 1901. Barring the negligible losses of 14 and 207 in 1911 and 1921, it continued to thrive upto 1931. During the last ten years it has added 1,244 persons to its population in 1921. Its stone quarries, and to a less advantageous ,extent than Botad and Savar-Kundla the extension of the railroads, make up the prosperity of the small but rising town of Rajula. From 3,690 in 1881,its population has reached 6,173 in 1931. During' the past fifty years the population of Rajula has added 67 persons to every hundred of its inhabitants in, 1881. Lilia is also to be included in the list of towns that have to thank railway ~xtension for their growth and development. Its population which was 1,867 m 1881 rose to 2,433 in 1931. In fifty years its population has increased ~y 30 ~r c~nt. ~ever before did Lilia see such a great increase in . its popula! Ion as It did dUring 1921-1931, when it rose by 27'5 per cent. For, upto 1921'; ~ts growth w~s meagre and scanty, and hardly of any account. Since 1881, It shows a,n mcre~ of only 2 per cent. in 40 years, though an increase of 11 per cent. IS seen m 1901 upon the population of 1881. To the facilities of railw3;y communication;; exten,ded during the past decade, it owes its rise and -establishment as a growmg agncultural town during the past decennium. ~he marginal table compares the proportionate figures of the population of . the City of Bhavnagar ,and the towns at each succeeding Census, taking the population of 1881 as 100. The tabulation of the statistics in this form gives a comprehensive idea of the rise and faIl in the population of the towns of the State at each sue- ceeding Census since 1881. Proportional population or each town at each
67. Stationary Towna.-of the t\~o ~tationary towns of Taiaj~.and Sihof,
the former may well be deemed progressive on the basis of its population as it
stood in' 1881. But it is found that in' 1901 its population was 4,144, and toattain that level the present figure of 4,064 must still have some 80 persons more. But the deficits resulting during the Censuses of 1911 and 1921 have been remark. ably made up during the past decade which records an increase of 739 or 22 per' cent. The opening of the tram line from Bhavnagar to Talaja has come to thee succour of Talaja to establish itself once more as a pilgrim town, and the contemplated extension of the railway line from Talaja to Mahuva may serve it in still greater stead by enabling it to secure for itself the favourable position of a. market town. As in the case of Talaja, so in the case of Sihor, the 1931 Census has been helpful in enabling it to reach the 1901 population level, which is less by 52 souls. Its vicinity to the capital whose commercial advancement during the past decennium was unprecedented, the revival of its old industry of brasswaree manufacture, and the return home during the post-war period of some of its ablebodied inhabitants have helped it a great deal in regaining its former status. But. its present population which is 10,049 had fallen as low as 7,746 in 1911 when. there was a general increase in the population of the State.
68. Decaying Towns.-UmTala and Gadhada are the two towns whicb have manifested decaying tendencies during the greater part of the last fifty years. Though the present Census may be regarded to have enabled them to emerge successfully from the struggle to regain their 1881 position, deficits of 245 and 286. respectively are still to be made up. U mrala has not been fortunate enough to-. enjoy the benefits of being a railway station. The population of this original seat of the ruling house of Bhavnagar which rose to 5,309 in 1891, fell as low as'. 2,807 in 1921. At present it has risen to 3,184. The absence of railway and the growth in its vicinity of the rising village of Dhola are mainly responsible for the depletion in the popUlation of Umrala. This is also evidenced by examining the proportions'per mille of the male and female population of Umrala.
In every thousand that inhabit the town 492 are males and 508 are females. In the State ,. and particularly in towns it is the males that preponderate and not the females. The excess of the latter in the town of Umrala points to the emigration of its able•bodied males for earning their living. Though its present popUlation discloses'. an increase of 13 per cent. during the past decade, there is still a deficit of 7 percent. to be made up over the population as it stood in 1881. But the decay is vividly brought to light when it is noticed that from 3,429 in 1881, the population had risen to 5,309 in 1891. The severe effects of the 1900 famine that followed the latter Census are visible in the subsequent fall to 3,876in 1901 which recorded' a decrease of 1,433 or 36 per cent. These heavy losses have never been made upsince then. But the position of Gadhada is not so very precarious. For, with the exception of the year 1921 when its population fell to 4,812, its population had never gone below five thousand. Gadhada was at its highest in 1881 when its. population stood at the handsome figure of 5,822. Since 1891, it continuously declined and fell to 4,812 in 1921. But during the past decennium, its populatioll' .registered an increase of 724 or 15 per cent., and the newly constructed railway . line between Ningala and Gadhada may enable it to fare still better during the decade to pass. Umrala and Gadhada are to-day the only towns which show negligible deficits over the population figures of 1881. To them may be addeclo Sihor and Talaja whose population is still below the figures which they had. attained at one time or another during the past five decennia.
69: Causes of Urban Growth.-The progressive, stationary and decaying' . towns have been considered in the preceding paras. It has been observed that the railway policy of the State has played a very useful and important part, both by way of. contributing to the growth and development of some of them as centres. of market for the Mahals whose head.quarters they happen to be, as also by way of encouraging the towns like Sihor and Talaja to recover the ground lost during. the previous Censuses. The. effects of railway communicat!ons upon the rise ,and . growth, as also upon the mamtenance of the urban population have been conSiderable. They have been brought into greater prominen~e during the times of comparative peace and prosperity which the people enjoyed during the past.
-decennium. The great significance of railways lies in the stimulus they give to
the growth of markets which in. their tom promote in~~ tra~e and commerce;
.and contribute to urban prosperity. Mr. Marten, while discussing the causes that
,generally go to make up the growth of towns and cities, points out;-
"Some as the capital. of former ruling dyuasties, owed their importance to their position as
political conir .. ; otber. situated on the great land or water• ways, grew np as emporia of
trad.. others again were establisbed as strategic citadels of defence against bostile raiders.
The prosperity of many," be luggests, "has varied ••• with the diversion of trade•rontes, the
growtb or decay of barbour .. the introduction of railways and development of communications."
1M cbief empbasis is laid on the "two dominant factors wbich bave specially determiued
the direction and character of urban development during the last twenty years, namely (a) the
-e.pansion of trade and commerce and (b) the development of organized industries,"} -
But the contribution made by organized industries, as evidenced by the
.erection of an additional spinning mill at Mahuva and increase in the number of
ginning factories, though appreciable, is by no means as important as that done
by the expansion of trade and commerce as a result of the extension of railway
and increase of trade at the prospering barbour of Bhavnagar.
70. DiatributioD of Population.-The variation in the urban population "by Mahals has been seen. The following Subsidiary Table shows the distribution -of the population between towns and villages of various sizes.
DISTRIBUTION OF THE POPULATION BETWEEN TOWNS AND VILLAGES
Average Number per Number per mille of urb8i1 ' Number per mille of rural
Population mUle~ding population in towns population residing in
per In with a population of villages with a
population of
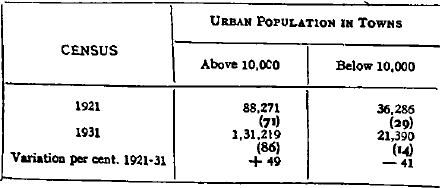
. "Out of every thousand of the general population, 305 live in towns and 695 ID v1ll.age:s- So far as the urba~ population is concerned, out of every thousand -that .hve ID tow.ns 495 perso~s hve in towns with a population of 20,000 and over, _~75 10 towns w1th a population of 1O,00~ to 20,000, ~66 in towns with a population of 5,000 to 10,000 an.d only 64 10 towns w1th a population under 5,000. 'Out of a total urban population of 1,52,609, 1,31,219 or 86 per cent. live in towns -abov~ 10,000, whereas 21,390 or 14 per cent. live in towns below 10,000. The margmalstatementcompares the figures of 1,9 21 with those of 1931 and illu s trate s :, I URBAN PoPULA.TION IN TOWNS that while the population of towns above 10,000 CENSUS I shows an increase of 49 , Above 10.OCO Below 10,000 per cent. during the past
the population per cent. of-each class to the total urban population. While thepopulation
in towns above 10,000 has increased froro 71 per cent. in 1921 to 86
in 1931, that in towns below 10,000 has decreased froro 29 to 14. The tendency
of the population to flock tc;> 1arge~ urban centr~ which grow at the expense of
villages and sroaller towns IS unmistakable. It mdicates that whereas the smaller
towns like Umrala and Gadhada are gradually decaying, the larger towns. like
Botad, Savar-Kundl~, Mahuva and the City of Bhavnagar tend to grow more
and mO.re under the mfluence. of expanding markets and increasing commercial
prospenty_
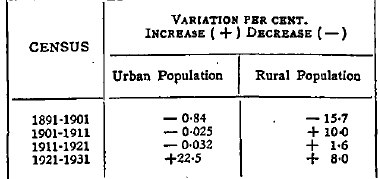
71. That this tendency is peculiar only to the present• Census will be observed from the figures given in the marginal table. Ever since the Census. of 1901, no other intercensal period has seen such an extraordinary rise in the urban population of the State .. F.roro 1891 to 1921, the loss, though shght, has been continuous. Even. in 1911, when the general population registered an increase• of 6'9 per cent., the urban popula-• tion showed a decrease of 0'025 per cent. This goes to prove that the town life was neither popu-• lar . nor attractive until the
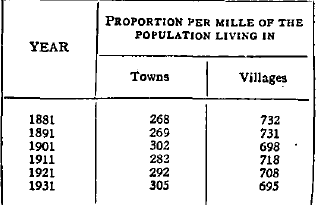
commencement of the past decennium which was responsible for such a big increase of 22'5 per cent. in the urban population of the State. While the increas7 in the total popul~tion of t;he State is recorded to be 17'3 per cent., the respective percenta.ges of mcrease m the urban and rural population are 22'5 and 8. In this connection the marginal statistics will prove interesting and instructive as illustrating the process of urbanisation since 1881. The figures which show the proportions per mille of the population that live in towns and villages, reveal a state of increasing urbanisation from Census to Census, despite the fact that there have been slight decreases in the urban population of the State from 1891 to 1921. The figures of 1901 are striking and noteworthy. They appear to indicate an unexpected leap in the process of urbanisation, during the decennium 1891-1901. The proportion per mille of persons living PaOPORTrON PER MILLE OF THE
in towns rose from 269 in 1891 to 302 in 1901. But the rise was not due to any genuine increase in the proportion of the urban population of the State, but was due, as already noted, to the migration of the village people to the urban. areas for famine relief. The effects of the ravages of the Big Famine upon. the rural tracts are vividly brought out by these statistics. But barring this. exceptional year, the growth of the urban population was the greatest during 1921-31. The flow of the people from villages to towns that supply them in an. increasing manner with the wherewithals to earn their livelihood was steady . and continuous, the proportion per mille of the population living in towns having xjsen from 268 in 1881 to 305 in 19,31. The variation in the distribution of popUlation between towns and villages. is due first to natural causes and. secondly to the migration of people from villages and foreign territories who flock to rising urban centres for bread. Some-• times, it is due to the increase in urban areas. But in the case of this State the latter factor is to be entirely, ruled out of court as its urban areas have undergone no change ever since 1872. rherefore, it need. hardly be asserted that the growth. noticed above is due to the first two causes alone. .
72. Effecta of Urban Crowth.-The process of urbanisation has been
steady and continuous since 1891. Notwithstanding increasing urbanisation, the
number of persons living, i':1 towns has not only remained stationary, ~ut has ~oshown
slight though neghglble decrease upto 1921. From 1,25,705 m 1891, It
feU to 1 24 570 in 1921. But the increase since 1921 outstrips all former growth
and sho;"s ~n increase of 28,039 or 22'6 per cent. The net increase in the urban
population since 1881 is 42 per cent. A co,?pariso~ between the percentages.
of increase in the urban and rural population which are 22'5 and 8 respectively
with the general increa~ of 17'3 per cent. indicate;; t~at the urban
population has. grown far more rapIdly than the rural. It also slgrufies the ext~nt
to which the VIllage people have moved to the towns, as also the extent to which
the pressure on land has been relieved by the employment afforded by non-agricultural
occupations at urban centres.
73, Religious Composition of Urban Population.-The religious composition
of the urban population is shown by the foregoing Subsidiary Table. The•
proportion per mille of the total population living in towns is 305. The Hindus
who represent 87 per cent. of the State population have got only 258 persons in
every thousand of their population living in towns. But the adherents of Islam
who form only 8'5 per cent. of the total population have 602 persons dwelling in
towns in every thousand of the Muslim population. And for every thousand of
the Jain, Christian and Parsi population 619, 964 and 990 persons respectively
are the dwellers in urban areas. These statistics bear out the tendency of the
members of a major community to be more of the rural areas than of the urban •.
The Musalmans and Jains who are not so numerous as the Hindus are largely
town dwellers; but the Hindus who form the majority are largely living in.
villages.
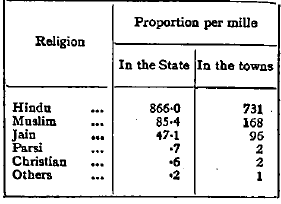
The marginal statement compares the figures of religious composition of the• total population with that of the urban. Every ten thousand of the State population is composed of 8,660 Hindus, 854 Musalmans 471 J ains, 7 Parsis, 6 Christians, and 2 belonging to other religions. But the same distribution of the population is not maintained in towns where 7,310 Hindus, 1,680 Musalmans, 960 Jains, 20 Parsis, 20 Christians and 10 of other religions go to make up every ten thousand of the urban population. The proportion per mille of the population living in towns is reduced by 135 in the ease of the Hindus, Proportion per mille Religion In the State In the towns
whereas in the case of the followers of other religions, it increases considerably. This ~esul! is due to the relatively smaller percentage proportion of the Hindus that bves ID towns compared to that of the Jains, Muslims and other minorities. For, while only 26 per cent. of the Hindu population live in towns, among the
Muslims, Jains, Christians, and Parsis, 60, 62, 96, and 99 per cent. respectively belong to urban areas. This lends support to the view expressed by Mr. Sedgwick that :- .. Everywhere the country is homogeneous and native, tbe townbeterogeneous and •cosmopolitan. Hence all minorities fiud tbeir way to and Boarisb in town .... ' This phenomenon is found to operate in all the countries of the world. Town- Dwelling, as will be seen later on, partially accounts for the greater degree of literacy in the case of some of the minorities like the Jains, Parsis, and Christians. Moreover, on account of the greater proportion of their population being urban, the minority communities have been observed to be engaged in agricultural pursuits to a less extent than the members of the majority communities. The Total enga,e-- Religion ed in agriculture
marginal table compiled from Imperial Table XI supplies the statistics of persons engaged in certain selected groups of occupations. Out of 1,03,943 that are returned as engaged either as earners or working dependants in the four selected groups of agricultural occupations, viz., rent receivers, cultivating owners, cultivating tenants and agricultural labourers, 96,645 or 95 per cent. are Hindus, 3,904 or 4 per cent. Muslims, 251 or •2 per cent. Jains, 2 or •001 per cent. Parsis, and 1,141 or 1 per cent. miscellaneous. No Christian is plying agriculture. Again column 3 of the marginal table gives the proportions per cent. of the followers of -each religion that are following agricultural occupations. The Hindus who are more than 87 per cent. of the total population have 23 per cent. of their total population engaged in the four selected groups aforesaid. But minority communities have betaken themselves to agriculture to a less extent. Their urbanity varies inversely as the proportions per cent. of their population that are agricultural. Hence the conclusion that the minorities are less agricultural and rural than the majorities.
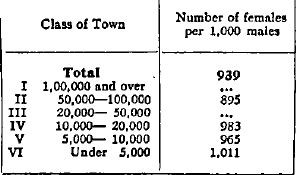
74. Sex Proportions in Towns.-Males outnllfnber females even in the -State where there are 945 females to 1,000 males. But the scarcity of females is more marked in urban areas than in the rural owing to the immigration of males for employment in non-rural occupations in towns. For, while the proportion of females per 1,000 males living in villages is 948, the similar proportion for the urban areas is 939. The figures in the margin supply the proportions of females in each class of towns. Roughly speaking, the higher classes of towns show a greater preponderance of males than females. The reverse tendency in
of towns like Umrala, the tendency towards emigration on the'part of whose male population has already been noticed before. Females are, therefore, found to -outnumber males, the ratio being 1,011 females to 1,000 males.
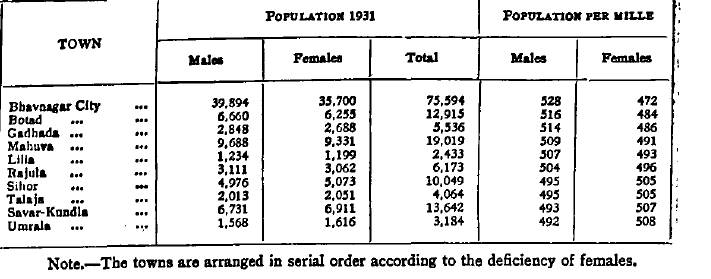
SEX PROPORTIONS IN TOWNS SP. SUBSIDIARY TABLE V
The sex proportions in the towns of the State are given in the Subsidiary• Table printed above. T~e nu.mbers of each sex in every thousand of the population in towns over 2,000 mhab1tants are shown. Both In the total and urban population males have.been obsen:ed .t~ outnumber fem~les. ~ut a separate and. mdependent examinatIOn of each mdlVldual town submits very mterestmg results. A tendency in the opposite direction is noticed in the towns of Sihor, Talaja~ U mrala and Savar.Kundla, where the females are in preponderance. The scarcityof the :nale population of Sihor is partially due to its being in the vicinity of theCity of Bhavnagar, whose active commercialization is bound to attract its ablebodied males for livelihood. Umrala has already been found to be a decaying town, its males moving outward for being occupied in Don-rural centres. The same is also the case with the stationary, though semi-progressive town of Talaja. But the progressive town of Savar-Kundla may be justly expected not to have fallen in line with the towns considered before. Because it is the usual tendency• of all growing towns to show a higher proportion of males than females and that of the decaying towns to show a higher proportion of females than males who• generally emigrate to great urban centres whose occupations offer them ready employment in commercial and industrial concerns. But the departure from theusual tendency in the case of Savar-Kundla should not warrant a conclusion that they do not attract people from villages. It must be doing so, otherwise it could not be progressive. But the excess of females over males is explicable by the• greater attractions held out to the energies and capital of some of its males who are induced to stir out for making money.
All the remaining towns show a scarcity of women. As will be seen later on, Bhavnagar has a very high ratio of males,_ Botad coming next with 516 males and 484 females in every thousand of its population. The preponderance of males is also an indication of the greater degree of urbanisation of these two towns. But the case of the temple town of Gadhada stands on quite a different footing. Its sex ratio shows that males outnumber females to a greater extent than that of any town except the two aforementioned_ The higher proportion of males in Gadhada should, in the absence of any urban development, be attributed to the existence of the temple of the Swaminarayan sect whose te!lets enjoin strict celibacy among the members of its spiritual order •. Mah~va, R~Jul~, and Lilia exhibit varying degrees of male preponderance. Finally, m consldenng the sex proportions, the towns of the State should be divided into two classes, ws., (1) the towns in which the males outnumber females and. (2) the towns in which the females outnumber males. To the former belong the City of Bhavnagar and the towns of Botad, Gadhada, Mahuva Lilia and Rajula' and to the latter the towns of Talaja, Savar-Kundla Sihor ~d Umrala. But there is no great disparity between the proportions or'the sexes except in the case of the capital whose male population shows a marked preponderance over females.
75. On account of its important position, the City of Bhavnagar should be accorded a special and separate treatment. The present population of the City is registered to be 75,594 01 which 39,894 are males and 35,700' females. The p('pulation of the revenue village of Juna Vadwa which has been completely absorbed by and forms a part and parcel of the City is included in its populatiolL .In it are also included the figures of the running and floating populations in railway <trains and on board the sea-going vessels whose enumeration called for special arrangements. The latter account for 735 and 346 persons respectively. More- over, the railway colony of Bhavnagar Para, popularly known as Gadhechi contributes 1,125 persons of which 614 are males and 511 females. Taking out the <figures of the superfluous popUlation belonging to the travelling public and to the Para, the population of the City proper or ' Smaller Bhavnagar' reduces itself to 73,388. But if the exact population of the' Smaller Bhavnagar' is to be obtained, still further deductions should be made in favour of the suburban development at the Takhteshwar Plot. Even subtracting the figures of the persons living at the Plot will not give an exact idea of the genuine population inhab,iting the City which was swollen by the temporary immigration of labourers and artisans at the works under construction for the celebration of the Wedding and Installation of His Highness the Maharaja Saheb.
But if an exact idea of the growth of the capital should be had, the figures •of • Greater Bhavnagar' as including the suburbs of Bhavnagar Para and Takhteshwar Plot should be taken into account. The figures of 'Smaller Bhavnagar' . are of use only in considering the congestion in the City areas. Though a proper statistical guide in this direction can be obtained only from a tenement Census carried out for the purpose of finding'out the pressure of population on the houseroom available, other signs, both direct and indirect, are not wanting to supply a proper clue to the existing congestion.
76. Density.-An examination of density and other circumstances will throw the necessary light upon the overcrowding in the City. Its density is 2,800 persons to the square mile. These figures for the area included in the revenue village of Bhavnagar are indeed very high. Moreover, it is an open secret that the heart of the City and Vadwa are very thickly populated. The movement of the City population towards the outskirts at the Takhteshwar Plot also bears testimony to the prevailing congestion. The anxiety on the part of the people to desert filthy streets for well-ventilated and airy dwellings has found expression in the rapid development of the Plot area. There are vast possibilities for future •expansion at the Plot which alone can come to the succour of .the City dwellers to relieve the growing congestion. Given proper facilities and encouragement to the people to quit the overcrowded City locality, the problem appears to be quite •.easy of solution.
77. Movement of the City Population.-Unlike any other urban area, the City of Bhavnagar has been showing steady and continuous progress. It has, of course, suffered some negligible losses in years of famine, pestilence and influenza, but they have been far less than in the case of the State, or any of its
Mahals or towns. A reCensul
ference to Subsidiary Table VI and to the figures marginally quoted demonst' rates that while 'at the Censuses of increase, the increase in the population of the City has been proportionately greater than that of the State,
in the years 0 f dec rease, i, ts losses ; have been- correspondiJ;Jgly- less. - It
betokens a state of &
healthy urban prospe:ity
enjoyed by the cap.tal,
and testifies to its grea- ,
ter resisting power. In
1901, when the general
population of the State ,
was subjected to a loss
-of 11-7 per cent. by the
ravages of the Chhapa- S nia Famine, the decrease in the population •of the City was only 2 . 4 per cent. Influenza and 1'Iague which were joint'/
ly responsible for a 40 decrease of 3•5 per cent.
in the State population, ~,
affected the City popula- 3
tion by •4 per cent. only
in 1921. At the present
Census, as against an
increase of 17 per cent.
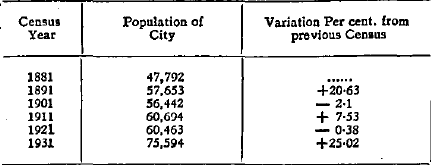
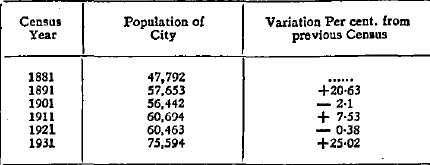
in the total population of the State, there is an increase of 25 per cent. in that of the City. In 1881, its population stood at 47,792 and rose as high as 60,694 in 1911. But to-day it is
S at its highest with co • 0 75,594 and claims 50 II to .,
per cent. of the urban -
and 15 per cent. of the total population of the State. :rhe variati?n in the population of the City since 1881 is shown by the diagram 10 the margm.
78. The past decennium is responsible for a greater part of the increase in the City population. This will be clearly understood by carefully studying the following Subsidiary Table.
, . Since 1881, the City shows a net increase of 27,802 or 58 per cent. In other words, to every ten thousand of its population, the City has added 5,817 during .the last fifty years. The past decade alone registers a net increase of 15 131 or
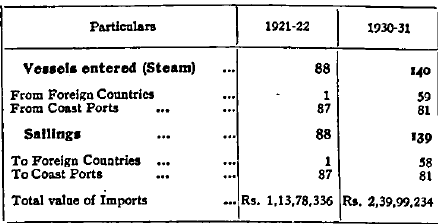
25 per cent. upon its population as returned in 1921. 'The intensive com-• Particulars Vellel. entered (Steam) From Foreign Countries From Coast Ports ... Sailing. ... To Foreign COlllltries ... To Coast Ports ...
mercia! growth of the City as a result of the growth of its trade will be evidenced by the marginal statement which compares . the number of sailings to and from the Port of Bhavnagar and the value of its imports in 1921 with those in 1930. The figures. speak for themselves and need no comment. With the added facilities of transport and railroad communications, it has succeeded in securing to itself the favoured position of a great emporium of trade. Its mill industry has alsosubstantially advanced. Being a capital town, it is the centre of all the important State Offices. It is also the head-quarters of the military and police. Being all' important centre of education in Kathiawar, students from and outside thePeninsula come here for prosecuting higher and collegiate studies. The Dakshina Murti Bhuwan is a great attraction to those who desire to tread the unheateD paths of educational activities on the lines of the Montessori and• Dalton systems. The world-wide economic depression has driven home the local emigrants to thebig industrial and commercial centres which had induced them to stir out during the boom period. The combined effects of all these causes have been to give to• the City of Bhavnagar an increase of 15,131 persons at the current Census.
79. Composition of the City Population.-The growth of the City in the light of the figures of percentages of variation since 1881 has been followed. Unlike the rural popUlation, natural causes alone are not responsible for the growth of the town population. Migratory currents playa very important part in determining the growth and development of urban areas. The City has at the present Census risen to the full stature of a great urban centre and fully partakes of all its characteristics. Subsidiary Table VI shows the sex ratio to be 895 females to one thousand males. Out of every thousand persons living in the City, 528 are males and 472 females. The disparity of the sexes is striking and at once noticeable. The influx of immigrant labour, especially of males who find employment in commercial and trading occupations, reduces the proportion: of females who are very often left behind in villages or towns. Sometimes the males come alone; sometimes the females are brought after the former settle.
Moreover, the urban occupations involving greater manual labour offer fewer opportunities for the employment of females than males. The extent of immigration to the City, however, can be seen from the fact that 16•5' per cent. of the City's population consist of outside immigrants. In spite of a fair proportion of foreign element in its population, the healthy character of' its urbanisation is disclosed by the sex ratios of the native born and the foreign born. While there are 890 females to 1,000 males born in Bhavnagar, there are 917 females per one thousand males born outside Bhavnagar. The proportion of females is considerably higher in the case of persons born outside the State. It indicates .that most of the immigrants come and settle in the City with their families. But the greater scarcity of females in the case of the native born is, however, due to the custom of receiving in marriage girls born outside Bhavnagar. 80. Summary.-The past decennium has witnessed an 'extraordinary rise' in the population of the City of Bhavnagar which was promoted by various. causes, the chief among others being the unprecedented expansion of its trade and commerce and the growth of its harbour. The increase which is 27,802 or 58 per cent. within half a century by no means points to an ordinary rate of growth. The City has to-day become an emporium of trade and a rising and prosperous. distributing centre.
81. Village how far a Unit of Reaideuce.-R!l:aI popul:,-tion m~ 'the population living in places other than towns and CIties, that IS to say m villages. The term' village' has been defin~ b~ the Census Code 1? mean the revenue village and not the separate resIdential hamlet. A village may be either inhabited or deserted and may consist of more than one inhabited place para or hamlet situated within the administrative area of the revenne viI1ag~. In the Mahal of UmraIa, Thapnath and DhoIa Vishi are inhabited places but not villages and are, therefore, treated as hamlets of the parent villages Chogath and Dohla. The revenue villages of Juna Vadwa and Jaswantpara h;ve no separate existence and are wholly absorbed in the City of Bhavnagar and the town of Kundla; whereas Mahadevpara, Kachotia, Ratanpar, and some others have become deserted. Yet all of them are treated as separate revenue villages. Further, a revenue unit is ~ot necessarily the same ~ a cadastral unit which is based upon the convemence of the survey authOrIties.
The revenue unit is, on the other hand, based upon the convenience of the revenue admini:;tration. But no great divergence between the village as a revenue unit and village as a unit of residence exists in the State as in the Province of Bengal where there is no unit of population which can ordinarily be described as a village. Barring certain exceptions, viz., of nine deserted villages shown in the note appended to Imperial Table III and the two inhabited villages •of Juna Vadwa and Jaswantpara merged into the revenue villages of Bhavnagar and Kundla, the villages of Bhavnagar State are all residential units. The note referred to above also contains a statement of seven inhabited places not treated as villages but which form part of the revenue villages. The discrepancy, if any, between a village in the Census or revenue sense and a village as a linit of residence is, therefore, negligible.
Out of 666 villages,' 655 are inhabited, if Juna VadWfl and Jaswantpara that have merged their identity into the neighbouring units be excluded. The cases of inhabited places not treated as villages have been noticed to be few and far between. The conclusion is, therefore, irresistible that a village is generally a residential unit, having a definite social and economic existence. This will be made still clearer, if we consider the vernacular equivalent of the village which means gama, grama or gamadu. All these terms connote places of habitation of a group of families who lead a common social, and economic life. These .residential units were found convenient by the revenue and survey authorities for .the administrative and settlement purposes and were adopted for their use with necessary I?odific~ti~ms. A para or hamlet me~s just the same thing as a gama, . but differs m that It IS a later growth and not mfrequently shares the economic . and social life of the parent village. This should be deemed to account for its 'not meriting a separate treatment and being treated as a part of the main village by t?e rev.enue authorities. The Census definition of a village as at present con~tltuted IS thus an attempt to accommodate itself to its popular verna. cular meamng.
82. Vi~ages in the 5tate.-There are in all 666 villages in the Bhavnagar .State. Leavmg out Juna Vadwa and Jaswantpara, the number of inhabited villag~ s comes to 655 ~ again~t 650 in 1921. It will be interesting to note that while Mahadevpara m the Slhor Mahal which was inhabited in 1921 has become .deserte~ since then, ~~dhi~ Juna, Savaikot, Ganeshgadh, Gundala and Kotada in DaskrOl, and Sagwadl m Slhor that were deserted in 1921 have become inhabited .at the curre~t Census. The new paras that have sprung into existence during the past decenmum. are Navagam in Daskroi, Kanivav in Sihor, and Krashnapara .and Navagam m Umrala. The coming into existence of new hamlets and lets in t~~ ":f~ vglages DOW .DUInusiber 671 owing to the treatment in the revenue accounts of five bam- dCDt villages. a uva-pnmo y shoWQ as subo-numbers of parent villages-as separate and indepeo56:
reoccupation of ol~ villages .besp~ak a s.tate of agricultural and rural prosperity, in
the absence of .whlch t?ere IS no incentive to the people from outside or to the
people settled In old vIllages to settle themselves into new paras or return totheir
original places of habitation. '
83. Di~gra~.-The urban and rural population of the State is compared in the follOWing diagram by Mahals. The inset compares similar statistics for
the State as a whole. The length of the black portion also measures the size of the ten towns of tl;1e State which are none other than the head.quarters of the Mahals except in the case of Victor, where Port Victor and not the town of RajuJa is the seat of the Vahivatdar.
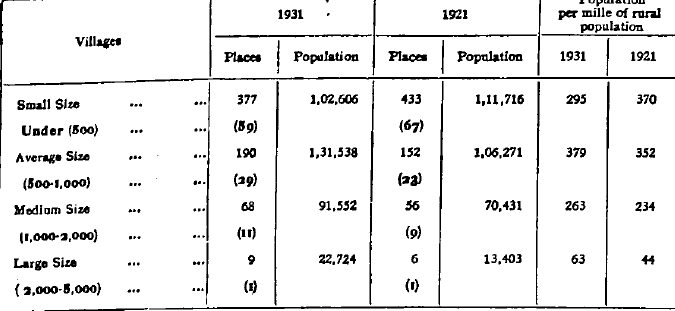
84. Villages classified according to PopulatioD.-The towns excepted, the total number of inhabited villages comes to 644; and the rural population is 3,47,665 or 69'5 per cent. of the total population of the State. Classifying the villages according to their population, they maY,be conveniently arranged into four groups of villages of (i) small size under 500, (it) average size with 50D-1,OOO. (iii)' medium size with 1,000-2,000 and (iv) large size with 2,000-5,000 population. The following statement compares the figures of places and population of each of these four types of villages. The figures in the brackets show the percentage which each type bears to the total number of inhabited places. The last two columns give the numbers per mille of the rural population living in each type of villages in 1921 and 1931. The small size villages are in a.)Ilajority and appropriate 377 or 59 per cent. ; average size villages 190 or 29 per cent.; medium size villages 68 or 11 per cent.; and the large size villages 9 or only 1 per cent. of the total number of inhabited places. But the average and middle size villages claim between themselves 2,23,090 or 64 per cent.. of the rural population. Out ,of every thousand of the rural population, 295 live in villages of small size, 379 in villages of average size, 263 in villages of medium size and only 63 in villages of large size. The greater part of the rural population lives in villages of the
500-2000 populatIOn. A companson between the figures of 1921 and 1931 discl~ an appreciable decline in the population and number of places of small. size. On the other hand, the population and number of the remaining sizes of, villages register a uniform increase. This is a clear indication of the promotion of the villages to a class higher than the one to which they belonged in 1921, as• a result of the growth of their population. The reduction in the number of sman. size villages and increase in the number of villages of the upper classes are a welcome sign of rural prosperity. The same result manifests itself in the com.• parison of the figures of the last two Censuses of the distribution of the rura.J. population between the villages of various sizes. While the number per thousand of the rural population living in villages under 500 has decreased from 370 to 295 .. that in villages between 500 and 2,000 has increased from 586 to 642 within the last ten years. The number and population of large size villages also show an increase, but their number (9) is very small. There is thus a great scarcity of large size villages with a population between 2,000 and 5,000.
85. Average Population per Village.-Taking the total number of in. habited villages including the towns which are 655, the average population per village comes to 531 souls. But taking all the revenue villages together, which are 666, the average population is found to be 522 persons per village. The average population per Village thus comes above the minimum limit fixed for an average village. This accounts for the aggregation of most of the rural popula. tion in the villages of average size, as also for the fall in the number and population of the villages of smaller size.
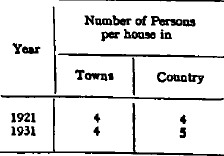
86. Occupied Housea.-The statistics in the margin compare the number of occupied houses in urban and rural areas in 1921 with those in 1931. While the urban increase is 4,484 or 14•8 per cent., the rural increase ~ounts to 5,856 or 8 per cent.
The corresponding increases in the urban and rural population are 22•5 and 8 per cent. respectively. The opposite table which compares the number of persons per house shows tbat while there are 4 persons living in a town house,. the corresponding number for a country, house IS found to be S. The latter figure points not ouly to a ~te of ~ prosperity, but alsobears ?ut the mferen<;e. amved at in Chapter I r:e~ding the greater dismtegration of the family life 10 urban tracts than in the rural. Number of Peno .. per hOUJO in
87. Mean Distance between Villagea.-The number of Census villages bas been found to correspond closely to the number of residential villages. It will, therefore, be interesting to calculate the mean distance between them, assuming each village to be a point. The formula will be:-
d' = 200 nv'3 Where d is the distance between each village and n is the number of villages in 100 square miles. Here n-22, as there will be 22 villages in 100 square miles. So according to the formula stated above and. worked out as in the foot.note,' the mean distance between the villages of the State is found to be 2•3 miles. They are thus in close proximity to each other.
88. The Village Economy.-The old order of the village economy has under the influence of the western civilization yielded place to quite a new and different order. It no longer maintains its former self.contained and self-sufficing character. Facilities of transport and extension of communications have breached the stronghold of the old village system by bringing the rural population in an ever increasing touch with the townsmen. The villager is attracted to urban areas by the growth of commerce and industries which provide him with more profitable employment in non•agricultural pursuits. These tendencies would suggest a decline in the proportion of the village dwelling population which is inevitable in view of the greater increase recorded in the urban population.
A comparison of the percentages of increase in the population shows that whereas the present Census registers an increase of 17:3 per cent. in the general population, the increases in the urban and rural population are 22•6 and 8 per cent. respect. ively. Again, as against 708, the persons per mille living in villages in 1921, there are 695 in 1931. The increase is not purely natural but is also due to the migration of the rural population to towns. But this should not be taken to mean that the villages are fast losing to the towns. Because the rural population already discloses an increase of 8 per cent. which is the normal rate of natural increase during a healthy intercensal period, and so all that can be possibly con• eluded is that the growing contact that has been established between town and •country has set into motion certain currents which are working for the dissolution of the s~atic condition of the rural society.
89. The Break•up of the old Village Economy.-The general transformation which the whole system has undergone can be seen in the altered outlook on life which inspires the present day villager. In days gone by, his wants were few' and comforts practically nil. But his increasing association with the town has now generated in him a desire to crave for himself certain comforts which his fore•fathers did not even dream of. What would then have become a luxury has now become an indispensable necessity. The modern villager is rebuked for his complete dependence for the supply of those articles which he once used to produce for himself. His two main necessities were food and clothing, and both these he produced by his own labours. This enabled him to lead a simple and
easy life. But now that he does not do so, the older folk deplore the use of fi~er
cloth which has taken place of the coarser and hand-made khaddar which
his family used to make for the use of all its members. While the villager under
the older system would walk away miles of distance, his brother of to-day travels
by rail or motor even for a distance of a mile or two. The ancient institution
of the Iframya or Village Panchayat which exercised a great hold upon the
village life, and enabled the village people to regulate their own affairs, administer
social and economic justice, and inflict condign punishment upon the offenders,
ha~ completely fallen into disuse. It was a system ~d upon mutual trust,.
respect for the elders, and co-operation among its members. But the forces of
disruption have appeared on the scene. What was once a sort of village family,.
presided over and governed by the council of elders is now showing separatist
and destructive tendencies under the influence of rival and jealous factions in
which the inhabitants of the village have arrayed themselves_ They no longer
lead that sort of communal life, in which every member contributed his mite
towards the well-being of the rest. They are no longer animated by the principle
of co-operation, service and sacrifice for the common good, but work under the
principle of every body for himself, and God for us all. In short, the rural life
as at present constituted is in the melting-pot, and has suffered a complete breakdown
under the stress of modern economic conditions. Reference must, however ..
be made to the efforts that are being made to rehabilitate the village economy.
by means of a special legislation promulgated in this behalf. It aims at making the villagers self-reliant and self-governing by the grant of local pancltayats. For,. as suggested at page 7 of the State Administration Report for 1929-30, "The grant of Panchayat .will mean the practical transfer of tbe wbole village administration. to the villagers themselve. witb tbe minimum of ontside interference. For, it vests tbe Pancbayat with tbe power ,to select and nominate persons of its own cboice for tbe village offices of Talati, Mukhl, Patel, Cbowkidars, etc., and tbe latter, tberefore, will be real servants and not masters of tb. village, rendering better, more loyal and efficient service. Tbis will also better' enable tbe Pancbayat to control and keep on tbeir proper behaviour, tbe bad and more intractable cbaracters in the village. In an extreme case tbe village can also ask for tbe removal from tbeir midst of, a particularly desperate and dangerous cbaracter, wbo cannot be tackled by tbe ordinary process of law." BHAVNAGAR STATE


