Women in politics: India
This is a collection of articles archived for the excellence of their content. |
Contents |
The status
1957- 2019
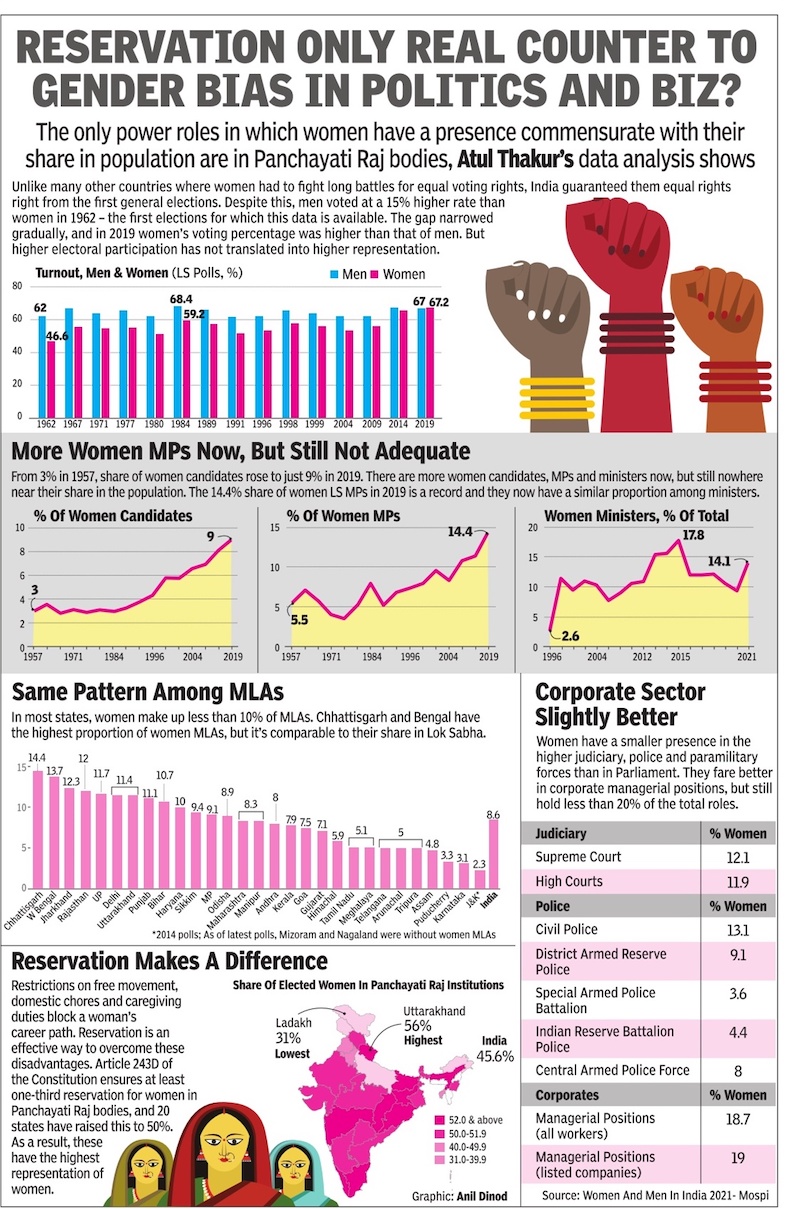
From: April 11, 2022: The Times of India
See graphic:
The status of Women in politics in India, 1957- 2019
Elected representatives
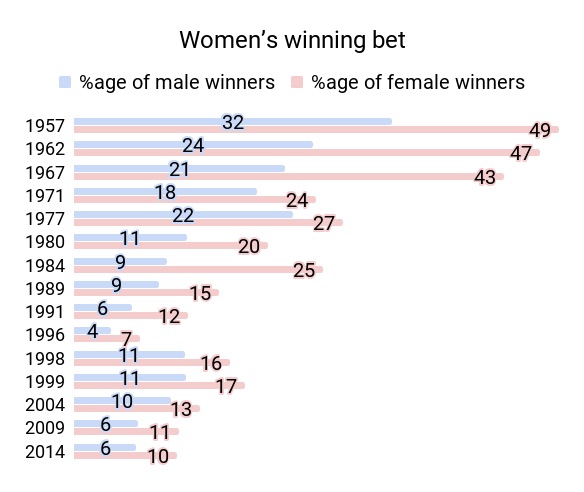
1954-2014: Women who won
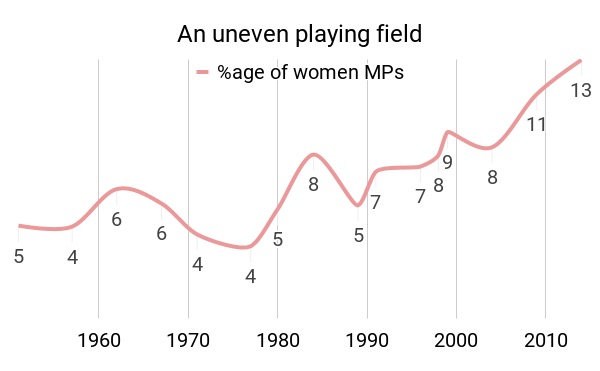
March 13, 2019: The Times of India
From: March 13, 2019: The Times of India
From: March 13, 2019: The Times of India
Dismal record: For a country whose constitution espouses gender equality, the proportion of female lawmakers in the lower house of the parliament has oscillated between a nadir of 3.50% in 1977 to a peak — or rather a mud mound — of 12.52% in the 16th, or the outgoing Lok Sabha. In fact, the last two parliamentary elections — for the 15th and the 16th Lok Sabha in 2009 and 2014 respectively — have seen the share of elected women MPs increase to over 10% of the parliament’s total strength of 543 members.
Winnable women: Women candidates have a constantly higher success ratio at the hustings than their male counterparts, with a greater proportion of women winning from among the total number of women contesting the elections, vis-a-vis their male peers. However, that could also be because of a fewer number of women candidates contesting polls — as the number of women candidates rise, their success ratio has also started decreasing from a peak of almost 49%, or nearly half of them, winning in 1957 to 10% in 2014.
The male skew: That parties still prefer male candidates to female candidates — unless they are confident of ‘her’ victory in a constituency — may be gauged from the fact that in the last election alone, in 2014, there were over 7,500 male candidates in the fray. This was almost twice the number of all the female candidates who have ever contested in Lok Sabha elections since the first parliamentary elections in 1951. (Un)fair enough!
2011, 2016 Assembly elections in 4 states
The Times of India, May 09 2016
Only 9% of women netas won in 4 state polls in 2011
While the number of women contestants has more or less stagnated in West Bengal, Assam and Kerala, in Tamil Nadu the number of women contestants has nearly doubled from 6% to 11% since 2011 assembly polls.
Though Bengal has a woman chief minister, only 10% of the tickets went to women in 2016. In Kerala, the number was even less, at 8%. Both states had the same percentage of women candidates in the 2011 polls. Assam improved its tally marginally , with the percentage of women candidates rising from 8% to 9%. The percentage of women winners in the four poll bound states was depressingly low in 2011. In the 2011state polls, the percentage of women who won was about 9%, according to National Election Watch. In Bengal, women won 33 of 285 seats (12%), while in Assam it was only 11% (14 of 126 seats). In TN, the percentage was even lower at 7% (16 of 225 seats) and in Kerala women won only 6% (7 of the 126 seats).
This news comes at a time when parties have acknowledged and are actively wooing the woman voter. This was first seen in the 2014 general elections when the percentage of women voters rose to 65.6% from 55.8% in 2009. The total voter turnout was 66.4%, up from 58.2% in previous polls.
The influence of women voters is reflected in the sops promised by parties, whether it is prohibition, maternity benefits or pension schemes.Tamil Nadu CM Jayalalithaa recently promised to increase financial assistance under a maternity scheme from Rs 12,000 to Rs 18,000, assured to double the quantum of gold for `tali' (mangal sutra), provide subsidy for women to buy scooters and train them to drive. In Bengal, Mamata Banerjee has promised a pension scheme for women and increase in the number of female police personnel.
In several states, women outnumber male voters. According to a report, states like Bihar, Rajasthan, Punjab, Odisha, Tamil Nadu and Uttarakhand have a burgeoning female population.
Women legislators in the Indian states: 2017
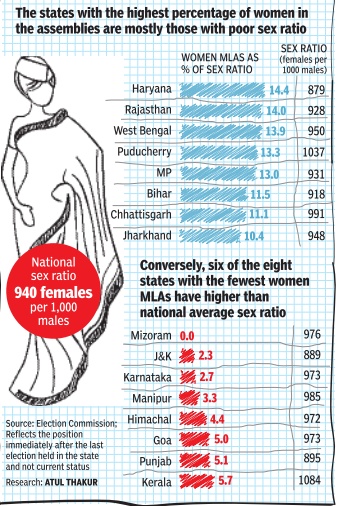
See graphic, 'Women legislators in the Indian states, 2017'
2017: candidates and voters
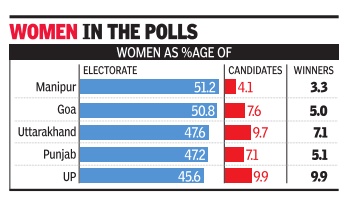
See graphic:
Women candidates and voters as a percentage of the total in the state assembly elections of 2017
Parties that field women the most
1996-2014
Chethan Kumar, Cong best in fielding women, BSP worst, March 14, 2019: The Times of India
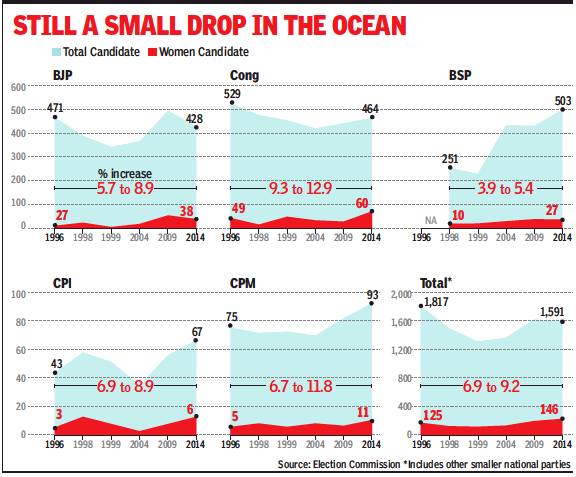
From: Chethan Kumar, Cong best in fielding women, BSP worst, March 14, 2019: The Times of India
13% Of Poll Tickets Is The Most They’ve Got
Mamata Banerjee’s Trinamool Congress has given 40% of its election tickets to women while Naveen Patnaik’s Biju Janata Dal has decided to set aside 33%, but most national political parties don’t walk the talk on women’s representation in Parliament.
It’s still early to say how many women each party will field this time but data from the past six Lok Sabha elections reflects a political unwillingness that is spread across the top five national parties — BJP, Congress, CPI, CPM and BSP.
An analysis of Lok Sabha elections from 1996 to 2014 shows none of them has given more than 10% of their tickets (all elections taken together) to women. In individual elections, some have exceeded the 10% mark. But no one is close to the 33% reservation in the Lok Sabha that women have been demanding for a long time.
Congress fielded the maximum number of women, both in terms of the absolute number and as a percentage of the total number of candidates the party gave tickets to. Mayawati-led BSP fielded the least number of women. Overall, the five national parties together fielded 9,174 candidates in six elections, of whom only 726 (8%) were women.
As for state parties, they fielded 252 women candidates in the six Lok Sabha elections combined. The number of women who got tickets from unrecognised parties and the number of independents was 649 and 1,109, respectively.
Ritu Singh, a former BSP member now with BJP, says, “There is a problem across parties, and as somebody who speaks on behalf of BJP as its spokesperson, I think women must get 50% of the tickets. In BSP, Behenji (Mayawati) herself did not do this. I have had several talks with her, but women never got the kind of importance in that party. Maybe, she was scared.”
On an average, Congress gave 1 in 10 tickets to women, while BSP had only 5% of its candidates as women. BJP and CPI each gave 8% of their tickets to women and CPM gave 9%. Of the 2,780 candidates that contested on Congress tickets in these elections, 286 were women. BSP gave tickets to 96 women among its 1,847 candidates, and BJP fielded 196 women in its pool of 2,490 candidates.
BSP spokesperson Ashok Siddharth says, “Where is the question of more tickets to women or less when our national leader herself is a woman? We are giving tickets to women everywhere, in Uttar Pradesh, Haryana, Madhya Pradesh, Rajasthan, Chhattisgarh and everywhere. You are comparing BSP with BJP and Congress. We are not just a political party but a movement.”
Election-wise analysis shows Congress has, in two elections, handed 11% of its tickets to women and it touched 13% in 2014. BJP and Mayawati-led BSP have never crossed 10%, while CPM crossed 10% at least twice in six elections.
Congress spokesperson Priyanka Chaturvedi, while conceding that women need better representation across the parties, says, “Women do not get a free hand, and the leadership often does not show confidence. The Congress was committed to 33% reservations for women and we know that the battle won’t end there.”
States that field women the most
1996-2014
Chethan Kumar, Their chances highest in Bengal, lowest in K’taka, March 14, 2019: The Times of India
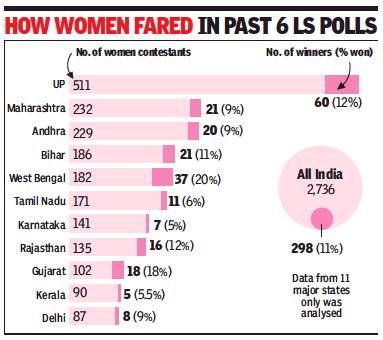
From: Chethan Kumar, Their chances highest in Bengal, lowest in K’taka, March 14, 2019: The Times of India
Trinamool Congress’s decision to give 40% of its election tickets to women is as much about strong political maths as it is about poll symbolism. An analysis of the past six Lok Sabha polls shows that Bengal is the best bet among India’s major states for a woman to get elected into Parliament.
The worst? Karnataka. In Karnataka, if women contested 100 seats, they would win in five, compared to 20 out of 100 in Bengal. Among the other nine major states — Gujarat, Rajasthan, Tamil Nadu, Kerala, Andhra Pradesh, Bihar, New Delhi, UP and Maharashtra — winnability of women candidates is the best in Gujarat (18 out of 100), followed by UP (12) and Bihar (11).
“Political parties need to effectively ensure that the participation of women increases by showing confidence in them. Unfortunately, a woman’s entry into politics is fraught with difficulties — from having to prove their credibility to showing they are capable of dealing with the system,” says Priyanka Chaturvedi, national spokesperson for Congress.
Overall, 2,736 women contested in the past six LS elections, of whom only 298 (11%) won. Among the losers, more than 76% (2,090 candidates) lost their deposit. In Karnataka, just seven women won of the 141 who contested these polls while 119 of them forfeited deposits and 15 secured their deposits but still lost.
MK Kanimozhi of DMK says, “Women in political parties are still expected to be under the control of men, which prevents many women from even entering politics. It is not enough that the leadership decides to give more tickets. The candidate would require support at the ground level to win. Unfortunately that is not happening, which is a reflection of how our society views women.”
Women in municipal corporations
Delhi
March 16, 2013: The Times of India
Civic seats fail to empower
The three municipal corporations in Delhi now have half of the seats reserved for women. The move to empower women got 156 councillors into the Houses in the 2012 elections against 90 women councillors in 2007. However, it turns out that increasing the number doesn’t mean their male counterparts would accept them as equals.
During a heated discussion on the inauguration of a road under-bridge on January 21, a male councillor of North Delhi Municipal Corporation had threatened and thrown empty water bottles at women councillors in the front row to hush them. The women councillors complained to lieutenant governor Tejendra Khanna and it was decided that 10 marshals would be deployed during meetings for their safety. However, nothing has been done so far.
The same corporations also have less than 20% women staff at the senior level while it has close to 60 such posts. Around 10-12 women head various departments, but there is only one woman additional commissioner in all three corporations. They comprise 35-40% of the total workforce.
The erstwhile MCD was never headed by a woman. Now, all three mayors are women. But this is due to reservation.
New Delhi Municipal Council has a woman, Archna Arora, as its chairperson but there aren’t many women directors. Of the 20 departments, women are heading just three while women comprise around 30% of the total workforce.
Women voters
Outnumbering men/ 2019

From: March 14, 2019: The Times of India
See graphic:
In 8 states Women voters Outnumbered men in 2019
See also
Women in senior corporate positions: India