Public Health And Vital Statistics: India
This is a collection of articles archived for the excellence of their content. |
Anaemia among women
2005>16: Slight nationwide improvement
Shivani Azad, 6 states show upswing in anaemia among women, January 30, 2018: The Times of India
See graphic:
% of women with anaemia in 2016, and change over 2005

From: Shivani Azad, 6 states show upswing in anaemia among women, January 30, 2018: The Times of India
2% Drop In Nationwide Figure: NFHS
While the prevalence of anaemia among women in the country decreased marginally by around 2% between 2005-06 and 2015-16, from 55% to 53%, six major states have shown a marked increase in the number of women affected, data from the recently released National Family Health Survey (NFHS) IV shows.
The rise in the number of anaemic women has been sharpest in Punjab, at 15.5%, followed by Delhi (10%) and Haryana (6.6%). According to the report, in the earlier survey, 38% of Punjab’s women were found to be anaemic, with the figure now at 53.5%. Similarly, 44.3% of Delhi’s women were recorded as anaemic in 2005-06, and the figure has since risen to 54.3%.
Incidentally, states which have strong health performance parameters like Tamil Nadu and Kerala also recorded an increase in the number of anaemic women. Nearly 53.2% of women in Tamil Nadu had anaemia a decade ago, and this increased to 55% in 2015-16. In Kerala, the figure rose from 32.8% to 34.2%.
The report says that in 21 of India’s 36 states and Union territories (UTs), over 50% of the women suffer from anemia. Jharkhand was the worst performer, with 65.2% of its women anaemic and 29.9% of its men. Among UTs (surveyed for the first time), Dadra and Nagar Haveli fared the worst, with 79.5% of its women anaemic. Interestingly, north-eastern states reported a dip in the number of anaemic women. For instance, 69.9% of Assam’s women were anaemic in 2005-06, with the figure now at 46%. In Sikkim, the figure has gone from 60% to 34.9%.
Uttarakhand, too, recorded a decrease, from 55.2% in 2005-06 to 45.2% in 2015-16.
2014-15, anaemia among women

From: June 26, 2018: The Hindu
See graphic:
Anaemia among Indian women, 2014-15
Antibiotic usage
2015
December 22, 2017: The Times of India
From: December 22, 2017: The Times of India
See graphic:
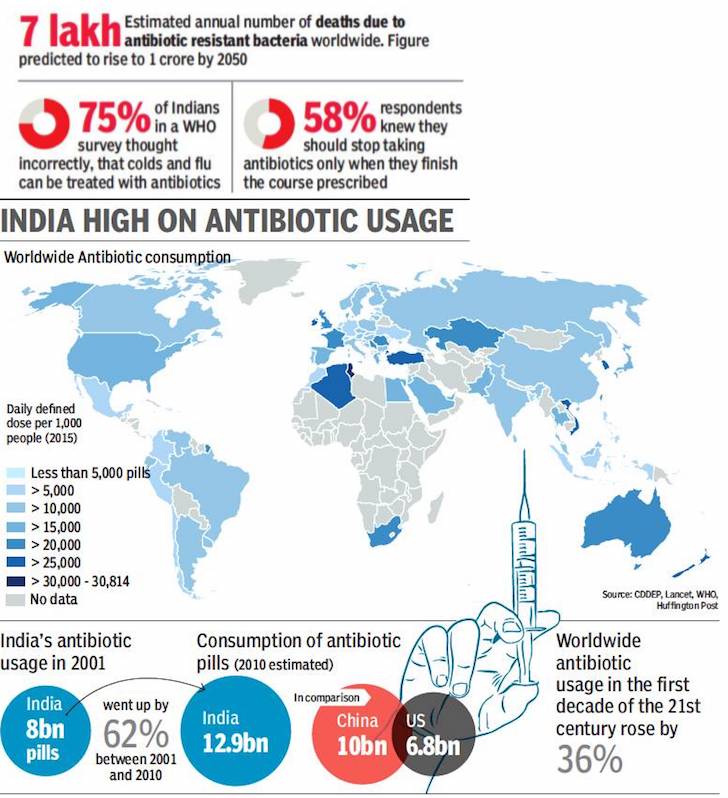
India and the world: Antibiotic usage in 2015
Anti-microbial resistance (AMR), or the resistance of infection-causing microorganisms to drugs that were originally effective for their treatment, is not a problem of the future but one that is unfolding with such an alarming ferocity that medical experts say it won’t be long before treating the simplest of infections becomes a nightmare while procedures such as organ transplantation and chemotherapy are rendered risky. India is especially at danger of an explosion of AMR.
Health indicators
2005 to 2015: significant improvement in health indicators
Sushmi Dey, India got healthier in last 10 yrs: Study , March 1, 2017: The Times of India
India's health indicators show significant improvement over the last decade with a decline in infant mortality complimented by a better sex ratio, more institutional deliveries and wider vaccine coverage.
The population rate is also a showing positive change, according to the new set of government data gathered during the fourth phase of National Family Health Survey .“The results show that if we invest and design good programmes in health, results will follow,“ health secretary C K Mishra said.
Haryana projected a commendable change in its sex ra tio at birth. While 762 females were born per 1,000 males in Haryana during NFHS 3 (2005-06), the ratio improved to 836 females per 1,000 males in the survey in 2014-15.
But the sex ratio at birth improved marginally nationally with 919 females born against 1,000 males during the fourth phase of the survey . During 2005-06, 914 females were born per 1,000 males. India's total fertility rate also declined to 2.2 from 2.7 over last decade, inching closer to the replacement level of 2.1. Overall, the level declined by 1.2 children per woman from NFHS 1 to NFHS 4. The data shows Uttar Pradesh showcased maximum decline in TFR, which dropped from 2.7 to 1.1in last eight years. Infant mortality rate declined from 57 to 41 per 1,000 live births between the third and the fourth phase of the survey. The institutional deliveries witnessed a dramatic growth of 40 percentage points from 38.7% in NFHS 3 to 78.9% in NFHS 4. Institutional births in public health facilities increased by 34.1% during the period.
The immunisation coverage across the country improved to almost 70% of fully immunised children at present from 44% in 2005-06.
India recorded a 10 percentage point decline in stunting from 48% during the third phase of the survey to 38.4% in the fourth round.Percentage of under-weight children declined from 42.5% to 35.7% in eight years.
C-sections falling in govt hospitals
C-section deliveries are increasing rapidly in private hospitals across the country, whereas public hospitals have recorded a decline over the last decade, shows data from the fourth phase of the National Family Health Survey. In private hospitals, C-section surgeries increased from 27.7% in NFHS3 to 40.9% in the fourth phase, whereas in public hospitals it declined from 15.2% to 11.9% during the period. Sushmi Dey TNN
The major ailments
1990-2016/ health hazards
Child and maternal malnutrition continues to be the biggest health hazard in India since 1990, while deteriorating air quality came a close second, according to a recent report in one of the world’s oldest medical journals.
The report published in the Lancet journal has found that besides malnutrition and rising air pollution, dietary risks, high systolic blood pressure and diabetes were other major risk factors in India in 2016. In 1990, air pollution was the third largest risk factor in the country but it moved to the second rank in 2016.
The report also analyses the variations in epidemiological transition – a change in mortality rates brought about by medical advancements – across Indian states. According to the findings, underdeveloped states, including Bihar, Jharkhand, Uttar Pradesh, Rajasthan, Madhya Pradesh and Haryana have recorded a low epidemiological transition level (ETL), and thereby suffer from a higher health burden from these risk factors.
Delhi may be one of the most polluted cities but it faces a marginally lower health impacts, when compared to states like Bihar. If calculated in terms of life years lost due to air pollution, or what medical experts call disability adjusted life years (DALYs), Delhi has a DALY rate of 1890, when compared to Bihar (4308) and Uttar Pradesh (4390).
A Centre for Science and Environment (CSE) researcher, who analysed the data for Delhi said, “Diseases that are triggered by air pollution including cardiovascular diseases, chronic respiratory diseases (COPD), and cancers have shown dramatic increase since 1990. In 1990 COPD was ranked 13 among leading causes of illness and lost life years. But this has now shot up to rank 3. Similarly, Ischaemic heart disease that is greatly influenced by air pollution has gone up from rank 5 to number 1, diabetes from rank 22 to rank 5 and stroke from rank 16 to rank 15.”
Explaining the reason for such variations, Bhargav Krishna, a research fellow at Public Health Foundation of India, said, “The population in these states may be suffering higher comorbidities – the presence additional diseases or disorders related to the main disease. The use of solid fuels, a major contributor to air pollution is also higher in these states.”
Medical experts led by the Indian Council of Medical Research (ICMR) and Institute of Health Metrics and Evaluation (IHME), who conducted the study, confirmed that number of death and disability caused by diarrhoea and other communicable diseases have declined, but diseases closely linked with air pollution and smoking, including heart ailments, have increased significantly.
Another report released by the Lancet Commission said each year over 9 million deaths occur worldwide due to air and water pollution.
Air pollution is at the top of the list contributing to over 6 million deaths. India remains one of the worst affected countries where 1.9 million premature deaths occur due to deteriorating ambient air quality.
The report published in Lancet has found that besides malnutrition and rising air pollution, dietary risks, high systolic blood pressure and diabetes were other major risk factors in India in 2016. In 1990, air pollution was the third-largest risk factor in the country but it moved to the second rank in 2016
2005-15: Heart attacks, lung obstruction, strokes
Together Account For One-Third Of All Deaths
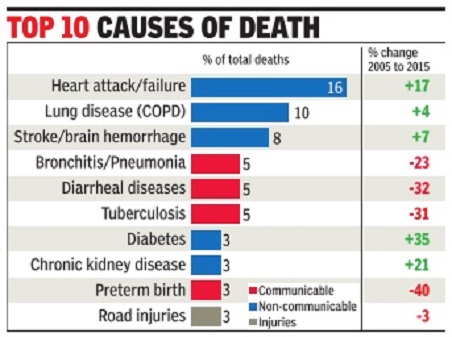
Heart attacks, lung obstruction and strokes are the three top causes of death in India, accounting for over one-third of deaths. Along with diabetes and chronic kidney diseases, they make five non-communicable diseases that are part of the top ten causes of death.
Communicable diseases in the top 10 include lower respiratory tract diseases like bronchitis and pneumonia, diarrhoea, TB and diseases occurring to prematurely born babies. Road injuries are the tenth most prevalent cause of death. Together, these 10 make up 60% of the 10.3 million deaths every year.
The even mix of communicable diseases and non communicable ones caused by organs failing due to age or lifestyle choices, puts India in the middle of a disease transition seen across the world.
These results are from the Global Burden of Diseases 2015, an estimation of 249 causes of death in 195 countries by an international team of researchers led by the Seattle-based Institute of Health Metrics and Evaluation, and published recently in Lancet. “With improvement in tre atment by antibiotics and better understanding, deaths by infectious diseases have declined while sedentary lives, longer lifespans and other lifestyle habits have pushed up the proportion of non-communicable diseases in India,“ said Dr Amit Sengupta, an expert affiliated to the Peoples' Health Movement. The persistence of three eminently treatable in fectious diseases and the lack of care in eliminating preterm baby deaths points to the still lagging healthcare system, as also lack of safe drinking water and sanitation,“ he added.
India's position in the middle of the transition from a poor, healthcare-deficient country to an advanced country is brought out starkly when compared with examples from such countries.In Niger, one of the poorest countries in the world, with a per capita gross domestic product less than one-fifth of India's, eight of the top ten causes of death are communicable diseases. At the other extreme, Norway , with per capita gross domestic product over ten times that of India, has just one communicable disease -lower respiratory tract infections -among its top ten, with the other nine being non-communicable diseases.
China, which started off from conditions similar to India, has moved much further towards the advanced end of the transition. It too has only one infectious diseases among its top ten causes of death.
Both India and China have road injuries as one of the major causes of death due to large populations and a rapidly growing number of vehicles on the roads. The large number of types of vehicles (from cycles and bullock carts to fast moving cars) also contributes to high number of road injuries.
A striking feature of India's death-causing diseases profile is that all the noncommunicable diseases are increasing while all the infectious diseases are declining compared with a decade ago. Diabetes as a cause of death has grown at a chilling 35% between 2005 and 2015, chronic kidney disease by 21% and heart attacks by 17% even as communicable disease deaths have dropped by 20 to 30% while preterm baby deaths dropped by 40%.
2007-16: The most widespread maladies: food deficiencies, TB

Diabetes Affects 5% Indians, Cancer 0.15%
It is common -and natural -to think of diseases in terms of death. Often, diseases are measured by death -so many people die of heart attacks, so many of dengue, etc. While this is important, there is another dimension not measured by body counts.It is the scale of suffering and pain felt by people who live with diseases.
Talk to any middle class urban Indian and they will know of somebody who has had cancer. So, is cancer wildly spreading in India? In the last decade, the number of people with cancer has increased 46%, one of the fastest spreads. Part of it is due to much better identification, part because of longer life, and a part also because of lifestyle and diet choices.
But here's the thing: Cancer affects 0.15% of all Indians and deaths due to it were 8% of all deaths in 2016. It's deadly , it's spreading, but cancer is nowhere near as prevalent as we perceive anecdotally .
The two health conditions that affect most Indians are nutritional deficiencies of various kinds, like protein, vitamin, iron and others -about 46% of the population suffers from this affliction -and tuberculosis, which affects nearly 39% of the population. Heart and blood circulation related diseases and diabetes are two examples of really big diseases in India. They are also non-communicable like cancer, that is, they don't spread through external agents. Heart diseases affect 5.5 crore people and diabetes some 6.5 crore. Both cause huge loss to quality of life and limit the ability of patients to lead a productive life. Death rates are much more in the case of heart diseases, as they affect seniors more and treatments are expensive. Diabetes causes suffering and if neglected, death.But only about 3% of deaths are due to diabetes in itself.
This emerges from the recently released 2016 edition of the Global Burden of Disease data in the medical journal Lancet, and made available spanning several years by the Seattle-based Institute of Health Metrics and Evaluation. Indian data is collated from domestic surveys, registries, cause of death data and unit level SRS data recently made accessible by the government to GBD.
Two health conditions that are incredible in scale and sweep in India are none of the above. The biggest debilitating health condition is nutritional deficiencies of various kinds like protein, vitamin, iron and others. Over 60 crore people, or about 46% of the population suffers from this affliction.Lethargy , exhaustion, weakness, inability to concentrate are some of the common and preliminary symptoms. In children, it causes serious damage to both mental and physical growth. This is a completely `curable' condition because just a better diet would eliminate most of it. Over the past decade, it has increased at 8%.
Another big ticket disease is TB affecting nearly 52 crore people (39%). Although death rates have declined by nearly a third, TB's spread has increased by 20% in a decade. Infections, including those that cause diarrhoea or coughs, cause immense suffering to over 8 crore people (6.4%). Many other diseases are very widely spread, like skin diseases and neurological diseases.Gynecological disorders and infant diseases are also common.Policy makers need to think about prevalence as much as deaths by these diseases.
2016, top 10 causes
See graphic:
Top 10 causes of deaths in India, and worldwide, 2016

The principal causes of death/ 2016

From: Lifestyle diseases biggest killer even in most backward states, November 15, 2017: The Times of India
From: Lifestyle diseases biggest killer even in most backward states, November 16, 2017: The Times of India
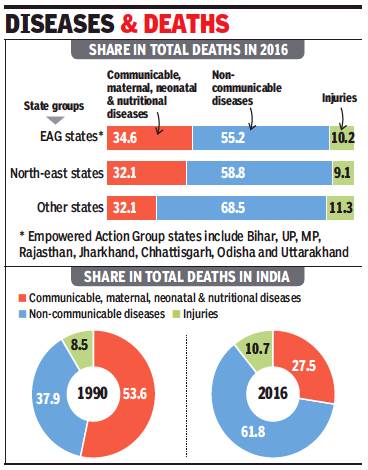
Lifestyle diseases like heart and chronic respiratory diseases now kill more people than communicable ones like tubercolosis or diarrhoea in every state in India, including the most backward. This was revealed in the India State-Level Disease Burden Initiative’s Report.
The report notes that while all states have thus made what’s called the ‘epidemiological transition’ there remain wide variations in their disease profiles with some having made that transition as early as 1986, and others as recently as 2010.
The first group to make the transition in 1986 included Kerala, Tamil Nadu, Goa, Himachal Pradesh and Punjab. The last group to do so, accounting for the highest number of people (588 million), made the transition almost a quarter of a century later, in 2010. This group included Bihar, Uttar Pradesh, Madhya Pradesh, Chhattisgarh, Jharkhand, Rajasthan and Odisha. India as a country made the transition in 2003.
The report studies the period from 1990 to 2016 and shows that communicable diseases constitute almost two-thirds of the disease burden in India from a little over a third in 1990. Despite the transition, which is associated with development, malnutrition remains the single top risk for health loss.
“While the disease burden due to child and maternal malnutrition has dropped in India substantially since 1990, this is still the single largest risk factor responsible for 15% of the total disease burden in India in 2016,” noted the report.
Diarrhoea, TB among top causes of death along with road injuries
The disease burden due to child and maternal malnutrition in India was 12 times higher per person than in China in 2016. Kerala had the lowest burden due to this risk among the Indian states, but even this was 2.7 times higher per person than in China.
The leading individual cause of death in India in 2016 was ischaemic heart disease, the death rate from which was twice as much as the next leading cause. But there were wide variations with the highest death rate among the states from this disease being 12 times the lowest. The other non-communicable diseases (NCD) in the top 10 individual causes of death included chronic obstructive pulmonary disease (COPD), stroke, diabetes, and chronic kidney disease.
Communicable diseases such as diarrhoeal diseases, lower respiratory infections, and tuberculosis, and road injuries and suicides were also in the top 10 causes of death. The death rates from diarrhoeal diseases and tuberculosis were also higher in the least developed states and had a 12-fold and seven-fold variation in rates, respectively, between states.
The least developed states that recently transitioned are having to grapple with having a higher burden of NCDs while they continue to have a high burden of infectious and maternal-child diseases, the report pointed out. The India States Disease Burden Initiative is a joint initiative of Indian Council of Medical Research, Public Health Foundation of India and Institute for Health Metrics and Evaluation in collaboration with Union health ministry.
Ischemic heart disease, top cause leading to death
Ischemic heart disease is the top killer across most states, November 15, 2017: The Times of India
From: Ischemic heart disease is the top killer across most states, November 15, 2017: The Times of India
Urbanisation, Aging Population Pose Major Challenge
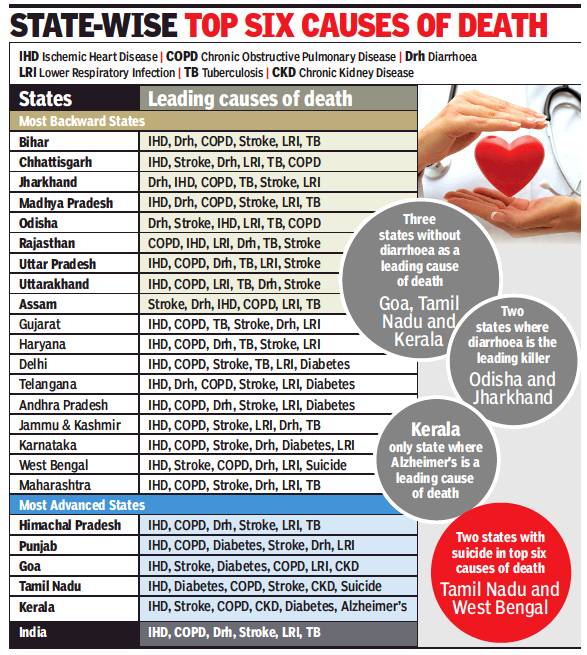
The first ever comprehensive estimate on state-wise burden of diseases brings out the wide variation in disease profile, burden and risk factors of the various states, many of them bigger than most countries in the world. From diarrhoea being the top killer in a couple of states to Alzheimer’s, a corollary of higher life expectancy, making it to a state’s leading causes of death the variation between states is huge.
While all states have transitioned to a disease profile where non-communicable diseases account for the largest share of diseases, barring Tamil Nadu, Kerala and Goa, diarrhoea, a disease of gross underdevelopment, is still among the top killers in every state. Another communicable disease, tuberculosis too continues to figure among the top killers in most states barring the southern states, and Goa and Punjab where it is diabetes which has climbed into the list of top killers.
What is uniform across almost all states is that ischemic heart disease is the top killer except in Assam where it is stroke and in Odisha and Jharkhand where it is diarrhoea. Overall disease burden by diabetes rose the highest in the country, by 174% in the last 26 years, followed by the burden of heart disease which rose by 104%. Jammu and Kashmir, Punjab, Uttarakhand and Haryana saw very high death rate from road injuries even if they did not figure among the top killers in these states.
“The findings show that the overall disease burden per person in some states of India is almost twice as much as in some other states, and the burden rate due to the leading diseases ranges five to ten times between the states,” said vice president Venkaiah Naidu on the occasion of the report launch.
The report identifies two factors that will pose a major challenge to the Indian health system in the coming decades — urbanisation and ageing of the population. All states have started seeing the effects of these two factors and many will see an acceleration of these as unplanned urbanisation picks up pace and life expectancy increases coupled with reduced cases of early deaths.
It remains to be seen how India and its states will cope with these looming challenges.
2017: Main causes of death
Cardiovascular Diseases Most Lethal Killers
Nearly 61% of deaths in India are now attributed to non-communicable diseases (NCDs), including heart disorders, cancer and diabetes, according to data released by the World Health Organisation (WHO) on Monday .Almost 23% of the population is at risk of premature death due to such diseases.
The UN agency has warned countries, including India, against premature deaths caused by NCDs and said governments must immediately step up efforts to tackle them. “Limited na tional progress has been made in the fight against NCDs -primarily cardiovascular and chronic respiratory diseases, cancers and diabetes -which are the world's biggest killers, and claim the lives of 15 million people aged 30 to 70 years annually,“ the WHO said.
According to the data, NCDs are responsible for 70% of deaths worldwide. In India, diseases like cancer, diabetes and heart problems were estimated to have killed a total of 58,17,000 people in 2016. While the percentage of deaths from NCDs is still lower in India as compared to many other countries, experts are concerned the burden is rapidly increas ing because of changing lifestyles and factors like pollution, and tobacco and alcohol consumption.
Four risk factors responsible for a significant proportion of these diseases are tobacco use, unhealthy diet, physical inactivity , and harmful use of alcohol. The major metabolic risk factors are obesity , raised blood pressure, raised blood glucose and raised blood cholesterol levels, the report says.
Cardiovascular diseases (coronary heart disease, stroke, and hypertension) contribute to 45% of all NCD deaths, followed by chronic respiratory disease (22%), cancer (12%) and diabetes (3%).
Cancer, diabetes and heart diseases alone account for 55% of all premature deaths in India in the age group of 30-69 years.
“Bolder political action is needed to address constraints in controlling NCDs, including the mobilisation of domestic and external resources and safeguarding communities from interference by powerful economic operators,“ said Tedros Adhanom Ghebreyesus, director-general of WHO.
Of late, the health ministry has initiated several measures to tackle the increasing burden of NCDs. For instance, the ministry has started a massive free doorto-door screening programme for early detection of cancer, heart disorders and diabetes. The programme, flagged off in February , aims to cover 200 districts by 2018.The government has also started schemes to set up cancer centres across the country. While 31 such hospitals have already been built, 49 more are to be set up by 2020.
Deaths of youths
The leading causes/ 2016
More young people in the age group of 15 to 39 years in the country died owing to suicides than any other cause last year, according to a report titled ‘India: Health of the Nation’s States 2017’, released by the Union health ministry.
The report, prepared by the ministry’s department of health research in association with the Indian Council of Medical Research (ICMR), Public Health Foundation of India and Institute for Health Metrics and Evaluation, found that “self-harm, which includes suicides and other nonfatal outcomes, was one of the leading contributors to the injury burden in India.”
As many as 18 of the states and Union Territories surveyed in the report recorded maximum deaths of youths due to suicide rather than diseases like TB, AIDS or cancer in 2016. Leading the list was Tripura, which recorded 25.2% of the total deaths in the age group of 15 to 39 years in 2016 due to self-harm, followed by Tamil Nadu (25%),Kerala
(24.4%), Karnataka (22.9%) and West Bengal (20.6%). Among other states with high suicide rates were Maharashtra (16.2%), Himachal Pradesh
(15.4%), Sikkim (14.6%), Meghalaya (14.1%) and UP (13.6%) Self-harm caused 29.8% more disease burden in 2016 than in 1990, according to the report which added that the trend had “increased among both sexes in the past 26 years although it was more among men than women.” The study indicated “lifestyle changes that come with a rapidly industrialising, urbanising society, from changes in diet and activity level to more traffic on the roads, were possible reasons behind the trend.
Lalit Dandona, distinguished professor at the Public Health Foundation of India told TOI that “further exploration on the reasons will be done in the next stage of the report which will be out in a couple of months”. Studies by other organisations in the past few years too have shown suicide as the leading cause of death among youngsters in India. The Lancet Commission on Adolescent Health and Wellbeing, in a study of 10- to 24-year-olds in the country in 2013, reported 62,960 suchdeaths.
According to the Global Burden of Disease Study 2013, that tracked deaths from 306 diseases, injuries and risk factors in 188 nations, suicide was reported as the biggest killer of 15- to 24-year-olds in India, followed by road accidents.
The report also lists road mishaps as a leading cause of death of the country’s youth population with north India reporting maximum casualties in accident deaths.
Diarrhoeal deaths
2014-18: an improvement
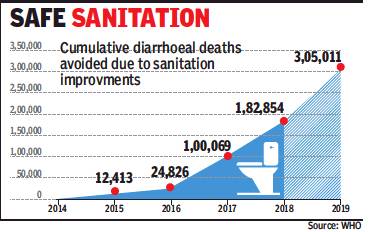
Dipak Dash, ‘Swachh mission saved 1.8L from diarrhoeal deaths’, August 4, 2018: The Times of India
From: Dipak Dash, ‘Swachh mission saved 1.8L from diarrhoeal deaths’, August 4, 2018: The Times of India
At least 1.8 lakh diarrhoeal deaths have been averted in rural areas since the launch of Swachhta Bharat Mission which primarily focuses on building toilets, the World Health Organisation (WHO) has estimated. The report projected saving of at least three lakh lives, if it achieves the October 2019 target of every household having access to sanitary toilets. The drinking water and sanitation ministry claims that till Friday, 89% houses in villages have got sanitary toilets.
“According to calculations, if all sanitation services are used, the initiative could result in over 14 million more years of healthy life in the period measured, with the benefits accruing yearly thereafter,” WHO said.
The drinking water and sanitation ministry said the achievement is remarkable given that before 2014 unsafe sanitation caused an estimated 199 million cases of diarrhoea annually.
The global public health body arrived at the numbers of life that may have been saved taking into account the data from the latest Rapid Survey of Children, National Family Health Survey and Swachh Bharat Mission. “WHO has not undertaken any primary data collection for the study. The figures used for sanitation coverage are assuming usage of sanitation services...,” it said.
WHO said the methodology used to estimate the impact is a “well-established” one and has been used for studies such as the Global Burden of Disease.
Diseases Eradicated
November 17, 2017: The Times of India
YAWS | Bacterial infection of skin, bone and joints
India first country to eradicate Yaws. In a 1952-64 campaign, 0.2 million cases were detected in Odisha, MP, Maharashtra, Andhra and Tamil Nadu
Eradication programme was launched in 1996-97 mostly in tribal and remote areas and the last case reported in India was in October 2003. India announced elimination in September 2006. Certification took another decade until July 2016
GUINEA WORM | Parasitic infection
Second disease after small pox to be eradicated from India
Eradication project launched in 1983-84 2/3rds of the cases were in MP and Rajasthan, which had India’s last case in 1996
The infection spreads via dirty stagnant water, shows as blister on lower leg, rendering the infected non-functional
Chad reported 11 cases in 2017
POLIO
India certified polio-free in March 2014, from over 50,000 cases in 1995 when it launched the campaign against polio
Efforts to eliminate global polio infection began in 1988. The global polio eradication initiative reduced polio by 99% — to just 8 cases in 2017: three in Pakistan and five in Afghanistan
SMALLPOX
First disease to have been eradicated globally, the world was declared smallpox-free in 1980
India eradicated smallpox in April 1977
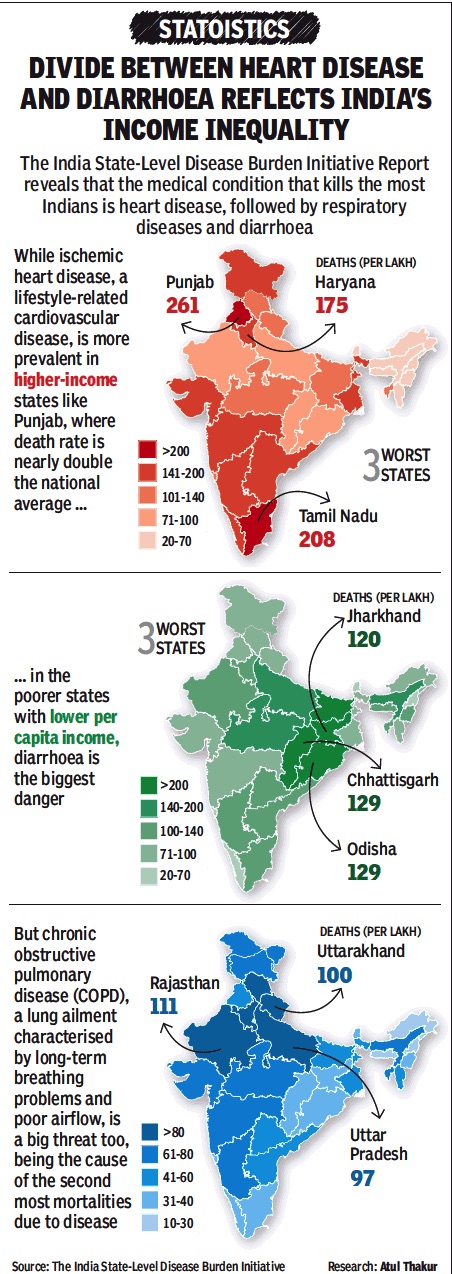
Heart disease, diarrhoea, pulmonary diseases
From November 27, 2017: The Times of India
See graphic:
The Indian states in which heart disease, diarrhoea and COPD pulmonary disease are most widespread, 2017
Lungs
Delhi children have poor lung capacity

From: Jayashree Nandi, Delhi kids have lower lung capacity than those in US, November 27, 2017: The Times of India
Not Just Genetics, Air Pollution Also To Blame, Finds Study
Children in Delhi have a far lower lung capacity and lung growth rate than kids of the same age in the US, according to a recent study by the department of pulmonary medicine at the Vallabhbhai Patel Chest Institute. While much of this could be attributed to genetics and nutrition, environmental factors like air pollution were also to blame, doctors who conducted the study said.
To develop more suitable guidelines for north Indian children, doctors from the Vallabhbhai Patel Chest Institute and the Department of Biostatistics and Medical Informatics, University College of Medical Sciences, conducted lung capacity tests on 670 healthy children (boys and girls) in the age group of 6 to 17 years of north Indian parentage and from a Delhi school selected randomly. The study found that, on average, the lung capacity of children in Delhi was 10% lower than those in the US or those of Caucasian origin. The rate of increase or the growth of lungs was also slow for children in Delhi compared to their US counterparts.
Until now, the results of pulmonary, or lung function, tests for children in India were compared with the American Thoracic Society-European Respiratory Centre spirometry guidelines. But according to the authors of the study, a correct interpretation of spirometry results — the most common test for management of lung diseases — comes from comparing the results of Indian children with the guidelines developed for healthy Indian children. Though several such guidelines have been developed for children in different regions of India, “most of these are now outdated and have limited utility due to technological advances in equipment and revisions in methodology”, the study stated.
The study advised pulmonologists and paediatricians to use comparative equations developed in India for correct interpretation of spirometry results. “Use of equations developed in other populations is not advisable for interpreting data of Indians, as it is likely to lead to substantial errors and, thus, adversely affect management decisions. This occurs because the Caucasian and Indian predictions of normal values differ substantially,” the study stated.
Dr S K Chhabra, who led the study, told TOI: “We developed our own model to understand lung function among children here. What we found is that by the time they reach 18 years of age, the lung capacity of both boys and girls is about 10% lower than American children. The lungs were also found to be growing at a slower rate; so, the maximum size they were reaching was smaller. A part of this could be attributed to ethnic differences, genetics, frequency of childhood infections and nutrition, but another reason could be environmental factors like pollution. There are many other studies, especially those conducted on Chinese children, which link retarded growth and lower lung capacity to air pollution.”
For example, a similar study published in 2010 in the journal of respiratory medicine in Science Direct found that children living in the most polluted district had significantly slower growth rates in lung functions than those from the least-polluted district.
Dr Chhabra added that the question on chronic effects of air pollution could be answered in two ways: “The first is to follow a group of children in two different environments over several years and compare their growth. Such studies have been carried out in several countries and suggest that children growing in polluted air suffer from reduced lung growth. To date, this has never been done in India,” he said. “Another way is to compare growth patterns in the population. The US models for lung growth in children have been developed using the national survey, NHANES III. My models, too, predict lung function in north Indian children. A comparison of growth patterns of Indian and US Caucasian children of same heights shows interesting differences. Both have nearly the same size till the age of about 8 years when the lungs complete their normal physical growth. However, subsequent growth in size shows a progressively increasing difference between the two countries with Indian boys and girls having lungs that are about 10% smaller when they become adults.
The environment ministry had recently stated that there was no conclusive evidence to establish a direct correlation of death exclusively with air pollution and that international studies should not be cited as reference to the impact of air pollution in India. Experts said it was high time the government paid attention to local health studies that established the dangerous impacts of air pollution. “These stark evidences prove that we have already compromised health of our future generation. Stop denial and the blame game. Speed up action on all pollution sources to meet clean air standards within a time frame,” said Anumita RoyChowdhury, head of Centre for Science and Environment’s clean air programme.
Menstruation and sanitary pad usage
2017: 62% of women use cloth
Shivani Azad, 62% of women on period use cloth, January 23, 2018: The Times of India

From: Shivani Azad, 62% of women on period use cloth, January 23, 2018: The Times of India
See graphic:
Most hygienic and unhygienic methods of menstrual protection, top 3 and bottom 3 states (National Family Health Survey IV)
Use Of Unhygienic Methods Highest In Bihar, UP, Chhattisgarh, Finds Survey
As many as 62% of India’s young women aged 15 to 24 years still use cloth during menstruation, the National Family Health Survey (NFHS) IV, whose findings were released recently, has revealed. According to the report, which pertains to the years 2015-16, as many as 82% of young women in Bihar still depend on pieces of cloth for protection during their menstrual cycle. In Chhattisgarh and UP, 81% of the women in the age group use cloth.
The survey sought to determine the percentage of women who used “hygienic methods” of menstrual protection, categorised as either locally prepared or other sanitary napkins, and tampons.
It was discovered that 16% of young women choose locally prepared ones.
The majority of women in rural areas did not use a hygienic method of menstrual protection, with the survey indicating that only 48% of the rural participants used sanitary napkins as against 78% in urban India.
The report suggests a direct link between education and wealth and the use of hygienic methods of menstrual protection. “Women with 12 or more years of schooling are more than four times as likely to be using a hygienic method as women with no schooling at all. Similarly, women from the highest wealth quintile are more than four times as likely to use a hygienic method as women from the lowest wealth quintile,” the report said.
Mizoram (93%), Tamil Nadu (91%), Kerala (90%), Goa (89%) and Sikkim (85%) fared well in terms of the use of the hygienic methods, while Maharashtra (50%), Karnataka (56%) and AP (43%) had a high percentage of women who use cloth. In Uttarakhand, almost 55% of young women use cloth, which, doctors say, may be making them prone to reproductive tract infections. “It is time that easy availability of sanitary napkins is facilitated, especially in remote areas, so that women’s health is not compromised,” said Dr Sadhana Chauhan, a senior gynaecologist who has worked extensively in the Jaunsar Bawar region of the state where cultural taboos prevent women from using hygienic methods of menstrual protection.
The problem is compounded by the fact that even though pads are provided to women at bare minimum prices by the government, they are often not given regularly.
Also, many young girls are too shy to ask for them from health workers designated to provide them. “The government should ensure that pads meant for us are given to one of the women in our locality, from whom we can take them without hesitation,” said Noor Jahan, an 18-year-old from Haridwar’s Pathri area.
Muscle health
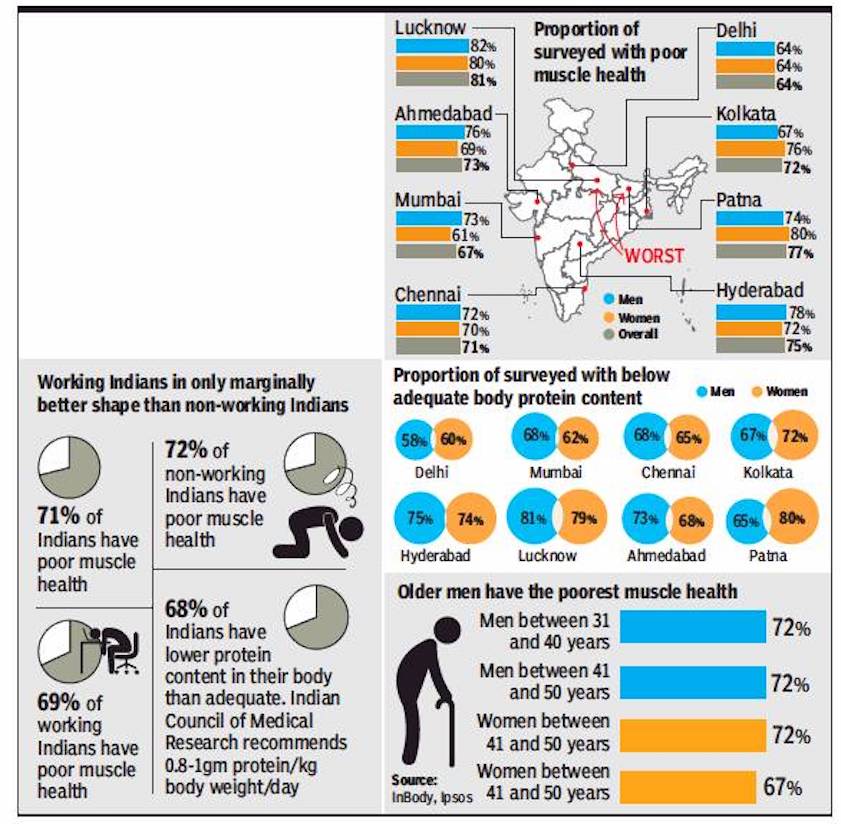
70% Indians: poor muscle health, low protein levels
July 23, 2018: The Times of India
From: July 23, 2018: The Times of India
Indians are neglecting their muscle health and falling short of the recommended daily intake for protein. A survey conducted by InBody and Ipsos of 1,243 Indians between ages 30 and 55 across eight cities found most Indians aren’t making enough room in their lifestyles or diets to take adequate care of their muscles
Polio
Polio-free India
India Today.in , Striding into the future “India Today” 15/12/2016
2014
Polio-free India
Striding into the future
On March 27, the World Health Organization (WHO) declared India free from polio, which Bill Gates described as "the greatest global health achievement that I have witnessed". The war was declared as won as the last reported case of 'wild poliovirus' in India was in January 2011. This was a leap forward for what was once known as the largest 'endemic reservoir of polio' in the world, registering between 50,000 and 100,000 cases of paralytic polio every year. It marked the culmination of a decades-long campaign: In India, large-scale polio vaccination began in 1978, with the Expanded Program on Immunisation, which by 1984 had covered about 40 per cent of the infants in the country. In 1985, with the launch of the Universal Immunisation Program, the cover was extended. The success of these two programmes was that reported cases decline from 28,000 in 1987 to 3,200 in 1995. Saturated coverage sustained by a multi-media blitzkrieg against polio with the launch of the Pulse Polio Immunisation Programme in 1995 contributed to its success.
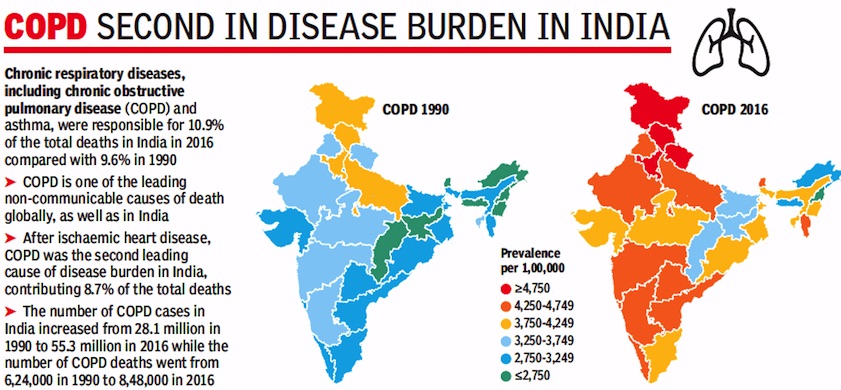
Respiratory diseases
1990-2016
From: September 13, 2018: The Times of India
See graphic:
Prevalence of Chronic respiratory diseases- Chronic Obstructive Pulmonary Disease (COPD) in India- 1990-2016
Sleep
Indians 2nd worst, after Japan

From: April 1, 2018: The Times of India
April 1, 2018: The Times of India
Urban Indians get by on roughly 6 hours and 45 minutes of sleep each night, which is roughly half an hour more than the workaholic Japanese but almost 20 minutes less than the Chinese, who are the only Asian nation to average more than 7 hours.
The Europeans, however, uniformly get at least 7 hours of shut-eye, and the richer nations manage sevenand-a-half hours or more. However, New Zealand is the sleep capital of the world with an average of 7-40. That’s the closest you can get to the textbook ideal of 8-hour sleep that is so important for health and productivity.
Vaccination
72% of children not getting vaccinated on time

From: Shivani Azad, 72% of children not getting vaccinated on time: Survey February 6, 2018: The Times of India
‘Immunisation Delayed In 73% Of Kids In Delhi’
According to the recently published National Family Health Survey (NFHS) IV, as many as 72.5% of children surveyed in the age group of 12 to 23 months, considered a crucial period in a child’s development and immunity-building, were not getting immunised on time. The report indicates that the situation is the worst in Manipur, where 96.5% children in this age group were not immunised on time. This was followed by Arunachal Pradesh at 90%.
Almost all the major states in the country have fared poorly in terms of ageappropriate vaccination, the survey reported. While UP has 87.2% children in this category, Maharashtra has 75.2%, Delhi 72.6%, Rajasthan 79% and Karnataka 70.2%. Uttarakhand, too, has fared poorly with 79% children not getting age-appropriate immunisation.
The timing of the vaccination, say health experts, is crucial in order to ensure that the child develops immunity for a given disease at the correct age.
Therefore, realising the need to monitor the administration of age-appropriate vaccination, a separate section was included in NFHSIV for the first time.
“Non-adherence to vaccination schedule is one of the reasons for high infant mortality rate in our country. In fact, the recent NFHS data also shows that the infant mortality rate in India is currently at a high 41deaths per 1,000 live births,” said Dr DS Rawat, senior paediatrician and former director general (health) of Uttarakhand.
Elaborating on possible reasons behind these high numbers, Dr Bharti Rana, Uttarakhand state immunisation officer, told TOI that geographically-challenging terrain and acute staff crunch may be probable causes especially in many Northeastern states which have shown a dismal performance.
Interestingly, the survey indicated that while the overall percentage of immunisation in the country in the past decade had increased from 44 % in 2005-06 to 62 % in 2015-16, urban parts of the country showed a mere 6% increase — from 58% to 64% while rural areas recorded an impressive 22% rise in vaccination of children.
The survey also revealed that there was an almost 1% increase in the number of children who received no vaccinations at all — from 5.1% in 2005-06 to 6% in 2015-16. Children in Meghalaya topped this list with 22.1% of the children surveyed in the state in the age group 12 to 23 months having never been vaccinated.
Vitamin D deficiency
The findings of a 2018 study
Sushmi Dey, Vitamin-D link to obesity, diabetes, June 26, 2018: The Times of India

what is vitamin D;
what we need vitamin D for;
food rich in vitamin D
From: Sushmi Dey, Vitamin-D link to obesity, diabetes, June 26, 2018: The Times of India
HIGHLIGHTS
Only 5.5% of women in the country have the vitamin in sufficient amount
The findings point to high vitamin-D deficiency among women in north India, particularly those in the lower socio-economic strata
Several studies in India have shown high prevalence of the deficiency and its association with obesity
Vitamin-D deficiency is leading to increasing incidence of obesity and diabetes among Indian women, according to a study in British Medical Journal (BMJ). Findings of the cross-sectional population-based study shows that 68.6% women in India are vitamin-D ‘deficient’, whereas almost 26% have been marked ‘insufficient’.
Only 5.5% of women in the country have the vitamin in sufficient amount. The study has been conducted by researchers from AIIMS, Diabetes Foundation of India and National Diabetes, Obesity and Cholesterol Foundation. Vitamin-D deficiency is a major public health problem worldwide. Several studies in India have shown high prevalence of the deficiency and its association with obesity.
However, the latest study concentrates on women. The researchers behind the study argue that women in India are more likely to have the deficiency as many of them are confined to households and have clothing patterns that reduce exposure to sunlight.
The findings point to high vitamin-D deficiency among women in north India, particularly those in the lower socio-economic strata.
“We believe these are very important observations. Given fast and severe worsening from pre-diabetes to diabetes in Indians, I believe a simple, cost-friendly vitamin-D supplementation would prevent diabetes in many women,” says Dr Anoop Misra, chairman, Fortis C-Doc, one of the authors of the study.
Walking habits, inactivity, obesity
2017: Indians 8th laziest among 46 nations
Table 1

From Large-scale physical activity data reveal worldwide activity inequality, Nature, journal,
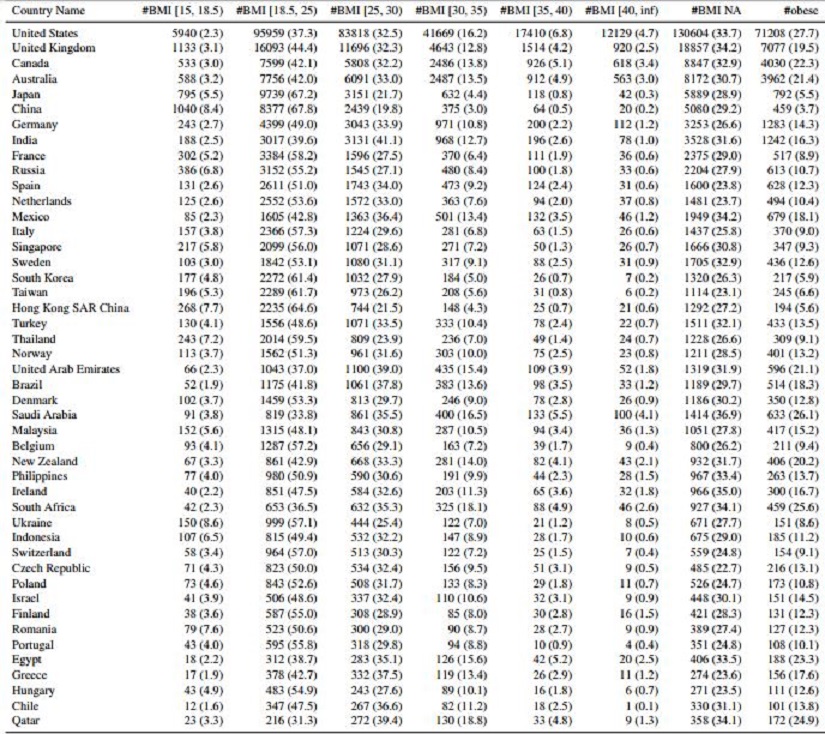
Summary of dataset statistics for the 46 countries with more than 1000 subjects (693,806 subjects in total; Methods). Countries are ordered by number of subjects in sample. Country-level analyses are restricted to these 46 countries. Percentages are in parentheses. NA refers to missingness in data. Table continued on table 2 with additional columns.
Table 2
From Large-scale physical activity data reveal worldwide activity inequality, Nature, journal,
Summary of dataset statistics for the 46 countries with more than 1000 subjects (693,806 subjects in total; Methods). Countries are ordered by number of subjects in sample. Country-level analyses are restricted to these 46 countries. Percentages are in parentheses. NA refers to missingness in data. (Continued from table 1.)
See also
Public Health And Vital Statistics: India post- 1947 statistics in general
Public Health And Vital Statistics, 1909: India
Public Health And Vital Statistics, India: 2014-2016
Public Health And Vital Statistics, India: 2016-2017
Healthcare and public health: Delhi
...and on several other states
