National Capital Region (India): Water
This article has been sourced from an authoritative, official readers who wish to update or add further details can do so on a ‘Part II’ of this article. |
Contents |
The source of this article
Draft Revised Regional Plan 2021: National Capital Region
July, 2013
National Capital Region Planning Board, Ministry of Urban Development, Govt. of India, Core-4B, First Floor, India Habitat Centre, Lodhi Road, New Delhi-110003
National Capital Region Planning Board
National Capital Region (India): Water
INTRODUCTION
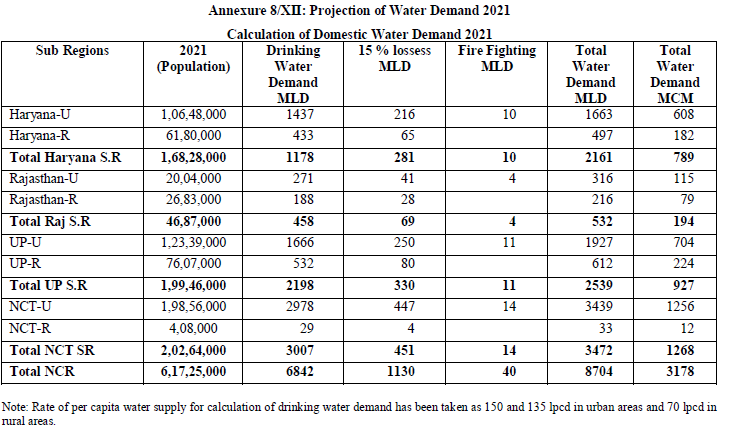
Water is a natural resource, fundamental to life and livelihood, agriculture and sustainable development. NCR is a water scarce region, dependent to a large extent on surface water sources located outside the region. The growing population of NCR from 371 lakhs in 2001 to 460 lakhs in 2011, which is expected to reach 617 lakhs by 2021, and the consequent rising demand due to urbanization pose serious challenges for the availability of water.
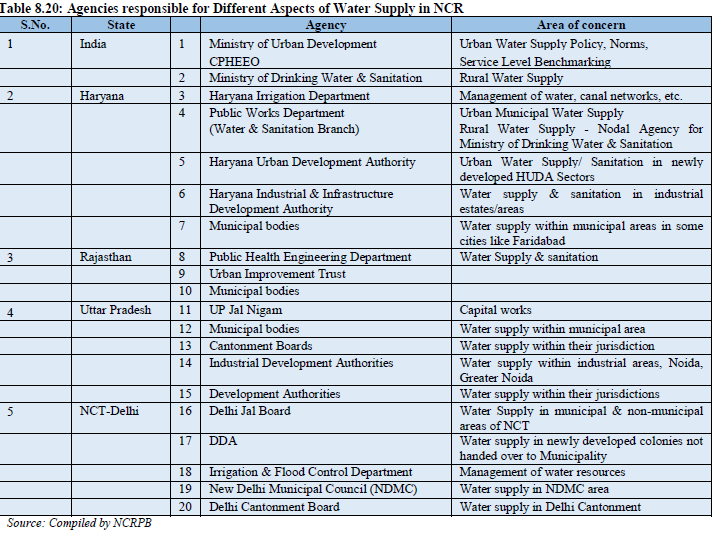
The draft National Water Policy 2012 emphasizes that integrated water management should be the main principle for planning, development and management of water resources. Access to safe water for drinking and other domestic needs and availability for irrigation and industrial use is crucial. Water management and supply is primarily a State subject, therefore the Constituent States of NCR have their own water policies and institutional arrangements.
The Regional Plan 2021 had proposed the preparation of a blueprint for water resources in the region. Accordingly a Study on Water Supply and its Management in NCR was conducted through Water and Power Consultancy Services India (WAPCOS) Ltd, and after discussions with the participating State Governments, a draft Functional Plan for Water for NCR based on the Study was prepared, which was recommended for approval of the Board by the Planning Committee of NCR Planning Board in 2011. A Functional Plan on Groundwater Recharge in NCR was prepared in 2009 by NCR Planning Board to assess groundwater resources in NCR and to guide the participating states on various aspects of ground water management in NCR.
WATER RESOURCES IN NCR: ISSUES AND CHALLENGES
In order to prepare the “Functional Plan for Water for NCR” i.e. “Integrated Water Management Plan for NCR”, an analysis of the complete hydrological cycle and water balance in the region, including rainfall and its components, groundwater, river water, floodwater, canals, lakes, wastewater generated, etc. was done in the Study on Water Supply and its Management in NCR and an assessment made of the available water for various uses.
8.2.1 Rainfall
Average annual rainfall in NCR generally varies from 500 mm to 850 mm. It is estimated that on an average, NCR receives about 22542 MCM/year of rainfall; about 75% is received during the monsoon season (July-September). Major non-monsoon rainfall occurs between December to March. Among the Sub-regions of NCR, Uttar Pradesh Sub-region receives the maximum rainfall. A part of rainfall infiltrates into the ground and recharges aquifers, and the remaining rainwater runs off to natural drains or rivers. Another part of rain water is lost to interception by vegetation, soil moisture and evaporation.
It is estimated that on an average, 15408 MCM/ year of water (68%) infiltrates into the soils of NCR, out of which infiltration of 11447 MCM/ year takes place during monsoon season (about 74%). Annual average soil moisture retained in NCR is estimated to be 10966 MCM/year. Maximum quantity of soil moisture is retained in Uttar Pradesh sub-region which is 4336 MCM/year, i.e. 39.54% of the total. The annual average ground water recharge due to rainfall in NCR is about 4247 MCM/year. Maximum amount of recharge, i.e., 2083 MCM/year, takes place in Uttar Pradesh Sub-region. Annual average interception and evaporation losses in NCR are estimated to be 1021 MCM/year. It is estimated that in an average year, 6113 MCM/ year of water is lost (un-used) as surface runoff from NCR, out of which as
much as 4584 MCM/ year takes place during monsoon season. Maximum surface runoff occurs from
Uttar Pradesh Sub-region. This surface runoff remains unused and flows down the natural drainage
system and joins the flood waters of river Yamuna and Ganga and finally flows into the Bay of Bengal.
The challenge lies in utilizing this runoff water locally in sub-catchments of NCR.
Groundwater
Ground water forms a major source of water in NCR. Monsoon and non-monsoon rainfall, irrigation during kharif and rabi season contribute to groundwater resources. A significant quantity of water is stored in aquifers and a part drains into rivers as base flow, the quantum of which depends on parameters like geological formation and hydraulic gradient. In addition to this annual recharge, a large quantity of ground water remains stored in aquifer formations as dead storage. Estimates of these for NCR are given in Table 8.1.
a) Present Utilization of Ground Water
Table 8.1 provides sub-region wise summary of ground water pumping for irrigation, domestic and industrial uses. As per CGWB, the stage of ground water development in NCR (ratio of annual draft to net ground water availability) in 2009 was about 103%, as compared to 61% for India as a whole. This shows that there is an imbalance between the net annual recharge and withdrawal in NCR indicating very clearly that groundwater withdrawal significantly exceeds the rate of aquifer recharge. Out of all the Subregions the situation is better in the UP Sub-region where the stage of ground water development is 79%, but that too is higher than the All-India figure of 61%. Therefore, ground water resources in NCR are under pressure due to over-exploitation.
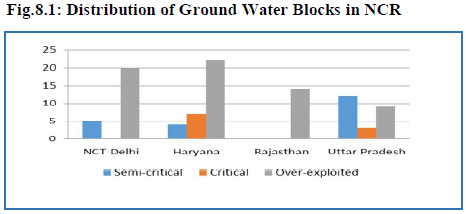
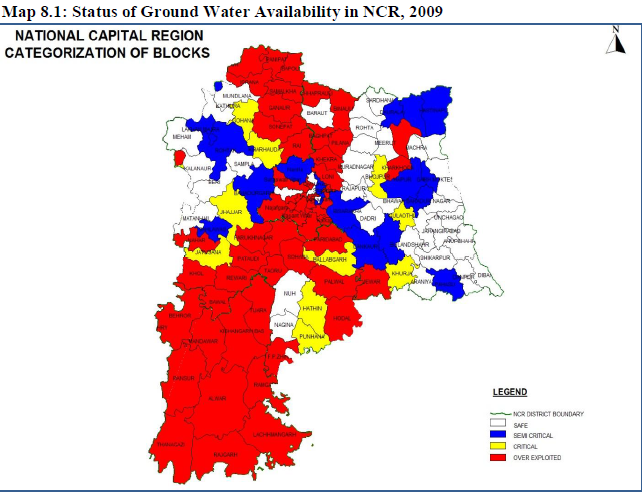
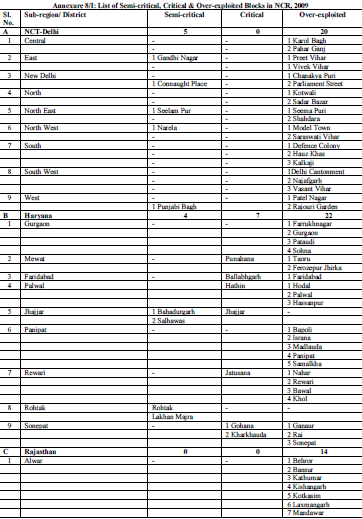
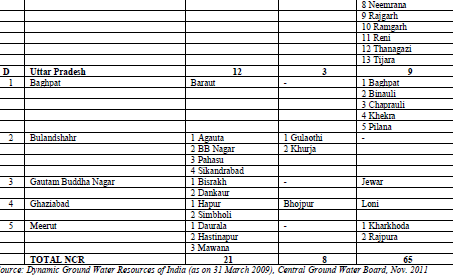
Based on stage of groundwater development, CGWB has classified groundwater blocks as safe, overexploited and critical. Table 8.2 and Fig. 8.1 show that there are 10 critical and 65 over-exploited blocks in NCR. The location of these blocks is shown in Map 8.1. A list of the blocks is in Annexure 8/I.
This clearly underlines the urgent need to increase the ground water recharge to compensate for the annual ground water withdrawal.
Ground water levels
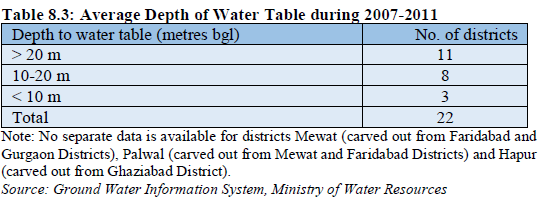
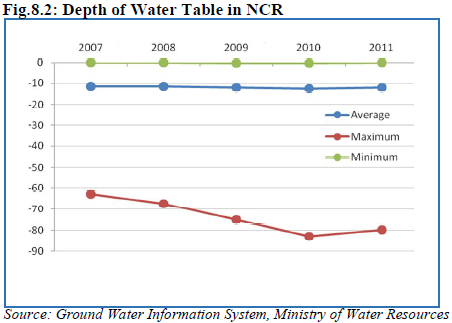
The depth of groundwater table (pre-monsoon) varies widely across NCR from about 0.1 m below ground level (BGL) to 80 m BGL. The minimum depth of water table has changed negligibly during the last four years of 2007- 2011 (from 0.08 m in 2007 to 0.10 m in 2011, while the maximum depth has increased from 62.76 m to 79.75 m (i.e 27.07% increase) during the same period (Table 8.3).
Average depth of water table during 2007-2011 varied between 11.43 m to 12.49 m (Figure 8.2). Deepest water table was recorded in Alwar (79.75m) followed by South Delhi (66.7m).
Sub-Region wise Ground Water Levels
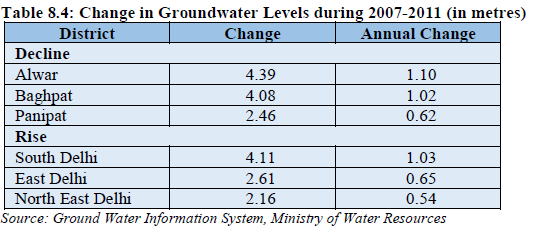
NCT Delhi: South Delhi district recorded deepest groundwater table (32.94 m average level) in 2011, followed by Southwest Delhi (15.6 m) and New Delhi (14.4 m). In other districts, groundwater table was in the range of 4.1 m to 9.2 m. Central Delhi recorded highest decline with a net fall of 1.4 m over a period of 4 years (2007-11) or 0.4 m fall per annum. The decline in average groundwater table in West, Northwest Delhi and New Delhi districts of Delhi was between 0.1 m per annum to 0.2 m per annum. The rest of the districts recorded rise in water table and maximum rise in average water levels was recorded in south Delhi (4.11 m during 2007-2011 or 1 metre per annum) (Table 8.4).
Haryana Sub-region: In Haryana Sub-region, Rewari District recorded deepest groundwater table (average 16.3 m), followed by Gurgaon (15.2 m), Panipat (13.5 m) and Faridabad (12.3 m). In other districts, groundwater table lay within a range of 4-6.15 m. In terms of temporal change in groundwater table, Panipat District has recorded highest decline with a net fall of 2.5 m over a period of 4 years (2007- 11) or 0.6 m fall per annum followed by Gurgaon (2.2 m or 0.5 m per annum). The other districts in Haryana Sub-region which recorded a decline in average groundwater table are: Faridabad and Sonepat (0.1 m and 0.2 m respectively). The rest of the districts – Jhajjar, Rewari and Rohtak recorded a rise in water table, with the highest recorded in Rewari (1.8 m i.e 0.5 m rise per annum).
Uttar Pradesh Sub-region: Baghpat District recorded deepest groundwater table in UP Sub-region (25.1 m average level in the district), followed by Gautam Budh Nagar (13.2 m), and Meerut (10.5 m). In other districts, groundwater table was within the range of 7.2 m to 8.3 m below ground level. In terms of temporal change in groundwater table, Baghpat District recorded highest decline with a net fall of 4.1 m over a period of 4 years (2007-11) or 1.0 m fall per annum followed by Ghaziabad (2.1 m or 0.53 m per annum) and Meerut (1.8 m or 0.5 m per annum). The other two districts (Bulandshahr and GB Nagar) in UP sub-region recorded a rise in water table, with the highest increase in Bulandshahr (1.3 m or 0.3 m rise per annum).
Rajasthan Sub-Region: Average depth of groundwater table in Alwar District was recorded at 27.1 m below ground level in 2011. During the last four years (2007-11), the district recorded a net fall of 4.4 m in average groundwater level from 22.7 m in 2007, at a rate of 1.1 m per annum.
b) Ground Water Quality
The Report on Ground Water Quality in Shallow Aquifers of India, 2010 published by Central Ground Water Board provides data on concentration of six principal parameters like TDS, Chloride, Fluoride, Iron, Nitrates and Arsenic, which are main constituents defining the quality of ground water in unconfined aquifers. The drinking water standards (IS 10500-1991, edition 2.2, 2003-09) stipulate desirable concentration and permissible of these parameters. The concentration of these in groundwater of NCR is presented below:
(i) Electrical Conductance (Salinity) - Electrical Conductivity (EC)/Salinity of the groundwater exceeds the permissible limit (3,000 μS/cm) in many parts of NCR, rendering the groundwater unfit for drinking. Of the cumulative 775 groundwater samples collected and tested during the period of 2007-2011 in NCR, 177 samples, about 23%, have shown EC values above the permissible limit. Highest value of Water 99 16,700 μS/cm was recorded in 2011 at Kair, in Southwest Delhi followed by Hiran Kudna in West Delhi (14,100 μS/cm). The districts affected by salinity in ground water in different sub-regions of NCR are shown in Annexure 8/II.
(ii) Chloride - Excess chloride content (above 1,000 mg/l) in groundwater has been recorded in 8 districts during 2007-2011. Of the cumulative 771 groundwater samples collected and tested by CGWB during the period of 2007-2011 in NCR, 71 samples, about 9%, have shown higher Chloride values (> 1,000 mg/l). Highest value of 4,396 mg/l was recorded in 2011 at Hiran Kudna in West Delhi. The districts having Chloride concentration above 1000 mg/litre in ground water in different sub-regions of NCR is provided in Annexure 8/III.
(iii) Fluoride – In NCR, of the 18 districts (8 districts in Delhi, 7 districts in Haryana sub-region, 1 district in Rajasthan sub-region and 2 districts in U.P sub-region) monitored by CGWB during the period 2007-11 for the presence of Fluoride in ground water, excess flouride content (above 1.5 mg/l) was recorded in 13 districts. Sub-region wise list of these districts is provided in Annexure 8/IV.
(iv) Nitrate – Out of total 18 districts, 16 districts where monitoring was conducted between 2007-2011, show excess Nitrate content (above 45 mg/l) in groundwater. Of the cumulative 718 groundwater samples collected and tested by CGWB during the period of 2007-2011 in NCR, 269 samples, about 37.5%, have shown Nitrate values above the permissible limit (45 mg/l). The districts having localized occurrence of Nitrate (>45 mg/Litre) in ground water in different sub-regions of NCR is provided in Annexure 8/V.
(v) Iron – Excess iron content (above 1 mg/l) in groundwater has been recorded in monitoring stations of 6 districts of NCR - 5 districts of Haryana Sub-region (Jhajjar, Gurgaon, Panipat, Rohtak and, Sonepat) and Alwar District in Rajasthan. The districts having localized occurrence of Iron (>1.0 mg/litre) in groundwater in NCR Sub-region is provided in Annexure 8/VI.
(vi) Arsenic – Arsenic has been recognized as a toxic element and is considered a hazard for human health. As per the CGWB Report on Ground Water Quality in Shallow Aquifers of India (2010), none of the districts in National Capital Region has recorded arsenic concentration in groundwater in excess of permissible limit (0.05 mg/l).
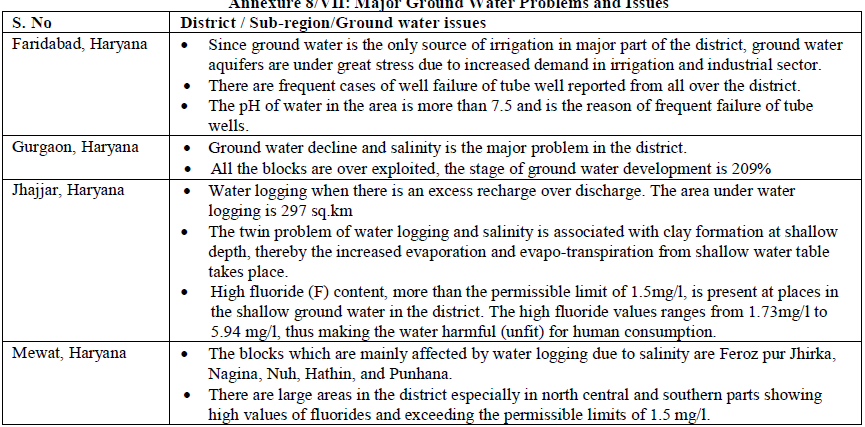
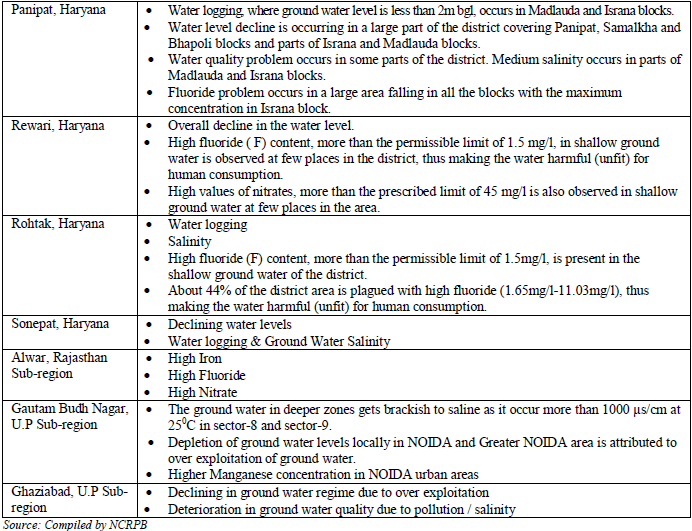
Major ground water problems and issues are given in Annexure 8/VII.
c) Static Groundwater Reserves
In addition to dynamic reserves, a huge quantity of ground water remains stored in aquifer formations as static reserve. This occurs at great depths and generally remains unutilized and not recharged over short durations such as annually. Present ground water reserves of NCR are estimated to be about 193700 MCM.
8.2.3 Surface Water: River Basins, Dams & Canals
Major storage reservoirs, dams and barrages that provide water to NCR are located outside the region in the upper reaches of the Himalayas on the Ravi-Beas, Sutlej, Yamuna and Ganga. A list of dams/barrages with their storage capacities and status is given in Table 8.5.
Lakhwar-Vyasi, Renuka and Kishau projects are “National Projects” for which 90% of the cost of irrigation and drinking water components will be funded by Government of India. As per information received from Central Water Commission, Ministry of Water Resources, Govt of India, Lakhwar-Vyasi Multi-purpose Project in Uttarakhand has received all clearances, and it is expected that water from the project may be available for NCR by 2021. The sharing of river waters of the Ravi-Beas, Sutlej and Yamuna between the riparian states is governed by various inter-State agreements. Table 8.6 provides interim seasonal allocation of water in river Yamuna among the riparian States as per the MoU of 1994. There is no specific allocation to NCR through this Agreement.
The Functional Plan for Water for NCR has estimated the unutilized flood water available in the subbasins that supply water to NCR and proposed its equitable distribution in NCR. Besides the above, there is a proposal for water supply to Alwar district from river Chambal.
8.2.4 Efficient Utilization of Canal Waters
The existing canal network carries water of the Bhakra-Beas, Yamuna, & Ganga systems to Haryana, UP, NCT-Delhi and some parts of Rajasthan. Western Yamuna Canal (WYC) and Agra Canal systems supply water to Haryana-sub region of NCR. UP sub-region of NCR is supplied water by Upper Ganga Canal (UGC), Eastern Yamuna Canal (EYC) and Madhya Ganga Canal-Phase I (MGC-I) systems. NCT Delhi is supplied water from Western Yamuna Canal system and Upper Ganga Canal systems. Presently Rajasthan sub-region of NCR does not get water from any of these canals. Major problems and issues that need to be addressed include 1) seepage from canals, 2) losses due to overflow from tail-clusters, 3) losses due to operations and management of canals, 4) shortages and surpluses due to variation in river flows and 5) loss of canal capacity due to ill designed rosters (details at Annexure 8/VIII).
8.2.5 Lakes and Ponds
In addition to the numerous ponds and lakes that exist in all districts of NCR, more prominent ones are Badkal, Damdama & Kotla Lakes in Haryana Sub-region, Najafgarh Jheel on the Delhi-Gurgaon border, and Siliserh in Alwar. A list of major lakes in NCR is given in Table 14.3 in the Chapter on Environment. Their capacity varies and some are used as sources of drinking water. The ponds near villages are used for cattle bathing, washing and other uses. The ponds can be utilized as surface storage reservoirs & ground water recharge basins. The role of ponds & lakes is becoming increasingly important since possibility of increasing water supply from rivers, upstream dams, ground water and other sources is increasingly becoming difficult.
Lakes/ponds have catchment areas and natural drainage systems (drains), through which they receive
water during monsoon. In addition, they can receive un-used canal water that overflows from the tail
clusters of canals when it is surplus/unutilized during monsoon or otherwise. During summer months, the
Irrigation Departments supply water to these ponds through field channels. However, there are problems
of siltation and consequent reduction in ground water recharge. Most importantly eutrophication in
lakes/ponds has become a major issue. Many ponds/lakes in NCR have eutrified and rendered out of use
and have become garbage dumping sites.
8.2.6 Use of Treated Sewage Effluent
Sewage Treatment Plants (STPs) are available at 19 locations in Delhi, 25 locations in Haryana Sub- Region, 2 in Rajasthan Sub-region and 18 locations in UP Sub-Region in 2011, the combined installed capacity of which is 3349 mld (details in the Chapter on Sewerage). STPs with additional capacity of 1122 mld are proposed to be constructed in the near future, which implies that 4471 mld treated effluent can be available for re-use. The treated sewage effluent can be used for irrigation, industrial cooling, air conditioning, etc.
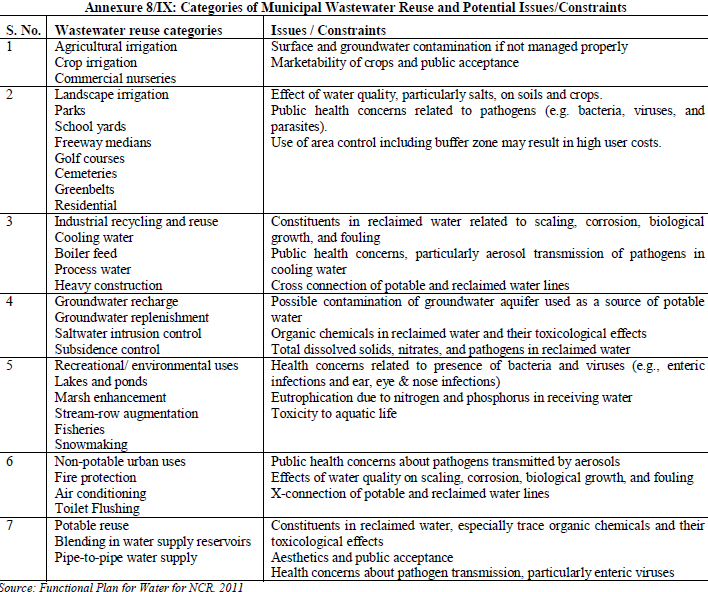
In order to plan and implement water reclamation and reuse, the proposed uses to which reclaimed water will be put will govern the level of treatment needed. Seven principal categories of municipal wastewater reuse are listed in Annexure 8.9 in descending order of projected volume of use along with potential constraints for their application. State Governments of NCR States need to notify specific policies in this regard.
8.2.7 Other Issues and Challenges
a) Effective Utilization of Irrigation Water through Irrigation Techniques
Flood irrigation techniques consume a large quantity of water, a significant part of which is either lost through evaporation, percolation or drainage. Therefore, there is an urgent need for using micro irrigation and water saving techniques such as drip and sprinkler system that simultaneously boost the production of food grains/crops.
The Functional Plan estimated that if 20% irrigated area is shifted from present flood irrigation technique to drip/ sprinkler systems, the water requirements of the region can be fulfilled with the current availability of water. Therefore, it is proposed that initially these techniques be adopted in 10% area in Phase-I (upto 2021), and another 10% in Phase-II (2021-31).
In order to impart thrust to efforts to increase area under improved methods of irrigation for better water use efficiency to provide stimulus to agricultural growth, Govt. of India has decided to implement the National Mission on Micro Irrigation (NMMI) for which guidelines have also been framed (refer website http://agricoop.nic.in/horticulture/Guidelines-NMMI.pdf). Under NMMI, 40% of the cost of micro irrigation system will be borne by Central Government, 10% by the State Government and the remaining by the beneficiaries from their own resources or as loan from financial institutions. Additional assistance of 10% of the cost of micro irrigation system will be borne by the Central Government in respect of small and marginal farmers.
b) Protection of Flood Plain for Ground Water Recharge
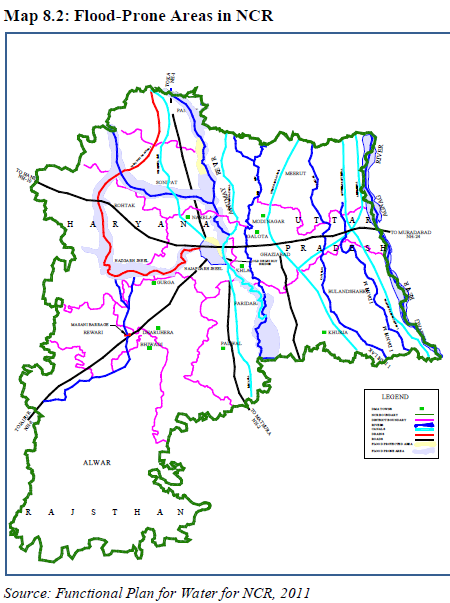
A potential source for increasing availability of water to NCR is large scale ground water development in the floodplains of the Yamuna, Ganga and Hindon and areas along Upper Ganga Canal (Map 8.2). These areas are underlain by high potential unconfined aquifer systems, which can be developed into sub-surface storages to conserve the monsoon flows and obtain sustainable water supply during the non-monsoon period. This may be done after appropriate technical studies so that critical/ over-exploited blocks are avoided.
The challenge lies in protecting these floodplains from development and creating sub-surface storages by recharging the depleted aquifers (subsurface storages) during monsoon using recharge structures like barrages, check dams and dykes, etc. and large scale ground water abstraction in the premonsoon season. It is estimated that an additional 3970 mld (1450 MCM/year) water can be made available in this way.
c) Utilization of Saline/Brackish Water Ground water is saline in several parts of NCR. This water is not being used, even for salinity resistant crops. Utilization of saline water after appropriate treatment/ blending can be another potential source of water for NCR.
DEMAND AND SUPPLY OF WATER IN NCR
Demand and supply for water can be broadly classified as i) domestic (including drinking water demand), ii) industrial and iii) agricultural. The demand-supply gap of water has been worked out for the NCR and strategies and plan of action have been recommended for meeting the gap.
8.3.1 Existing Status of Water Supply in NCR
a) Domestic water supply
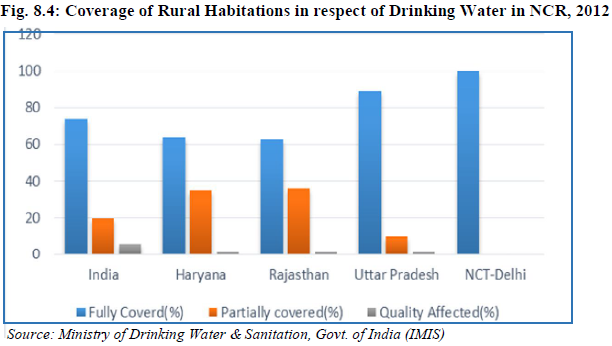
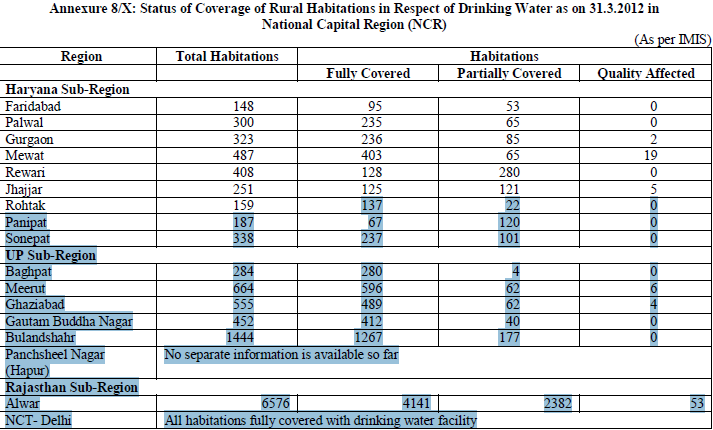
Drinking water has been accorded priority among water uses in successive National Water Policies. Data from Ministry of Drinking Water & Sanitation, Govt. of India shows that about 74% of all rural habitations were fully covered (defined as habitations with average supply of drinking water equal to or more than 40 lpcd) under National Rural Drinking Water Programme in April 2012. In Uttar Pradesh Sub-region, 89% of rural habitations were fully covered, while only about 63-64% of rural habitations were fully covered in Haryana and Rajasthan Sub-Regions (Table 8.8 and Fig. 8.4). Details are at Annexure 8/X.
Demand-Supply Gap
The availability of water from all known sources for NCR has been compared with the projected demand to calculate the demand-supply gap for 2021. The total demand-supply gap, subregion-wise for the overall water deficit in the NCR for the year 2021 is estimated to be 9688 MCM/year. Details are given in Table 8.16.
8.3.6 Water Tariffs in NCR
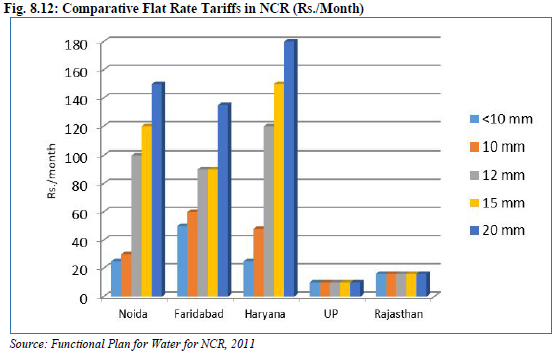
Low tariff rates for water supply do not encourage conservation resulting in wastage of water. Comparison of tariffs for various towns in NCR (Table 8.17) shows a considerable variation. Tariff rates in both UP and Rajasthan Sub-regions are very low, i.e. at an average of Rs 10 to Rs. 16 per month as
compared to Haryana Sub-Region where the rate is Rs.120/- per month for 12 mm connection. In Noida
and Faridabad, it is Rs.100/- and Rs.90/- per month for the same size connection. This indicates that the
tariff in U.P. and Rajasthan is subsidized (Fig. 8.12).
In case of volumetric tariffs, a comparison of Faridabad, Rajasthan, Delhi, Kanpur and Tiruppur (PPP Scheme) (Table 8.18) indicates that for 20-30 kl/month range (which would be the average for a family of five), the tariff ranges between Rs 2.50 to Rs 5.00 per kl.
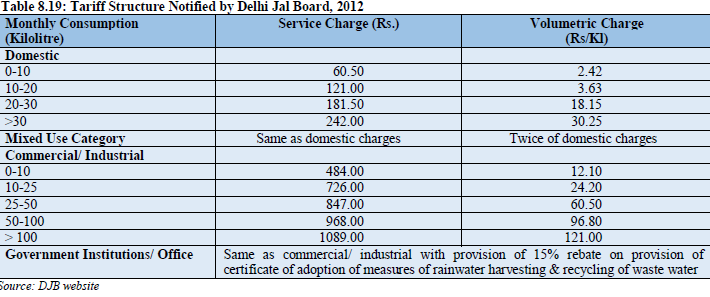
Delhi Jal Board has revised tariff structure from 1 January 2012 (Table 8.19). The structure consists of four categories of customers: domestic, mixed use category, commercial/ industrial and government institutions/ offices. Tariff is chargeable in two parts: a service charge and a volumetric charge. In addition, there is a sewerage maintenance charge. A provision for 10% enhancement of tariff every year has also been made.
Low tariff structures lead to a vicious circle of inadequate funds for operation & maintenance, resulting in
poor maintenance and unreliable water supply. There is a need to improve service and engage with all
stakeholders and communicate the true costs of production and distribution in order to overcome the
resistance to increased tariffs. In order to consider the equity aspects of tariff, there can be “lifeline”
tariffs for consumption of water below a certain fixed limit and volumetric tariff beyond that.
Explanatory Note:
As per the report “Dynamic Ground Water Resources of India (as on 31 March 2009)”, Central Ground Water Board, Nov 2011 has categorized the assessment units (watershed/administrative blocks) based on Stage of Development (Utilization) and the long term water level trend. There are four categories, namely – ‘Safe’, ‘Semi-critical’, ‘Critical’ and ‘Over-exploited’ defined as follows: Safe: stage of ground water development is less than or equal to 90% and there is no significant decline in water level. Semi-critical: stage of ground water development between 70% and 100% and significant decline in long term water level trend in either pre-monsoon or post-monsoon season. Critical: the stage of ground water development is above 90% and within 100% of annual replenishable resource and there is significant decline in the long term water level trend in both pre-monsoon and post-monsoon seasons. Over-exploited: the annual ground water abstraction exceeds the annual replenishable resource and there is significant decline in the long-term ground water level trend either in pre-monsoon or post-monsoon or both.
Annexure 8/VIII: Efficient Utilization of Canal Waters – Major Problems & Issues
a) Seepage from Canals
When water is flowing through canals losses occur due to seepage, evaporation, deep percolation, etc. Most of the above water is not really lost from use. A very significant portion of seepage gets stored in the aquifer formations. However, the water lost due to evaporation cannot be economically reduced or harnessed and hence no efforts are made to utilize this water. The canal water lost through seepage could be optimally utilized by lining stretches of canals where seepage is high.
b) Losses due to overflow from tail-clusters Since canals are designed as fail safe system so as not to cause flooding, canal escapes are provided at every cross regulator in main or branch canal systems. The measured records show that a very significant quantity of water escapes from WYC system, UGC system, EYC System, Agra Canal System and MGC-I system. Similarly, to avoid over-topping at tail ends of canals, all minors, distributaries, branch and even main canals are laid out in such a way that these end very close (10-100m) to natural drainage systems. Further, tail clusters, designed to discharge excess water without over-topping are provided at the end of every minor, distributary and canal. Due to the roster system, the water keeps flowing into canals even though there has been significant precipitation in the command area and there is a very significant reduction in immediate demand for water from canals. Most of this water flows over the tail crest and joins the natural drainage. The average tail cluster losses are 35.75%. The challenge lies in optimally utilizing this water by filling the local ponds /lakes. Where the canal minors or sub-minors do not end in close vicinity of ponds/lakes, a technique for utilizing flows for recharge of aquifer could be developed or a connecting canal could be constructed upto ponds/lakes to fill them.
c) Losses due to operations and management of canals Some canal water is lost due to outflows from the series of canal escapes. Roughly 424 MCM/ year of canal water that is diverted from Tajewala barrage flows back into river Yamuna from Munak Escape. Similarly, 120.83 MCM/ year of water is released into Najafgarh drain to join Yamuna River downstream of Wazirabad barrage. These two outflows would alone amount to savings in 1000 cusecs canal capacity from Tajewala to Munak, and 240 cusecs from Munak to Wazirabad. The direct release of this water from Tajewala/ Hathni Kund will allow minimum flow of water in the river and would also allow restoring the flora and fauna in river Yamuna. Similarly, there are many other escapes from where the canal water is put into natural drainage system.
If water from Munak Escape and Najafgarh drain is directly released from Tajewala/ Hathni Kund into river Yamuna rather
bringing through canals and then discharging it back into Yamuna, an equal amount of water can be transferred in canals without
constructing new parallel canals to augment canal capacity. This would save the capacity of the existing canals for meeting the
additional demands and transferring the committed waters from Indus basin and proposed dams.
All the water lost from canals is not really lost from use. A very significant portion of this seeps to the aquifer formations and
joins the groundwater reserve. Another portion of it goes into natural drains and finally joins river Yamuna and gets tapped at
Okhla for Agra canal system. A small quantity of water is lost due to evaporation and overflow from diversion works in nonrainy
season.
d) Shortages and surpluses due to variation in river flows Roster is a system of committed discharge that is prepared a season in advance. However, daily variations in river flows result in variations in canal discharges throughout the network. Thus, the actual water available at a given location is different from the discharge value given in the Roster. These variations in canal flows also add to surpluses and shortages throughout the network. The Study on Water Supply & its Management in NCR suggests that the actual canal flows over the year are 19% more than the committed flows laid down in the Roster. The challenge lies in minimizing these daily variations in river flows, which can be achieved by regulating releases by constructing new dams in the catchments upstream of NCR.
e) Loss of canal capacity due to ill designed rosters Despite there being a roster system for operation of canal system, a strict compliance to it is not being achieved. On an average 44.96% of canal water is lost due to this per year. These losses worsen the shortages and surpluses of water all over the command area and result in very large amount of irrigation drainage flows. There are several reasons for these ill operations. These reasons vary from complacency of the staff concerned to influence exercised by powerful persons of a given area or rainfall in command area.
Definitions
NRDWP - National Rural Drinking Water Programme: This programme was launched in April 2009 by the then Department of Drinking Water and Sanitation presently Ministry of Drinking Water and Sanitation, for assisting states in providing drinking water to the rural population of India. This programme has incorporated paradigmatic changes in its previous version called the Accelerated Rural Water Supply Programme, by emphasizing on water supply systems which are planned and managed by the community at the village level, for ensuring sustainable drinking water availability, convenient delivery systems and achieving water security at the household level.
Habitation: It is a term used to define a group of families living in proximity to each other, within a village. It could have either heterogeneous or homogenous demographic pattern. There can be more than one habitation in a village but not vice versa. Norms of coverage of habitations under NRDWP: 40 lpcd is the minimum or lifeline supply that has to be provided to a habitation for considering it as “Fully Covered” under the NRDWP. FC - Fully Covered: Those habitations, in which the average supply of drinking water is equal to or more than 40 lpcd, are called “fully covered” habitations.
PC - Partially Covered: Those habitations in which the average supply of drinking water is less than 40 lpcd and equal to or more than 10 lpcd, are called “partially covered” habitations. NC - Not Covered: Those habitations, in which the average supply of drinking water is less than 10 lpcd, are called “Not covered” habitations. Uncovered Habitation: Such habitations are those which have never been provided with drinking water supply by the government, under the NRDWP (or former Accelerated Rural Water Supply Programme).
|frame|500px


