National Capital Region (India): Transport
(Created page with "{| class="wikitable" |- |colspan="0"|<div style="font-size:100%"> This article has been sourced from an authoritative, official <br/>publication. Therefore, it has been ‘lo...") |
|||
| Line 10: | Line 10: | ||
[[Category: Economy-Industry-Resources |N]] | [[Category: Economy-Industry-Resources |N]] | ||
[[Category: Development |N]] | [[Category: Development |N]] | ||
| + | [[Category: Places |N]] | ||
| + | |||
==The source of this article== | ==The source of this article== | ||
| Line 22: | Line 24: | ||
[http://www.ncrpb.nic.in/ National Capital Region Planning Board] | [http://www.ncrpb.nic.in/ National Capital Region Planning Board] | ||
| + | |||
=National Capital Region (India): Transport = | =National Capital Region (India): Transport = | ||
Revision as of 20:00, 11 January 2014
This article has been sourced from an authoritative, official readers who wish to update or add further details can do so on a ‘Part II’ of this article. |
Contents |
The source of this article
Draft Revised Regional Plan 2021: National Capital Region
July, 2013
National Capital Region Planning Board, Ministry of Urban Development, Govt. of India, Core-4B, First Floor, India Habitat Centre, Lodhi Road, New Delhi-110003
National Capital Region Planning Board
National Capital Region (India): Transport
EXISTING NCR TRANSPORT SYSTEM
The transport system of NCR consists of a good road network and rail corridors catering to intra-city, inter-city commuters and long-distance traffic. The freight traffic is also substantial in the region which is mainly carried by road. NCR has a road network of about 36,305 km; a large bus fleet of 58,300 buses (registered in NCR), a rail network of more than 1000 km; and an International Airport at Delhi.
6.3.1 Road Network
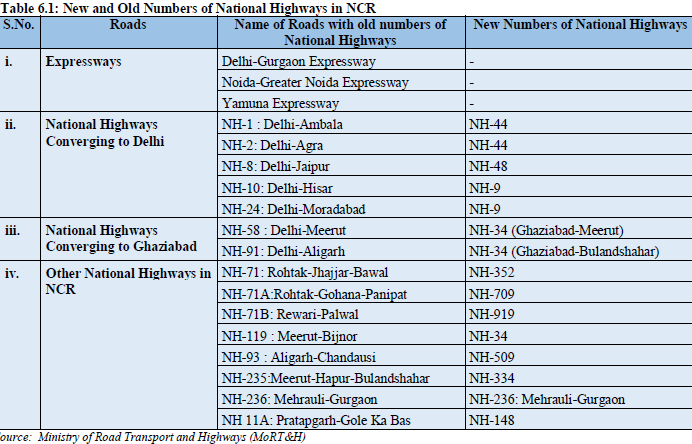
The existing road transport network is ‘radial’ in nature. It comprises Expressways, National Highways, State Highways, Major District Roads and Other District Roads. Ministry of Road Transport and Highways vide notification no. S.O.542(E) dated 05.03.2010 rationalized the numbering system of National Highways in India. The revised numbers as well as old number are given in following table. The old numbers of National Highways are popular and people can easily recognize. Therefore, old numbers are used in this Chapter for further reference. The list of Expressways and National Highways in NCR is given in Table 6.1.
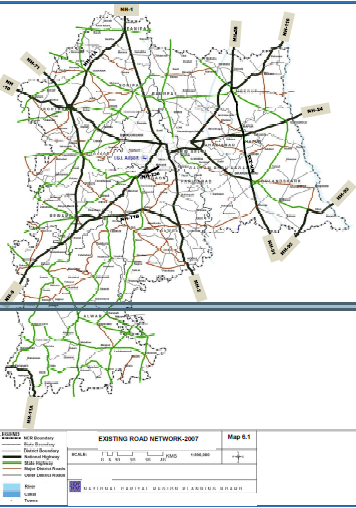
Five National Highways converge to Delhi which also serve the daily inter-city commuters. The existing
road network of NCR is shown in Map 6.1. Apart from these National Highways, a number of State
Highways also strengthen the regional road network. In addition, Major District Road (MDR) and Other
District Roads (ODR) act as important linkages to these highways.
6.3.1.1 Road Density
The Sub-region wise road density in the NCR is presented in Table 6.2. Delhi has the highest road density of 2,103 km/100 sq.km followed by Haryana (59.30 km/100 sq.km). Rajasthan and UP Subregions have almost same road density of 51 km/100 sq.km.
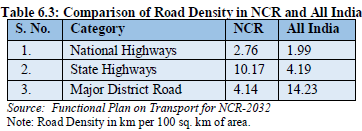
Table 6.3 represents comparison of road density in NCR (excluding Delhi) with all India. It would be seen that density of National Highways (2.76) and State Highways (10.17) in NCR are much higher than the all India density of National Highways (1.99) and State Highways (4.19). But density of Major District Roads (MDR) in NCR (4.14) is much lower as compared to the all India density (14.23).
6.3.1.2 Transport Scenario in Delhi
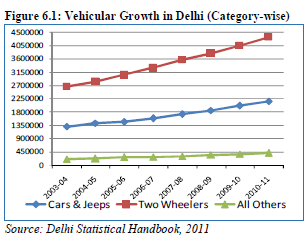
The vehicles in Delhi have grown at the rate of 7.41% per annum between 2003-04 and 2010-11 (Table 6.4). Number of private vehicles has increased substantially from 3.98 million to 6.52 million during that period. However, the growth rate of commercial vehicles (9.42%) is higher than the growth rate of private vehicles (7.29%).
The numbers of private vehicles (cars and two-wheelers)
have grown exponentially between 2003 and 2010 (Figure
6.1).
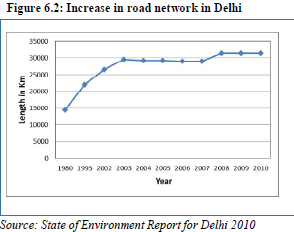
Figure 6.2 represents the increase in road network in Delhi.
Delhi had 1922 km of roads per 100 sq.km. area in 2001.
The road network has increased from 28,508 km in 2000 to
29,030 km in 2008, while the number of vehicles has
doubled from 33.7 lakh in 2000 to 63.0 lakh in 2008. This
has resulted both in heavy traffic congestion and reduction
in vehicular speed.
6.3.1.3 Volume to Capacity Ratio
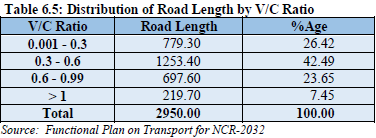
Volume to Capacity Ratio (V/C) is a measure to evaluate the extent of utilization of road capacity. Ideally, it should be always less than 1. The V/C for design service volume for rural roads is 0.5 and for urban roads it is 0.7 as per IRC norms. Corrective measures are required when it exceeds the norms.
The V/C Ratio assessed in NCR (excluding Delhi) for 2950 km of road network are presented in Table 6.5. It is observed that 31% of primary road network have V/C ratio more than 0.6, which is above the norms of V/C ratio of 0.5 for rural roads.
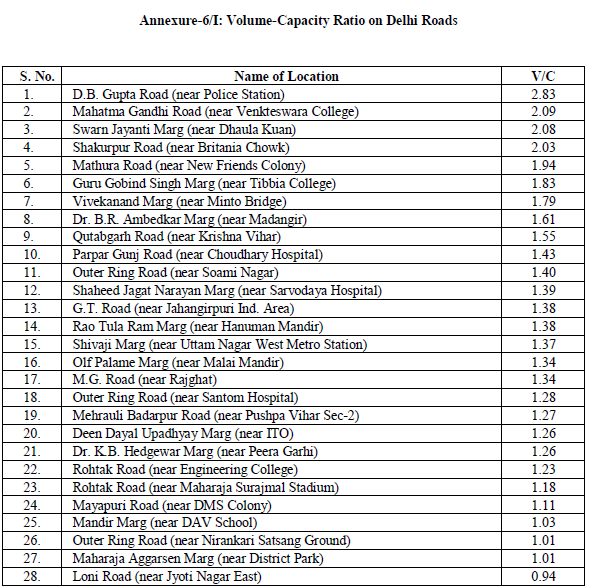
As per the survey conducted by RITES for Government of NCT-Delhi in 2007, V/C ratio varied between 1.01 to 2.83 on major roads in Delhi, which is higher than 0.7 for urban roads. A table showing V/C ratio on some of the important roads in Delhi is given in Annexure 6/I.
6.3.1.4 Traffic and Travel Pattern
In 2007, detailed traffic and transport surveys were conducted to prepare the Functional Plan on Transport for NCR-2032. Based on these surveys, it was observed that NCR is a high movement area with high intensity traffic of all types. It shows that 2,21,575 vehicles (3,50,694 PCUs) enter and exit NCR (Outer Cordon) on an average per day (2007). In NCR, National Highways account for 75% (vehicles) of the total traffic volume. The traffic volume increased to 2,72,891 vehicles (3,87,565 PCUs) at the Middle Cordon (CNCR boundary); and reached a high of 12,10,896 vehicles (12,27,873 PCUs) at Inner Cordon (NCT-Delhi boundary). At the Outer Cordon (NCR boundary), out of 94,659 passenger modes nearly 97% of passenger modes movement was Internal-External and External-Internal and only 3% was External-External. The interspatial movement pattern of passenger modes showed a high share between ‘Rest of NCR’ and ‘Outside NCR’ areas. Out of 63,352 goods modes at Outer Cordon, 9% were non-destined. At the Middle Cordon (CNCR boundary), out of 1,56,838 passenger modes, Internal-External and External-Internal passenger mode movement accounted for 69%. The share of through movement was 4%. A high intensity of interaction between CNCR and outside areas was observed. Internal-Internal passenger movement was 27% within CNCR. Out of 67,859 goods modes, 7% were non-destined. At the Inner Cordon (NCT-Delhi boundary), out of 11,07,043 passenger modes, the non-destined traffic was as high as 23%. About 37% passenger modes exit Delhi and 38.4% passenger modes enter in to Delhi in a day. Out of 1,03,853 goods modes crossing at Inner Cordon, 30% were non-destined, which is very high. This shows the need of bypass to Delhi.
6.3.2 Rail System
6.3.2.1 Indian Railways
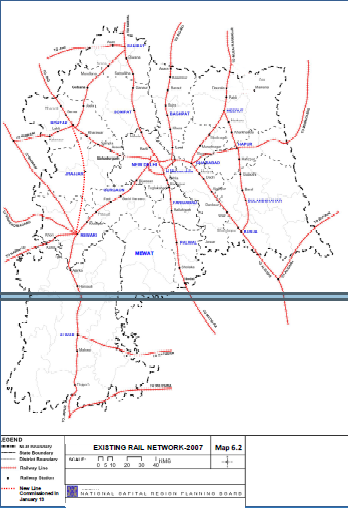
The NCR rail network falls under three zonal railways (Northern, North-Western and North-Central) and five divisions. Six rail corridors converge to Delhi and three rail corridors converge to Ghaziabad. The zone-wise rail corridors are as under:
The rail network in NCR is shown in Map 6.2.
A total of 625 trains including 253 long distance passenger trains and 176 EMU trains (suburban trains)
operate at the three major railway stations of Delhi viz. Old Delhi, New Delhi and Hazrat Nizamuddin. Apart from this, a large number of goods trains move into and out of NCR. The commuter traffic in NCR is about 0.61 million per day (2007).
The mixed running of goods trains, slow passenger trains, short distance commuter trains and long distance trains such as mail express trains, high speed Rajdhani, Shatabdi express, etc., have reduced the speed of trains in Delhi area as well as on radial routes.
6.3.2.2 Metro Rail in NCR
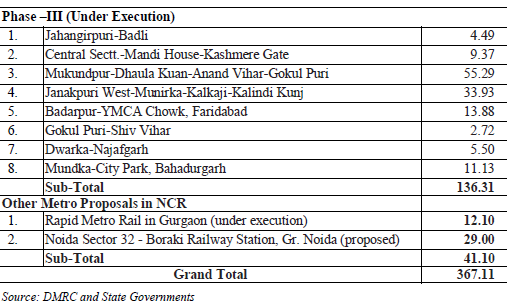
Delhi Metro Rail Corporation (DMRC) has completed the construction of about 190 km of metro corridor in Phase I & II, which is fully operational. The Phase III network of 136 km has been sanctioned and under execution which is expected to be completed by December 2016. Average daily ridership of Delhi Metro was 19.65 lakh in March, 2013. Regional Plan-2021 for NCR proposed for the extension of Delhi Metro Rail System to CNCR towns. Accordingly, it has now been extended to Noida, Gurgaon and Ghaziabad and is proposed to be extended to Faridabad and Bahadurgarh. The existing and proposed Metro corridors in NCR are given in Annexure 6/II.
6.3.3 Bus System
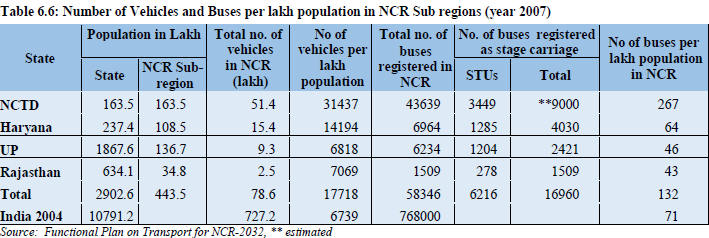
NCR is served by an extensive bus service operated by STUs of GNCT-Delhi (DTC), Haryana (HSRTC), Uttar Pradesh (UPSRTC), Rajasthan (RSRTC), Uttarakhand (UTC), Punjab (PRTC), Himachal Pradesh (HRTC) and Jammu & Kashmir (J&K SRTC); and a host of private operators. Density of buses and other vehicles per lakh population in the sub-regions of NCR and at the national level are given in the Table 6.6.
Against average ratio of 71 buses per lakh population at national level, the NCR’s average is 132. The NCR Sub-regions of Uttar Pradesh and Rajasthan have much lower ratio of 46 and 43 buses respectively while Haryana Sub-region has a ratio of 64 buses. Delhi has significantly higher bus ratio of 267, as it serves intra-city travel demand. On the other hand, vehicle/population ratio of all type of vehicles in the NCR sub regions is much higher (17718) than the national average of 6,739. Out of a total of 58,346 buses registered in the NCR, 6216 (29%) are stage carriage buses. Only 11% of all the registered buses and 37% of the stage carriage buses are owned by the STUs and the remaining 89% registered bus and 63% stage carriage are owned by private operators. Ministry of Urban Development under JNNURM scheme sanctioned 1900 buses in NCR cities, as per details given in Box 6.1.
6.3.4 Intermediate Public Transport System (IPTS)
A large number of auto-rickshaws and taxis operate in cities and towns within NCR. On an average, an
auto rickshaw carries 96 passengers per day and other vehicles like RTVs carry 114 passengers per day in
NCR. The Intermediate Public Transport System (IPTS) suffers from many constraints like lack of
terminal facilities, technological obsolescence, uneconomical fares, parking etc. There is an urgent need
to facilitate growth and operation of IPTS within the NCR for providing last mile connectivity with
MRTS, RRTS and Bus System.
6.3.5 Air Transport
Indira Gandhi International Airport (IGIA) is the major airport in NCR. In terms of traffic volumes, it is second to Mumbai, and handles annually about 35.88 million passengers and 0.56 million tonnes of cargo traffic (2011-12). Presently it has three operational runways with a peak hour handling capacity of 75 aircrafts movement. There are three separate terminal areas for domestic passengers, international passengers and cargo. The international passenger traffic at Delhi airport is 30% of the total passenger traffic. However, the international cargo traffic is 65% of the total cargo traffic. The Airport connects 60 destinations all over the globe through 51 international airlines. Of the passenger traffic, about 76% was generated within NCTD, 19% in NCR (excluding NCTD) and 5% beyond NCR (2007). Besides, it is expected to handle a large quantity of cargo on commissioning of Delhi Mumbai Industrial Corridor (DMIC).
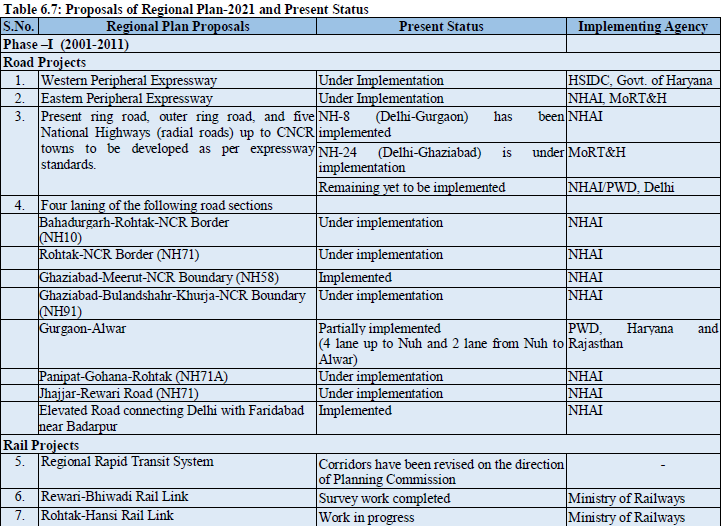
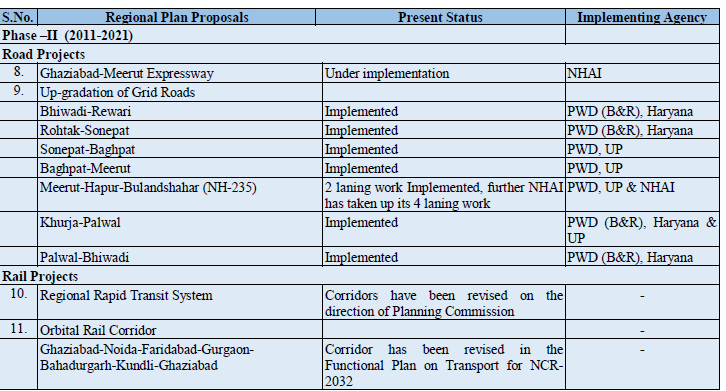
6.4 STATUS OF REGIONAL PLAN-2021 TRANSPORT PROPOSALS Various projects related to transport are proposed in Regional Plan-2021. The present status of these projects is given in Table 6.7.
-
‘Reciprocal Common Transport Agreements’ for unrestricted movement of buses, taxis and autorickshaws
for ‘Contract Carriage’ and ‘Stage Carriage’ have been signed by all the participating States of
NCR on 14.10.08 and 22.04.10 respectively. Its implementation is underway. Presently, 12000 NCR taxis
and 7500 NCR buses are plying in NCR.
Environmental Concerns
Spatial distribution of Air pollution, (SPM, CO, NOx, RSPM) and Noise Pollution, [Leq (Day) and Leq (Night) levels] measured at 82 identified locations (2007) indicate that the norm of these parameters was also exceeding at various locations varying between moderate to critical level of pollution. Further, the NCR Transport Modal predicted intensity of traffic, by modes and their speed in the horizon year. Volume of exhaust gases due to anticipated traffic was estimated using the modals and location-wise Air Pollution Indices (API) was calculated which varies from 0.66 to 1.67. It was estimated that a total of 15.52 Gg (15520 M Tons) of CO2 /day would be emitted at the 82 stations in NCR. It indicates that Transport Plan for NCR is required to be implemented in phased manner as proposed and if the rail based public transport system i.e. RRTS and Bus-based public transport system are not implemented in timebound manner, it will have serious impact on Climate Change apart from affecting the health of the people in the Region. Hence, there is a dire need to construct/develop Integrated Multi-Modal Transport System in NCR with major emphasis on RRTS, Regional Orbital Rail Corridor, Inner Regional Orbital Rail Corridor and efficient & reliable bus services as public transport system.
