National Capital Region (India): Environment
This article has been sourced from an authoritative, official readers who wish to update or add further details can do so on a ‘Part II’ of this article. |
Contents |
The source of this article
Draft Revised Regional Plan 2021: National Capital Region
July, 2013
National Capital Region Planning Board, Ministry of Urban Development, Govt. of India, Core-4B, First Floor, India Habitat Centre, Lodhi Road, New Delhi-110003
National Capital Region Planning Board
National Capital Region (India): Environment
BACKGROUND
NCR is a predominantly an urban region with more than 108 urban centers and 62.5% urbanization as against the all India average of 31.2%. The region is endowed with several ecologically sensitive natural features which needs to be preserved and protected. However, the pressure to convert agricultural land into non-agricultural and abiotic uses in order to realize the high land value potential is extremely severe. The Regional Plan 2021 for the National Capital Region calls for a balanced approach, incorporating environmental considerations into planning process for a sustainable development of NCR. This chapter on Environment focuses on:
i. Forests
ii. Air
iii. Water (surface)
iv. Notable environmentally sensitive areas within the NCR.
It discusses the present status, temporal changes, issues of major concern, and finally the way forward.
FORESTS IN THE NATIONAL CAPITAL REGION
Forests are an important natural resource and once degraded the land is usually unable to support forests again. The ever increasing demand for food, fuel, fodder and the growing demand of land for urbanization has however, put tremendous pressure on the scarce forest resources of the region. The National Forest Policy, 1988, aims to have a minimum of 1/3rd of the total land area of the country under forest and tree cover. The following sections discuss the current status of forest cover and temporal change over the last decade (based on India State of Forest Reports, 2001, 2005, 2009 and 2011, FSI) in the NCR. It may be noted that the definition of green areas presented in the Regional Land Use Chapter differ from the definition of forest cover in this Chapter due to: (i) the green areas in Regional Land use Chapter include dense forest areas, forest vegetation and scrubs (ii) same definition was used in 1999 for the land use change analysis. In this Chapter, FSI Data has been used to analyze forest cover in NCR and comparison with all India figures.
14.2.1 Present Status of Forest Cover in NCR.
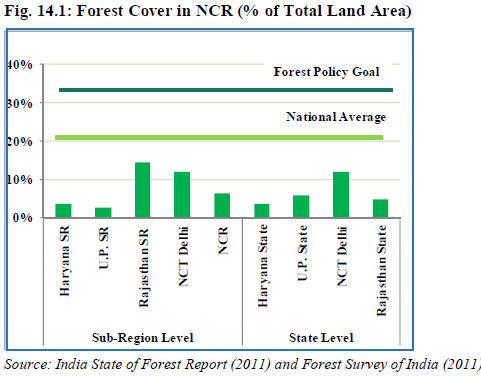
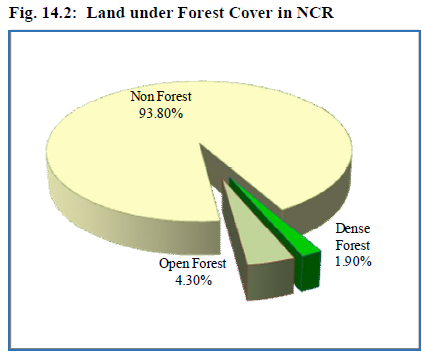
At all India level, forest cover forms 21% of the total Geographical Area. In the National Capital Region, forests are spread over an area of 2131.2 sq. km., which is 6.2% of the total land area of NCR (India State of Forest Report, 2011). Within NCR, Rajasthan sub-region has 14.4% of its total land area under forest cover, followed by Sub-Regions of NCT Delhi (11.9%), Haryana (3.5%) and Uttar Pradesh (2.6%) respectively (Annexure 14/I). Besides forest cover, at all India level, 2.76% of the total geographical area is under tree cover, thus improving the percentage area under total forest and tree cover to 23.81%. In NCT Delhi, tree cover forms 8% of total geographical area, and with forest cover of 11.9%, the total area under forest and tree cover forms 19.9% (Figures 14.1 and 14.2).
Box 14.1
Proportion of forest cover in NCR to its total geographical area is 6.2% against a national average of 21.05% None of the sub-regions of the NCR have forest cover comparable with the present All- India average.
Note: Dense forests include very dense to moderately dense forests. The Forest Survey of India conducts the assessment of forest resources biannually and classifies forests as: (i) Very Dense Forest (> 70% canopy density); (ii) Moderately Dense Forest (40%-70%), (iii) Open Forest (10-40%) and (iv) Scrub (< 10%).
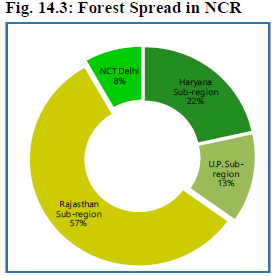
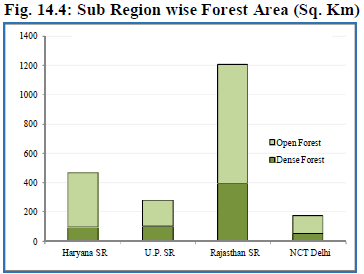
Dense forests are more productive than the Open forests which have much lesser canopy density (Table 14.1). As forest degrades, the canopy density also decreases. In terms of spatial concentration, of the total area of 2131.2 sq. km., nearly 57% of the forest cover in NCR is in Rajasthan Sub-region (mainly concentrated in Aravali mountain range), followed by 22% in Haryana sub-region. UP sub-region accounts for 13% of NCR forest cover, and the rest 8% is in NCT Delhi (Figure 14.3 and Figure 14.4).
A) Region Wise Current Status (2011)
(i) NCT Delhi - The forests in NCT Delhi are spread over 176 sq. km. (11.9% of area), while the recorded forest area is 85 sq. km. (5.7% of area), comprising reserve and protected forests (Figure 14.5). Besides, NCT Delhi has considerable tree cover (120 sq. km. or 8.0% of area), and thus the total area under forests and tree cover is (296 sq. km. or 19.9% of area). Of the total forests, 32% are dense forests; rests are open forests.
(ii) Haryana - In Haryana sub-region, forests are mostly situated in Gurgaon and Faridabad districts. The forest cover in Haryana sub-region in 2011 is 468 sq. km. (3.5% of area) (Figure 14.5). Of the total forests in the sub-region, 21% are dense forests, and the rest are open forests. Four districts – Panipat, Sonepat, Rohtak and Jhajjar have less than 2% of the total geographical area under forest cover.
(iii) Uttar Pradesh - Uttar Pradesh sub-region has least forest cover, as compared to other sub-regions of NCR, (Figure 14.5). It has a forest cover of 282 sq. km., which is about 2.6% of the total geographical area of the sub-region (36% are dense, and the rest 64% are open forests).
(iv) Rajasthan - Rajasthan sub-region has a forest cover of 1,205 sq. km., which is about 14.4% of its total geographical area. This sub-region has the largest forest cover in the NCR – about 56.5% of total forest cover of NCR is in Rajasthan sub-region. Of the total forests in the sub-region, 33% are dense forests, and the rest are open forests (Figure 14.5).
14.2.2. Temporal changes in forest cover (2001-2011)
ALL INDIA: At an all India level, the forest cover has increased from 20.6% to 21.1% over the last decade (2001-2011), in absolute terms, this amount to an increase of 16,489 sq. km. (0.5%) in the forest cover.
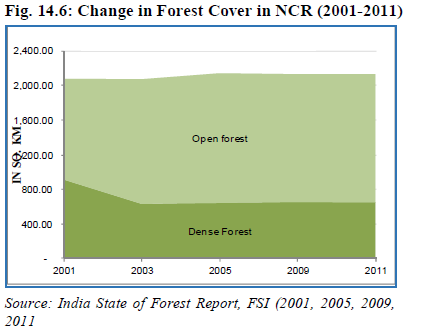
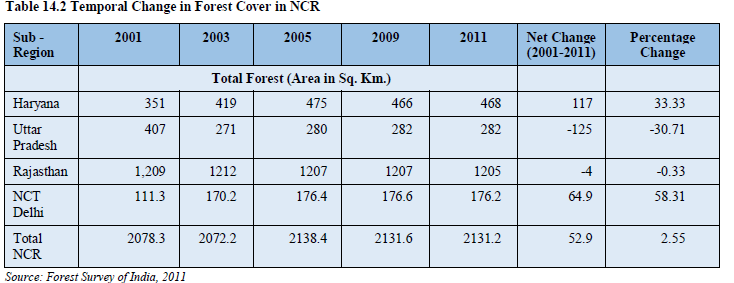
NCR: The overall area under forests, during 2001-2011, has increased by 52.9 sq. km., representing a 2.5% increase over the last decade. While there has been an increase in total forest cover, dense forest cover in NCR has declined by 260 sq. km. (about 28% decline), the area under open forest cover has increased by 312.6 sq. km. (about 27% increase) (Figure 14.6). This change is due to degradation of dense forest into open forest and addition of open forest cover through improvement of tree cover in scrub, waste lands and others. Similar trend has been noticed at All India level. The details of temporal change in NCR forest cover is provided in Table 14.2 and Annexure 14/II.
A) Sub-Region wise temporal change (2001-11)
(i) Delhi - NCT Delhi added 64.9 sq.km. of forest cover (2001-11), increasing its proportion of forest area to total land area from 7.5% in 2001 to 11.9% in 2011. Contrary to regional and national trend of decline in dense forests and increase in open forest, NCT Delhi has increased its cover in both categories. Dense forest increased by 18.2 sq.km. (48% increase in dense forest cover), and open forests by 46.6 sq. km. (63.6% increase). Annexure 14/III presents the details of temporal change in forest cover in NCT Delhi.
Box 14.2 During 2001-11, the forest cover in NCR has increased by 2.5% or in absolute terms, 52.9 sq. km of forest area, but dense forests has declined by 28% while open forest increased by 27%.
(ii) Haryana - Haryana Sub-region added nearly 117 sq.km. of forest cover during this period,
increasing its proportion of forest area to total land area from 2.6% in 2001 to 3.5% in 2011
(Annexure 14/IV). Dense forest cover has increased by 4 sq. km., but what is more notable is
increase in open forest cover by nearly 44.3%, adding 113 sq. km. of open forests. This increase
has contributed to overall increase in NCR forest cover.
(iii) Uttar Pradesh - During this period Uttar Pradesh Sub-region has lost 125 sq. km. of forest cover, decreasing its proportion of forest area to total land area from 3.7% in 2001 to 2.6% in 2011 (Annexure 14/V). This is about 70% decrease in the dense forest cover of UP sub-region, and about 26% of decrease in dense forest cover of NCR. Open forest area has increased by 116 sq. km.; about 181.3% increase. On the contrary, during the same period, the forest cover in the UP State has increased from 5.7% in 2001 to 6.0% in 2011, adding 592 sq. km. of forest cover. (iv) Rajasthan - There has been no major change in total forest cover in the Rajasthan sub-region over the last decade. However, during this period, the sub-region has lost 4 sq.km. of forest cover; along with a notable change in forest types. While the dense forest cover has declined by 41 sq. km. (about 9.4% of total dense forest cover in Alwar), the area under open forest has increased by 37 sq. km. (about 4.8% of total open forest cover). Details of temporal change in Rajasthan Sub-Region are in Annexure 14/VI.
AIR QUALITY
Air pollution is one of the key issues originating from a complex interlinked network of underlying problems confronting urban areas of National Capital Region. This section presents the ambient air quality status and trend in the National Capital Region with reference to National Ambient Air Quality Standards (NAAQS) of India notified by the Central Pollution Control Board (CPCB) under section 16 of Air (Prevention and Control of Pollution) Act, 1981. NAAQS provides permissible limits for 12 air pollutants in the ambient air.
14.3.1. Ambient Air Quality Monitoring Network in NCR
The ambient air quality in NCR is monitored by Central Pollution Control Board (CPCB) and State Pollution Control Boards (SPCBs)/Pollution Control Committees (PCCs) under the National Air Quality Monitoring Program (NAMP) and state-specific initiatives of SPCBs/PCCs. Under NAMP, CPCB has selected four pollutants for regular monitoring at all designated monitoring stations – (i) Sulphur Dioxide (SO2), (ii) Oxides of Nitrogen (NOx), (iii) PM10 and (iv) PM2.5. At present, there are 34 Ambient Air Quality (AAQ) monitoring stations in NCR, including 20 stations established under the NAMP and 14 established by respective SPCBs/PCCs. Additionally, 12 monitoring stations are proposed under NAMP in Haryana, which are yet to be established. Majority of the stations are located in NCT Delhi. In NCR, only 6 district head quarter towns and Delhi have AAQ monitoring stations. No monitoring stations are established in other small and medium towns (Annexure14/VII).
14.3.2. Ambient Air Quality Status in NCR All monitoring stations in NCR monitor three pollutants SO2, NO2, and PM10, while PM2.5 is monitored at limited number of stations. Air quality monitoring data of 2007-2011, obtained from CPCB, SPCBs and DPCC has been presented in Annexure 14/VIII.
PM10 (Particulate Matter of 10 micron or less) concentration in Ambient Air (2007 2011) in NCR – PM10 is directly emitted or is formed in
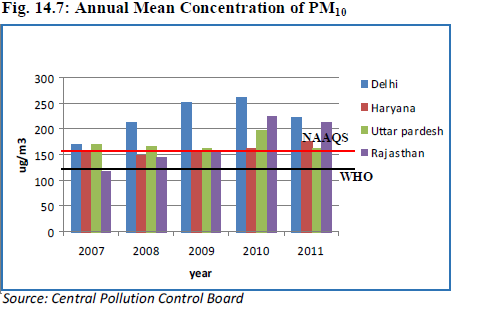
the atmosphere as a result of mixing of various gaseous pollutants. Major human health concerns from PM10 exposure include effects on respiratory systems, damage to lung tissue, cancer and even premature death. As shown in the figure, during 2007-11, annual mean PM10 concentration in ambient air has consistently remained high in all the sub-regions of NCR, well over the national ambient air quality standard of 60ug/m3 (annual). In 2011, annual mean concentration of PM10 has exceeded the limit in NCT Delhi (222.4 ug/mg3), Haryana Sub-region (177 ug/mg3), UP sub-region (163.5 ug/mg3) and Rajasthan sub-region (213.3 ug/mg3). These concentrations of PM10 exceeded the standard by 370% in case of Delhi, 295% in Haryana sub-region, 272.5% in UP sub-region and 255% in Rajasthan sub-region (Figure 14.7).
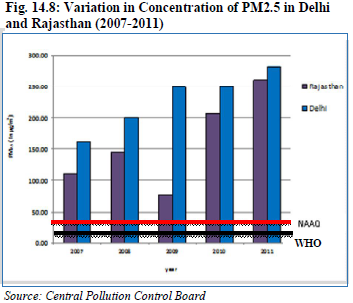
PM2.5 (Particulate Matter of 2.5 micron or less) concentration in Ambient Air (2007-2011) in NCR - PM2.5 has far greater potential to adversely affect human health and also has impacts on climate and precipitation. Presently, PM2.5 is monitored at select locations in NCR. DPCC is monitoring PM2.5 at 5 locations, while RSPCB is monitoring at 3 locations in Alwar. HSPCB has started monitoring PM2.5, at one station (Faridabad) in Haryana sub – region from January 2012, and data is therefore available only for the 8 month period from January- August 2012. In U.P. sub-region, data for PM2.5 is not available till date. The annual trend of PM 2.5 can therefore be analyzed varying over the last 5 years for Delhi and Rajasthan sub-regions (Figure 14.8).
As shown in the figure, PM2.5 concentration in ambient air has remained high in both Delhi and Rajasthan sub-regions, well over the NAAQ standard of 40ug/m3 (annual). • In NCT Delhi: PM 2.5 concentration increased from 161 ug/mg3 in 2007 to 281 ug/mg3 in 2011 as against the standard of 40 ug/mg3. • In Alwar Rajasthan sub-region, PM 2.5 concentration increased from 110 ug/m3in 2007 to 144 ug/m3in 2008, declined sharply in 2009 (77 ug/m3) and again increased to 2006 ug/m3 in 2010 and further increased to 260 ug/m3 in 2011.
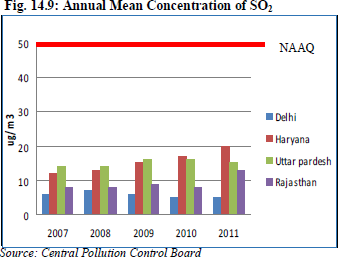
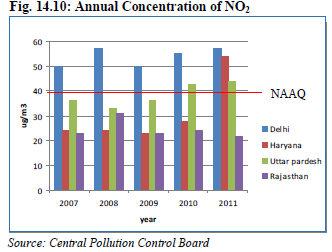
SO2 concentration in Ambient Air (2007-2011) in NCR. Sulphur dioxide (SO2) is a major air pollutant from vehicular and industrial emissions; its concentration in the atmosphere has significant impacts upon human health and habitat. The sub region wise trend of SO2 levels in NCR of the last 5 years, as shown in the Figure 14.9, indicate that mean annual concentration levels are within the NAAQ standard of 50 ug/mg3 in all the sub regions. Comparatively, higher SO2 concentration levels are observed in Haryana sub region, followed by Uttar Pradesh and Rajasthan and in NCT Delhi, the lowest. NO2 concentration in Ambient Air (2007-2011) in NCR. Nitrogen dioxide is a toxic gas formed during combustion processes (NAAQ standard for NO2 is 40 ug/mg3 - annual average).
• In NCT Delhi, NO2 concentration levels were continuously above the stipulated standard during 2007-2011, with an increasing trend – from 49.67 to 57 ug/mg3 (15% increase over last 5 years). • In UP Sub-region, NO2 levels exceeded the limit in 2010 and 2011, and overall shown an increasing trend from 2007 to 2011 - from 36.17 to 44 ug/mg3 (22 % increase over last 5 years). • In Haryana sub-region, NO2 levels exceeded the limit in 2011 (54 ug/mg3) (Figure 14.10).
SURFACE WATER
Water constitutes an important environmental resource. Detailed examination of the water resources has been given in Chapter 8 on Water. However, a brief analysis of surface water quality status in NCR is presented in the following section. Ground water is dealt with in Chapter 8.
14.4.1 Water Quality Standards & Monitoring Water (Prevention and Control of Pollution) Act, 1974 was enacted with a basic objective to maintain and restore surface aquatic resources. Since the natural water bodies are used for various purposes, the focus has been at restoring and/or maintaining the water bodies to such a quality as needed for their best use and CPCB developed a concept of “designated best use” (DBU). According to this, out of the several uses a water body is put to, the use that demands highest quality of water is termed as “designated best use”. CPCB’s Use based Classification of Surface Waters in India notifies primary water quality criteria for the following five uses.
(i) A - Drinking Water Source without conventional treatment but after disinfection
(ii) B - Outdoor bathing (Organized)
(iii) C - Drinking water source after conventional treatment and disinfection
(iv) D - Propagation of Wild life and Fisheries
(v) E - Irrigation, Industrial Cooling, Controlled Waste disposal
Tolerance limit for inland surface water for other parameters is given in IS 2296-1982. Water quality criteria for bathing in rivers is notified by Ministry of Environment &Forests (MOEF). National Water Quality Monitoring Program (NWMP): National Water Quality Monitoring Program is similar to NAMP, with CPCB being the chief regulatory agency for water quality monitoring and it collaborates with State Pollution Control Boards (SPCBs) and Pollution Control Committees (PCCs) to implement the various water related policies & regulations governing water quality management and monitors the water quality of various water bodies.
Surface Water Quality Monitoring in NCR: In NCR, CPCB, and SPCBs of three constituent states (UPSPCB, HSPCB and RSPCB) and DPCC regulates control of pollution and implements NWMP. CPCB has provided information of water quality for the period of 2007-2011. Annexure 14/IX lists the 42 stations in NCR (5 on Yamuna, 3 on Hindon, 2 on Kali Nadi, 1 on Ganga River, 7 on drains, 7 on canals and 17 for ground water). The water samples are analyzed for various parameters (core, general, trace metals, pesticides and bio monitoring) under the NWMP.
14.4.2. Water Quality of Rivers
The maximum and minimum values of core parameters in the four rivers observed over the past 5 years (2007-2011) at 9 monitoring stations are given in Annexure 14/IX. The Biochemical Oxygen Demand (BOD) and pathogenic bacteria (Total coliform and Fecal coliform) values indicate that there has been
Box 14.3 Yamuna Water Quality Analysis Based on DPCC Data - DPCC has 9 monitoring stations on River Yamuna. The water quality of River Yamuna post monsoon (10 July 2012) when dilution is high, does not meet class A,B and C use criteria, in the entire stretch-Palla to Jaitpura (Agra canal) except at Palla. degradation in water quality. While Nitrates and Nitrites are in the range of 0 to 13.9 mg/l. pH is generally within limit for all uses in the four rivers.
A) Yamuna River River Yamuna, the largest tributary of River Ganga and one of the important rivers of Northern India, makes the central spine of the NCR flowing through the Haryana, Delhi and U.P. sub-regions. Urban agglomeration of NCT Delhi is the major contributor of pollution load in Yamuna followed by Agra and Mathura. The stretch between Wazirabad Barrage and Chambal River confluence is critically polluted and there is significant fluctuation in dissolved oxygen level from nil to critically low levels. This reflects presence of organic pollution load and persistence of eutrophic conditions in the river. As per CPCB, the contribution of pollution load from NCR & non-NCR states are in the proportion of 80:20, i.e. over 3/4th of the pollution load in River Yamuna is contributed by the NCR (Source: Assessment and Development of River Basin Series, 1999-2005, CPCB). The water of Yamuna River is not suitable for class A, B and C use in almost its entire length in NCR due to high total coliform, high BOD and low DO levels.
B) Ganga, Hindon & Kali Rivers i. Ganga - River Ganga originates at Gomukh in Uttarakhand and enters the NCR at Hastinapur in UP sub-region and flows along the eastern boundary. Very little of its original water flows into NCR, as most of it (90 percent) is diverted at Haridwar through the Ganga Canal. The quality of Ganga water at GarhMukteshwar (Monitoring Station) complies with standards B-Class for BOD and DO but does not comply with fecal coliform standard. The water in River Ganga is relatively better than the other three rivers in NCR, however the water is not suitable for use as class B due to high total coliform.
ii. Hindon and Kali Nadi – Originating in Saharanpur District in UP, Hindon River and its tributaries flow through six districts of Uttar Pradesh, before it joins River Yamuna. With a highly populated and predominantly rural catchment, Hindon River is used as a source for domestic, agricultural and industrial uses. Kali Nadi, which is a tributary of Yamuna passes through the UP sub-region of NCR. Both Hindon and Kali Nadi are highly polluted. In Hindon River, the BOD level varies from 1 to 278 mg/l (Annexure 14/IX). The high values are equivalent to sewage, making water unsuitable for class A, B and C use. In Kali Nadi, BOD varies from 16 to 353 mg/l and DO levels are low, making water unsuitable for use as class A,B and C.
C) Water Quality of Canals in NCR The major canals in NCR are Yamuna Canal, Gurgaon Canal and Agra canal. Water quality status (2007- 2011) of the canals and drains in NCR is given in Annexure 14/IX. Gurgaon Canal, GC-1 (Near Badarpur Border), Haryana has average level of BOD varying from 20 mg/l to 23.7 mg/l, indicating high pollution level and unsuitable for use as class A, B & C. Similar situation is at Agra Canal (Madanpur Khadar), Delhi where average level of BOD varies from 14.7 mg/l to 19.3 mg/l indicating high pollution level and unsuitable for use as class A, B & C. The total coliform content at both these locations is high, making water unsuitable for use as Class C.
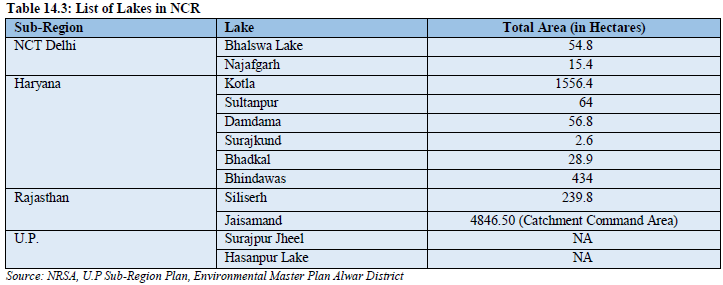
Box 14.4: Biological Diversity Act and Rule The Biological Diversity Act, 2002 (No. 18 of 2003) was notified by Government of India on 5th February, 2003. The Act extends to the whole of India and reaffirms the sovereign rights of the country over its biological resources. Subsequently the Government of India published Biological Diversity Rules, 2004 (15th April, 2004). D) Water Quality of Lakes in NCR There are a number of large and small lakes in NCR and smaller water bodies that accompany almost all villages/small towns; notable among them are as follows (Table 14.3).
Presently, Rajasthan State Pollution Control Board is monitoring two lakes in Alwar (Siliserh and Jaisamand Lake). The water quality status (2011) of the two lakes is given in Annexure 14/X. The BOD levels exceed the permissible limits for class C use (3mg/l) in both the lakes while the total coliform levels are within limit of class A use (50 MPN/100ml).
BIODIVERSITY IN NCR
Owing to its varied topography, geology & climatic conditions, NCR is rich in biodiversity with National Parks, Wildlife Sanctuaries, Aravali Mountains, and forests spread in the region. The biodiversity spots of NCR are broadly classified into the following: Forests, Ecologically Fragile Area – Aravalis; National Parks and Wildlife Sanctuaries; Wetlands and Forests. The existing status, issues and proposals on forests have been covered separately in this Chapter (Section 2). This section covers Aravalis, National Park & Wildlife Sanctuaries and Wetlands in NCR.
14.5.1. Ecologically Fragile area - Aravali Zone The major stretch of the Aravali range in the NCR, lies in Alwar District of the Rajasthan sub region and then it stretches towards the north into Gurgaon, Faridabad and Mewat Districts of the Haryana sub region of NCR. Delhi Ridge is the last leg of the Aravali Range, which traverses south to Delhi from Gurgaon and terminates at Central Delhi. The Aravalis have been divided into following three areas in NCR delineating their sensitivity to development:
i. The Delhi Ridge - The Ridge in Delhi is actually an extension of the Aravali hills that enter Gurgaon from south and sprawls towards Delhi. The Ridge has been divided into four zones (Table 14.4).
ii. Aravalis at Gurgaon and Faridabad, Haryana – The major portion of forest areas in Aravali section of Gurgaon and Faridabad in Haryana sub-region, mainly passing through agricultural fields or wastelands. iii. Aravalis at Alwar - The Aravali makes its appearance in the Alwar district from the northeast in Tijara subdivision and runs southward. The hilly ranges enclose between the fertile valleys and alluvial plains. A) Acts, Notifications and Court Directives on Aravali Aravali Notification, 1992 - The Ministry of Environment & Forests vide Aravali notification dated 7th May, 1992, have restricted certain developmental activities in the specific areas of NCR (Detailed notification in Annexure 14/XI)
B) Environment Master Plan for Aravali, 1999 – Complying with the MoEF directive, the Rajasthan State Pollution Control Board prepared and published Environmental Master Plan of Alwar District in 2011. The Environmental Master Plan Alwar recommended comprehensive measures for protection of Aravalis in alwar district. Besides, the Master Plan also recommended Tehsil wise detailed conservation measures. EMP for other districts in NCR have not yet been prepared.
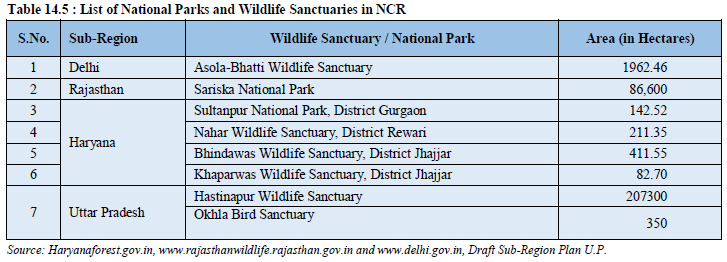
14.5.2. National Parks and Wildlife Sanctuaries in NCR There are 7 notified wildlife sanctuaries/National Parks in NCR. The Sub-Region wise list of National parks and Wildlife Sanctuaries in NCR is given in Table 14.5.
Box 14.5 Bio-Diversity parks in Delhi
DDA has developed two Bio-Diversity parks
YAMUNA BIODIVERSITY PARK
The Yamuna Biodiversity Park, Delhi, has been planned to act as a heritage site of approximately 50 communities of endangered species of flora & fauna on Yamuna river basin. DDA has proposed to develop over an area of 456 acres.
Aravali Bio-diversity Park
DDA is also developing Aravali Bio-diversity Park in an area of 227 ha. near Vasant Vihar, which will be completed in 10 years in phase manner.
14.5.3. Wetlands in NCR As per the list of Ramsar Convention on Wetlands, a part of the Upper Ganga river stretch (Naraura to Brijghat) in U.P. sub-region has been designated as a Ramsar wetland site. The approximate length of the Narora to Brijghat (U.P. sub-region) stretch is 82 km., covering an area of 26,590 ha. This stretch supports mammalian species like Ganges river dolphins (Platanista gangetica) listed in CITES, IUCN Redbook as Endangered, common-otters (Lutra lutra,), two species of crocodiles i.e. Gavialis gangeticus and Crocodylus palustris. Under the national legislation, these species are also protected as Schedule I of Wildlife protection Act 1972.
