National Capital Region (India): Environment
This article has been sourced from an authoritative, official readers who wish to update or add further details can do so on a ‘Part II’ of this article. |
The source of this article
Draft Revised Regional Plan 2021: National Capital Region
July, 2013
National Capital Region Planning Board, Ministry of Urban Development, Govt. of India, Core-4B, First Floor, India Habitat Centre, Lodhi Road, New Delhi-110003
National Capital Region Planning Board
National Capital Region (India): Environment
BACKGROUND
NCR is a predominantly an urban region with more than 108 urban centers and 62.5% urbanization as against the all India average of 31.2%. The region is endowed with several ecologically sensitive natural features which needs to be preserved and protected. However, the pressure to convert agricultural land into non-agricultural and abiotic uses in order to realize the high land value potential is extremely severe. The Regional Plan 2021 for the National Capital Region calls for a balanced approach, incorporating environmental considerations into planning process for a sustainable development of NCR. This chapter on Environment focuses on: i. Forests ii. Air iii. Water (surface) iv. Notable environmentally sensitive areas within the NCR. It discusses the present status, temporal changes, issues of major concern, and finally the way forward.
14.2. FORESTS IN THE NATIONAL CAPITAL REGION
Forests are an important natural resource and once degraded the land is usually unable to support forests again. The ever increasing demand for food, fuel, fodder and the growing demand of land for urbanization has however, put tremendous pressure on the scarce forest resources of the region. The National Forest Policy, 1988, aims to have a minimum of 1/3rd of the total land area of the country under forest and tree cover. The following sections discuss the current status of forest cover and temporal change over the last decade (based on India State of Forest Reports, 2001, 2005, 2009 and 2011, FSI) in the NCR. It may be noted that the definition of green areas presented in the Regional Land Use Chapter differ from the definition of forest cover in this Chapter due to: (i) the green areas in Regional Land use Chapter include dense forest areas, forest vegetation and scrubs (ii) same definition was used in 1999 for the land use change analysis. In this Chapter, FSI Data has been used to analyze forest cover in NCR and comparison with all India figures.
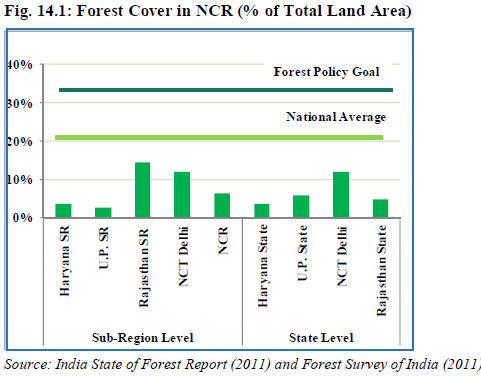
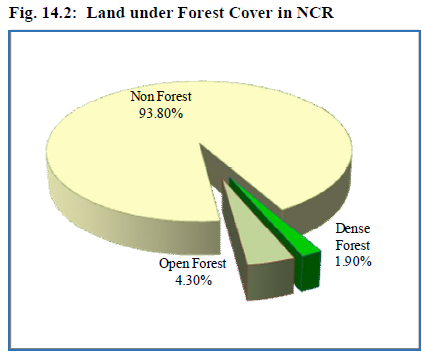
14.2.1 Present Status of Forest Cover in NCR. At all India level, forest cover forms 21% of the total Geographical Area. In the National Capital Region, forests are spread over an area of 2131.2 sq. km., which is 6.2% of the total land area of NCR (India State of Forest Report, 2011). Within NCR, Rajasthan sub-region has 14.4% of its total land area under forest cover, followed by Sub-Regions of NCT Delhi (11.9%), Haryana (3.5%) and Uttar Pradesh (2.6%) respectively (Annexure 14/I). Besides forest cover, at all India level, 2.76% of the total geographical area is under tree cover, thus improving the percentage area under total forest and tree cover to 23.81%. In NCT Delhi, tree cover forms 8% of total geographical area, and with forest cover of 11.9%, the total area under forest and tree cover forms 19.9% (Figures 14.1 and 14.2).
Box 14.1
Proportion of forest cover in NCR to its total geographical area is 6.2% against a national average of 21.05% None of the sub-regions of the NCR have forest cover comparable with the present All- India average.
Note: Dense forests include very dense to moderately dense forests. The Forest Survey of India conducts the assessment of forest resources biannually and classifies forests as: (i) Very Dense Forest (> 70% canopy density); (ii) Moderately Dense Forest (40%-70%), (iii) Open Forest (10-40%) and (iv) Scrub (< 10%).
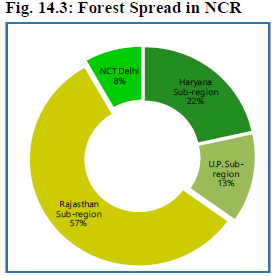
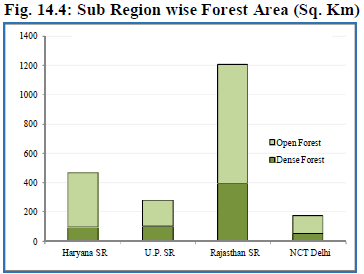
Dense forests are more productive than the Open forests which have much lesser canopy density (Table 14.1). As forest degrades, the canopy density also decreases. In terms of spatial concentration, of the total area of 2131.2 sq. km., nearly 57% of the forest cover in NCR is in Rajasthan Sub-region (mainly concentrated in Aravali mountain range), followed by 22% in Haryana sub-region. UP sub-region accounts for 13% of NCR forest cover, and the rest 8% is in NCT Delhi (Figure 14.3 and Figure 14.4).
A) Region Wise Current Status (2011)
(i) NCT Delhi - The forests in NCT Delhi are spread over 176 sq. km. (11.9% of area), while the recorded forest area is 85 sq. km. (5.7% of area), comprising reserve and protected forests (Figure 14.5). Besides, NCT Delhi has considerable tree cover (120 sq. km. or 8.0% of area), and thus the total area under forests and tree cover is (296 sq. km. or 19.9% of area). Of the total forests, 32% are dense forests; rests are open forests.
(ii) Haryana - In Haryana sub-region, forests are mostly situated in Gurgaon and Faridabad districts. The forest cover in Haryana sub-region in 2011 is 468 sq. km. (3.5% of area) (Figure 14.5). Of the total forests in the sub-region, 21% are dense forests, and the rest are open forests. Four districts – Panipat, Sonepat, Rohtak and Jhajjar have less than 2% of the total geographical area under forest cover.
(iii) Uttar Pradesh - Uttar Pradesh sub-region has least forest cover, as compared to other sub-regions of NCR, (Figure 14.5). It has a forest cover of 282 sq. km., which is about 2.6% of the total geographical area of the sub-region (36% are dense, and the rest 64% are open forests).
(iv) Rajasthan - Rajasthan sub-region has a forest cover of 1,205 sq. km., which is about 14.4% of its total geographical area. This sub-region has the largest forest cover in the NCR – about 56.5% of total forest cover of NCR is in Rajasthan sub-region. Of the total forests in the sub-region, 33% are dense forests, and the rest are open forests (Figure 14.5).
[
14.2.2. Temporal changes in forest cover (2001-2011)
ALL INDIA: At an all India level, the forest cover has increased from 20.6% to 21.1% over the last decade (2001-2011), in absolute terms, this amount to an increase of 16,489 sq. km. (0.5%) in the forest cover.
NCR: The overall area under forests, during 2001-2011, has increased by 52.9 sq. km., representing a 2.5% increase over the last decade. While there has been an increase in total forest cover, dense forest cover in NCR has declined by 260 sq. km. (about 28% decline), the area under open forest cover has increased by 312.6 sq. km. (about 27% increase) (Figure 14.6). This change is due to degradation of dense forest into open forest and addition of open forest cover through improvement of tree cover in scrub, waste lands and others. Similar trend has been noticed at All India level. The details of temporal change in NCR forest cover is provided in Table 14.2 and Annexure 14/II.
A) Sub-Region wise temporal change (2001-11)
(i) Delhi - NCT Delhi added 64.9 sq.km. of forest cover (2001-11), increasing its proportion of
forest area to total land area from 7.5% in 2001 to 11.9% in 2011. Contrary to regional and
national trend of decline in dense forests and increase in open forest, NCT Delhi has
increased its cover in both categories. Dense forest increased by 18.2 sq.km. (48% increase in
dense forest cover), and open forests by 46.6 sq. km. (63.6% increase). Annexure 14/III presents
the details of temporal change in forest cover in NCT Delhi.
Box 14.2 During 2001-11, the forest cover in NCR has increased by 2.5% or in absolute terms, 52.9 sq. km of forest area, but dense forests has declined by 28% while open forest increased by 27%.


