National Capital Region (India): Counter-Magnet Areas
This article has been sourced from an authoritative, official readers who wish to update or add further details can do so on a ‘Part II’ of this article. |
The source of this article
Draft Revised Regional Plan 2021: National Capital Region
July, 2013
National Capital Region Planning Board, Ministry of Urban Development, Govt. of India, Core-4B, First Floor, India Habitat Centre, Lodhi Road, New Delhi-110003
National Capital Region Planning Board
National Capital Region (India): Counter-Magnet Areas
BACKGROUND
Section 8(f) of the NCR Planning Board Act, 1985 empowers the Board to select, in consultation with the State Governments concerned, any urban area outside National Capital Region (NCR) having regard to its location, population and potential for growth, which may be developed as Counter-Magnet Area (CMA) in order to achieve the objectives of the Regional Plan. The counter-magnet area as envisaged in Regional Plan-2001 for NCR was to play two distinctive and mutually complementary roles in the context of NCR:
a) As interceptors of migratory flows into NCR, which may escalate, as the accelerated development of the NCR would provide a pull to migrants from the less developed adjoining areas;
b) As regional growth centres in the region of their setting, which would help to achieve a balanced pattern of urbanization over a period of time.
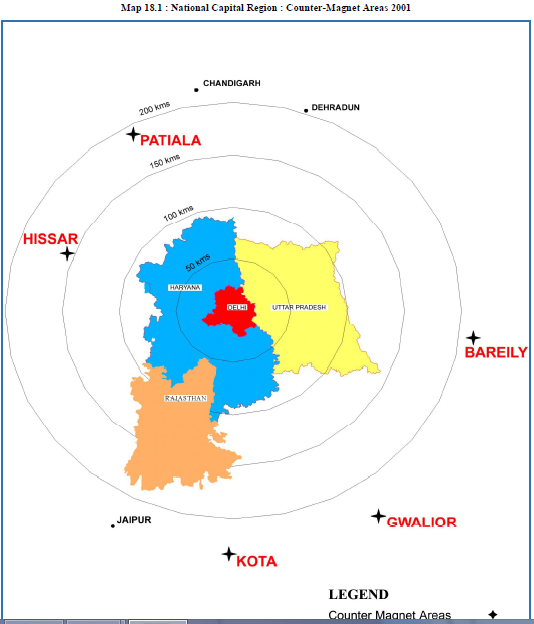
Regional Plan-2001 for NCR envisaged that any such urban area which are located sufficiently away from NCR and have its known established roots and inherent potentials to function as viable independent growth foci may act as counter-magnet for the Region. After a detailed study taking into consideration various parameters such as nodality with respect to transportation network including the quality of physical linkages in the form of transportation and communications facilities, spatial, size, viability, migration, etc., five Counter-Magnets were identified namely; Bareilly in Uttar Pradesh; Gwalior in Madhya Pradesh; Hisar in Haryana; Kota in Rajasthan and Patiala in Punjab in the said Plan (Map 18.1 National Capital Region: Counter –Magnet Areas 2001).
Regional Plan-2001 for NCR also proposed policy guidelines for the development of the Counter-Magnet
Areas which were reiterated in the Regional Plan-2021 for NCR. It was proposed that the respective State
Governments/implementing agencies would prepare an integrated development programme for the
Counter-Magnet Areas for strengthening their economic base and upgradation its physical and social
infrastructure. The concerned State Governments were also required to take steps to strengthen the
organizational capacities of the local bodies/development authorities and provide adequate financial
resources for development. The Central Government and NCR Planning Board were to provide financial
assistance for strengthening of regional linkages like transport, communications, etc., for the development
of these areas.
The Study Group on NCR Policy Zones, Demographic profile and settlement pattern constituted while
preparing the Regional Plan-2021 for NCR was of the view that the selection of counter-magnets in
areas/States, from where only less than six percent migrants come to NCT-Delhi do not appear to be
justified and there is a need to review the policy in detail. To be effective, counter-magnet areas need to
be located at a reasonable distance from NCT-Delhi and should have adequate potential for development
to retain the out migration.
As indicated in the Chapter 4 of the Plan, the Census data for migration were available upto 1991
while preparing the Regional Plan-2021 for NCR and therefore, analysis of the migration pattern
could not be carried out. However, there has been a perceptible change in the growth dynamics in terms
of labour mobility, investment patterns, economic structure, connectivity i.e., communication, rail,
road and air, availability of infrastructure facilities and civic amenities etc. in the intervening period.
Subsequently, on the release of current migration data by the census of India for the year 2001, Board
commissioned a Study on Counter-Magnet Areas to Delhi and National Capital Region through a
Consultant. The Study was to review the counter-magnet areas development strategy including selection
of counter-magnet areas as adopted by the Board and to suggest appropriate changes in the strategy, if any
and evolve an alternative strategy for the development of counter-magnet areas for making them to play
an effective role in achieving the objectives of the Regional Plan-2021 for NCR.
18.2 REVIEW OF EXISTING CMAS DURING THE INTERVENING PERIOD
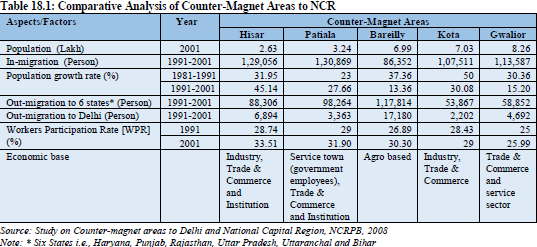
Comparative performance of existing CMA’s was analyzed and status of the outcome is given in the Table 18.1.
In order to review the status of developmental activities covering location and connectivity, regional
importance, population, migration and economic base, master plan, and status report of NCRPB funded
projects for each town a reconnaissance survey was taken up during the Study for all the five existing
counter-magnet areas of Hisar, Patiala, Gwalior, Bareilly and Kota. As per Census 2001, in all the
CMA’s, the net-migration is positive i.e., in-migration is higher than out-migration except in case of
Bareilly. Similarly workers participation rate in all the CMAs has increased and regional connectivity has
improved. Decadal growth rate in case of Bareilly, Gwalior and Kota has reduced whereas in other two
areas it has increased. Individually Hisar has improved water supply and sewerage system, Patiala besides
water supply and sewerage has got an integrated township in process, Bareilly has got two residential
development schemes besides Transport Nagar, Kota developed integrated township and Gwalior
developed a new town development scheme.
18.3 MIGRATION TO NCT-DELHI AND NCR BASED ON THE STUDY
18.3.1 Trend of Migration to Delhi
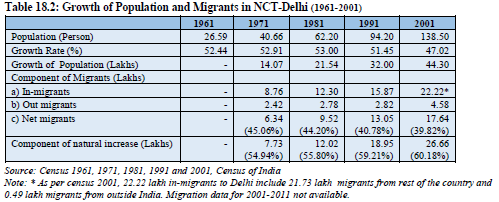
The Study revealed that the population of NCT-Delhi has increased from 40.66 lakhs in 1971 to 138.5 lakhs in 2001 (refer Table 4.6 of Chapter 4). Population of NCT-Delhi increased to 167.5 lakh in 2011(Census 2011). Since migration data for 2001-2011 is not available, migration data could not be
analyzed. As indicated in Table 18.2, the in-migration during same period has increased from 8.76 lakh in 1971 to 22.22 lakh in 2001. However, the share of out-migration from NCT-Delhi has slightly increased from 2.42 lakh in 1961-1971 to 2.82 lakh during 1981-1991 and further to 4.58 lakh in 1991-2001. The percentage of net migrants (In-migrants – Out-migrants) to NCT-Delhi has decreased from 45.06% during 1961-1971 to 39.82% during 1991-2001. However, it has increased to 17.64 lakh during 1991-2001 in absolute numbers.
The profile of the migrants highlights that the total migration to NCT-Delhi in the decade 1991-2001 including migration within the State of enumeration is 23.54 lakh i.e., 21.73 lakhs migrants from rest of the country to NCT-Delhi, 0.49 lakhs migrants from outside India to NCT-Delhi and 1.32 lakh migration within the State of enumeration. The composition of migrants in terms of literacy is 70.18% literates and 29.82% are illiterates, which is comparatively higher than the average literacy rate of the country i.e., 65.37%. The sex ratio of migrant population is 785 females per 1000 male which is lower than sex ratio of NCT-Delhi i.e., 821. Out of the total migrants coming to NCT-Delhi, 56% are the male migrants and 44% are the female migrants. The percentage of male illiterates i.e., 23.85% is lesser than female illiterates, which is 37.43%. The work participation rate of people migrating to NCT-Delhi is 43.21% which is higher than the WPR of NCT-Delhi i.e., 38.82%.
18.3.2 State-wise in-migration to NCT-Delhi
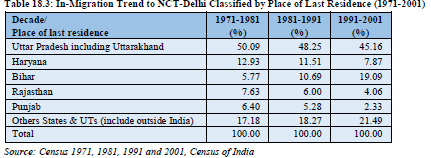
As per 2001 census, Uttar Pradesh and Bihar had sent maximum migration to NCT-Delhi and together contribute 64.25% of the total migration. Uttar Pradesh including Uttarakhand sent maximum migration of 45.16% followed by Bihar i.e., 19.09%. The percentage share of migration from Bihar has increased from 5.77% in 1971-1981 to 19.09% in 1991-2001. On the other hand, migration from Uttar Pradesh including Uttarakhand, Rajasthan, Punjab and Haryana has marginally decreased (refer Table 18.3). It has reduced from 50.09%, 12.93%, 7.63% and 6.40% in 1971-1981 to 45.16% including Uttarakhand, 7.87%, 4.06% and 2.33% in 1991-2001 from Uttar Pradesh, Haryana, Rajasthan and Punjab, respectively.
18.3.3 In-Migration to NCT Delhi and Rest of NCR including inter-district migration within Rest
of NCR
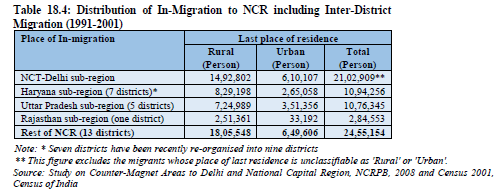
Table 18.4 reveals that during 1991-2001, in-migration to NCTD is 21,02,909 persons which include the migrants whose place of last residence is unclassifiable as 'Rural' or 'Urban' however, in-migration from rural and urban is 14,92,802 persons and 6,10,107 persons, respectively. Migration to Rest of NCR including inter-district migration within Rest of NCR is 24,55,154 persons where 6,49,606 persons is from urban areas and 18,05,548 persons is from rural areas.
18.3.4 In-migration to Rest of NCR excluding Inter-District Migration
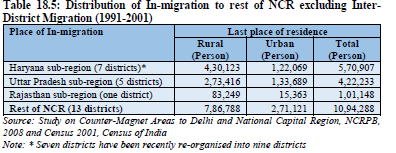
The total in-migration to Rest of NCR excluding inter-district migration within Rest of NCR is 10,94,288 persons where 2,71,121 persons is from urban areas and 7,86,788 is from rural areas (Table 18.5).
18.3.5 Reasons of Migration to NCT-Delhi
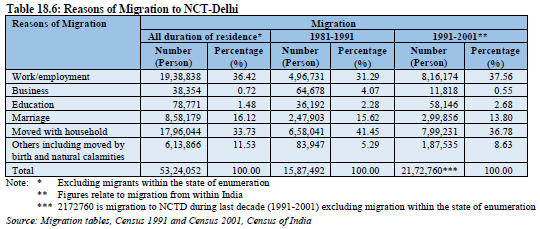
The main reasons for migration to NCT-Delhi as per Census 2001 in descending order are employment, family movement (moved with household), marriage, education and business, which account for 37.56%, 36.78%, 13.80%, 2.68% and 0.54% of migrants, respectively during 1991-2001. Thus, work/employment and persons moved with household dominate as the reason for migration which together accounts for around 75 % of the migration to NCT-Delhi. The share of migration due to employment is 36.42 % for all duration of residence while it was 37.56 % during the last decade i.e., 1991-2001. The share of migrants due to education is 2.68% during 1991-2001 compared to 1.48% for all duration of stay. If the migration pattern for all duration of residence and migration during 1991-2001 is compared, it is observed that share of migrants for education and persons moved with household has increased from 1.48% and 33.73% to 2.68% and 36.78%, respectively. While percentage of migrants due to marriage has decreased from 16.12% to 13.80% for the same time period. It can be observed from the table below that the trend of
migration to NCT-Delhi for the employment purpose has increased from 31.29% to 37.60% from the decade 1981-1991 to decade 1991-2001 (Table 18.6).
It indicates that the Core of the Region should adopt such economic policies and activities which attract less large scale job creation and restrain the flow of migrants coming to the Core of the Region. This also means strict follow up and review of the economic policies of the Core on a regular interval to monitor the flow of migrants and restructure the economic policies from time to time. Major observations of the past trend in National Capital Region as the Study depict the following:
i) NCT-Delhi dominates the population trend in the NCR. In a span of five decades 1961-2001, the population has increased 5 fold. The decadal growth rate has been consistently above 50% from 1961-1991, except for the period of 1991-2001 which is 46.81%. The increase in net migration has been about 3 folds from 1961-2001 i.e., 6.34 lakhs in 1961-1971 to 17.64 lakhs in 1991-2001(refer Table 18.2).
ii) Population in Haryana sub-region has increased by three times in five decades i.e., 28.93 lakh in 1961 to 86.87 lakh in 2001. The decadal growth of 34.55 % was highest in the span of 1981-1991. The sub-region registered highest increase of 20.43 lakh population from 1991-2001.
iii) Uttar Pradesh sub-region has witnessed increase of 2.5 times in the period of five decades (1961- 2001). The decadal growth rate has been quite consistent from 1981-2001. The absolute increase in population is highest in comparison to other NCR sub-regions.
iv) The least influence to the NCR is from Rajasthan sub-region. Though the change in population is increasing steadily, the total contribution of the sub-region is lowest.
v) Analysis of migration data from Census 2001 reveals that out of 593 districts in India, 100 districts contribute migration towards NCT-Delhi which is 74% of total migrants. Out of these 100 districts the top 20 districts accommodate 31.76 % of the total migrants to NCT-Delhi. These 20 districts are located in Uttar Pradesh, Bihar, Haryana, Uttarakhand, Jharkhand and Kolkata (refer Table 18.7). Migration data for 2001-2011 not available.
vi) As indicated in following table, among these top 20 districts, 10 districts are from Uttar Pradesh namely, Bulandshahr, Aligarh, Meerut, Ghaziabad, Etah, Azamgarh, Gorakhpur, Agra, Budaun and Muzaffarnagar which contribute maximum migrants to NCT-Delhi which is about 17.32 % of the total migrants. Five districts of Bihar, which include Madhubani, Darbhanga, Patna, Samastipur and Muzaffarpur are among the top 20 districts consisting of 7.71% of total migrants to NCT-Delhi. The migration from two districts of Haryana i.e., Sonepat and Rohtak is 2.48% of total migrants. The migration from remaining three districts is 1.45%, 1.48% and 1.35% from Garhwal in Uttranchal (now Uttarakhand), Chatra in Jharkand and Kolkata in West Bengal, respectively.
vii) Out of these top 20 districts, 11 districts contribute maximum migrations which are within 300 kilometre distance from NCT -Delhi. NCT-Delhi is mostly receiving maximum migration from nearby districts located within NCR area i.e., Ghaziabad, Bulandshahr and Meerut of Uttar Pradesh sub-region and Rohtak and Sonepat of Haryana sub-region. Bulandshahr sent highest migrants to NCT-Delhi i.e., 2.96% of the total migrants. This also emphasizes the need of providing efficient, affordable and reliable public mass transport system in the form of sub-urban rail system (RRTS) in the Region especially connecting these towns/districts. In order to further check the migration from these towns/districts the opportunities need to be maximized to enable them to compete effectively with NCT-Delhi offering jobs, economic activities, comprehensive transport system, housing, social infrastructure and quality of environment, if not better at least at par with NCT-Delhi.
viii) Analysis of migration data from Census 2001 reveals that out of 593 districts in India, 100 districts are sending maximum migration to Rest of NCR which is 81.29% of total migrants. It is also observed that 81 districts out of the top 100 districts sending migrants to NCT-Delhi and the Rest of NCR are common. These 81 common districts contribute 72.78% of total migrants to Rest of NCR districts including NCT-Delhi which is 34,36,058 persons (Table 18.8).
Accordingly, in total 119 districts are sending maximum migrants to NCT-Delhi and Rest of NCR. The demographical trends clearly show that there is an impact of implementation of the policies envisaged in the Regional Plans and financing of infrastructure projects in the NCR by the Board on the net-migration to the NCT-Delhi, which are as follows:
i) The growth of population in NCT-Delhi has declined to 47.02% in the decade 1991-2001, as compared to the growth of population since 1951 recording decennial growth rates of 52.44%, 52.93%, 53% and 51.45% for the decades in 1951-1961, 1961-1971, 1971-1981 and 1981-1991 respectively (refer Table 18.2). ii) There is also a decline in the percentage share of net-migrants in the decadal growth of population in NCT-Delhi from 45.06% in 1961-1971 to 39.82% in 1991-2001 (refer Table 18.2). There is a gradual rise in the decadal component of natural increase of population from 7.73 lakh in 1961-1971 to 12.02 lakh in 1971-1981 to 18.95 lakh in 1981-1991 and 26.66 lakh in the year 1991-2001.
iii) The percentage share of migration from NCR States viz., Haryana, Rajasthan and Uttar Pradesh to NCT-Delhi consistently declined in the last three decades. Taken together, the share of migrants from the three States declined from 65.76% in 1981-1991 to 57.09% in 1991-2001 including 5.11% from Uttarakhand.
iv) The number of out-migrants from NCT-Delhi which ranged from 2.42 lakh to 2.82 lakh in the three decades preceding 1991-2001 increased to 4.58 lakh in the decade 1991-2001 (Table 18.2). It would be worthwhile to note from the above facts that the net-migration from the constituent States of NCR has declined significantly. A linked conclusion based on the foregoing population indicators seems to suggest that urban areas of NCR are growing significantly to start a trend of out-migration from the NCTDelhi and also to act as counter-magnet to the NCT-Delhi to attract migrants from the States outside NCR.
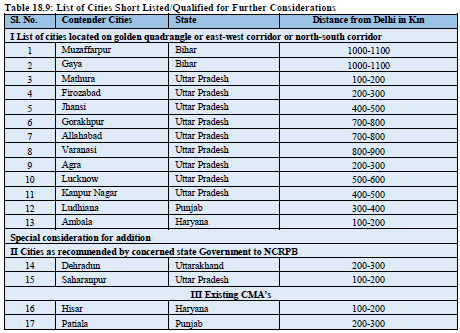
18.4 SELECTION OF COUNTER – MAGNET AREAS In order to select CMAs top 100 districts were short listed based on migration data analysis as the contenders since these were contributing about 3/4th of the total migration to the Region i.e., NCT-Delhi and Rest of NCR districts. The identification criteria like distance, population at stage-I, special consideration for lateral addition and deletion at stage-II and final criteria for selection i.e. migration from influence zone, development index like infrastructure development index and district development index were used for selecting the Counter Magnet Areas. Based on these identification criteria, the top 100 districts were subjected to consideration such as distance and subsequently the cities/towns in these districts were considered for population and locational attributes. Considering these aspects, the Study report recommended thirteen cities/towns contender for proposed counter-magnet areas (refer Table 18.9). Adding in the five existing counter-magnet areas and two recommended by the State Governments, the twenty cities/towns were subject to further study i.e., existing conditions of development and strategy for further development.
Since, some of the cities/towns are located in proximity i.e., within 100 km distance were deleted and
cities/towns with better potential for industrial and other development or for other significant reasons
were retained. The remaining fifteen cities/towns were further examined from the point of view of
influence zone and sending migration less than one lakh to focus on areas/zone sending maximum
migration. Nine cities/towns selected in the previous stage and finally to select the proposed CMA’s on
the basis of their economic potential, in addition to the composite infrastructure index compiled by CMIE,
the Study report also applied District Development Index published by Ministry of Finance. Considering
the various aspects, Study report recommended six cities/towns as Counter-Magnet Areas for NCR
requiring immediate developments which are located in all directions of high migration with respect to
NCR/NCT-Delhi. These recommendations of the Consultant were presented and discussed with NCR
participating States and all the other stakeholders Workshop held on 22.11.2007 and finally five
cities/towns emerged as the final selection as the counter-magnet areas for NCR. The five proposed
CMA’s covers 24 districts within their influence zone and have the potential to tackle around 8 lakh
people migrating to NCR including NCT-Delhi. These recommendations of the Study on Counter-Magnet
Areas to the National Capital Region were discussed in the 56th meeting of the statutory Planning
Committee of the Board held on 19.01.2008 and following cities/towns were identified as Counter-
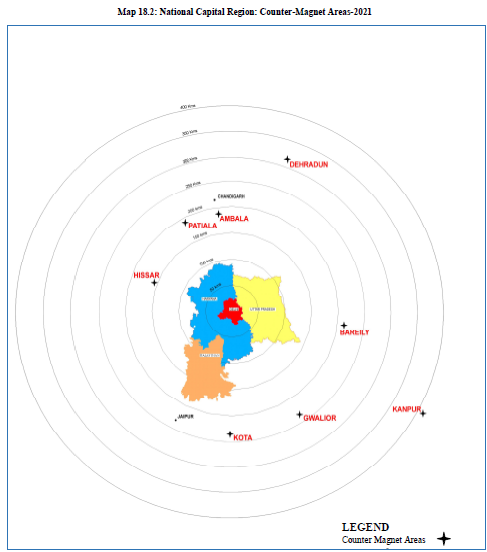
Magnet Areas for NCR (Map 18.2 National Capital Region: Counter-Magnet Areas 2021).
i) Ambala in Haryana
ii) Bareilly in Uttar Pradesh
iii) Dehradun in Uttarakhand
iv) Hisar in Haryana
v) Kanpur Nagar in Uttar Pradesh
It was also decided that these counter-magnet areas shall be an area of about 120 kms radius around the above identified towns as zone of influence for migration. Concerned State Governments shall notify their respective Counter-Magnet Areas proposed to be developed in and around these towns and prepare Development Plan and Plan of Action for its implementation. While preparing the Plan, the concerned State Governments will consider the strategies proposed for their development in the said Study.
The Committee regarding the three existing CMAs, namely, Gwalior in MP, Kota in Rajasthan and Patiala in Punjab decided that these may continue as Counter-Magnet Areas. However, financing to the projects of these Counter-Magnet Areas would be given low priority. Further, the committee recommended that the Ministry of Urban Development, Government of India and Planning Commission may be requested to consider a Special Package for Allahabad, Gorakhpur and Muzzafarpur and area around these cities/towns to improve the infrastructure facilities and employment opportunities in these areas as in the Study these three places had a very low infrastructure development index in comparison to other identified places. NCR Planning Board would not associate in any kind of intervention with these areas.
The recommendations of the Planning Committee were approved by the Board in its 31st meeting held on 11.11.2009. Board also decided that the Counter-Magnet Areas should not limit to urban area only and development could be proposed in the form of corridors also. Respective State Governments shall notify their respective Counter-Magnet Areas and prepare Development Plan/Master Plan and Plan of Action for its implementation.
