Life Expectancy: India
This is a collection of articles archived for the excellence of their content. |
Contents |
1990–2013: 8.6 years added
December 18, 2014

One of the Best gains worldwide: The Lancet
Every fifth death in the world is that of an Indian, but Indians are also living at least 8.6 years longer on an average than in 1990, one of the best gains worldwide in life expectancy. In 2013, heart, lung or brain problems caused a third of all mortality in the country. Suicides, road traffic accidents and lifestyle disease diabetes have now muscled into the top 10 killers' list. Tuberculosis and heart diseases are the largest killers of Indians in the most productive age group of 15 to 49 years, says the first country-specific cause-of-death data for 188 countries published in The Lancet on
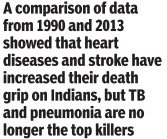
A comparison of the data from 1990 and 2013 showed that heart diseases and stroke have increased their death grip on Indians, but TB and pneumonia are no longer the top killers. “It is good news for India that the death share (26%) of the three major infectious diseases --tuberculosis (9%), pneumonia (9%) and diarrhoea (8%) -has reduced by 50% during the last 23 years,“ said Kaushalendra Kumar, one of the co-authors from the International Institute for Population Sciences in Deonar.
Another co-author Dr Nobhojit Roy , professor at BARC Hospital in Chembur, concurred. “India is going through an epidemiological transition with communicable diseases going down and non-communicable diseases going up. Diseases like malaria and HIV are down and lifestyle-related diseases such as heart diseases and hypertension are going up. The biggest indicator of India's relative better health is the rise in life expectancy.“Life expectancy improved for both men (64.2 years) and women (68.5 years) in India, at an average of 8.6 years gained since 1990. This was a larger increase than the global aver age, and one of the top 25 biggest gains in life expectancy worldwide, said the report.
The global report, coordinated by the Institute for Health Metrics and Evaluation (IHME) and funded by the Bill & Melinda Gates Foundation, said people live longer worldwide than they did two decades ago as death rates from infectious diseases and cardiovascular disease have fallen.
Since 1990, India saw marked declines in mortality from a number of diseases that used to take a large toll on the country . For instance, by 2013, mortality from diarrhoeal diseases reduced by 42%. In 1990, pneumonia and diarrhoeal diseases killed 15,32,459 people.Twenty-three years later, they claimed 7,15,303 fewer lives.
India, however, came in for a bit of criticism for poor health records while neighbouring China won praise for providing detailed reports.“India has to spend on research and surveillance. If you don't know what is killing people, how will you plan a health programme to check it?“ asked Dr Roy .
“All our policies and programmes are based on virtually no data and, therefore, it is difficult to measure effects of policy interventions or initiate effective programmes,“ said Kumar.
1990-2016, life expectancy at birth
See graphic:
Life expectancy at birth, 1990-2016, state-wise
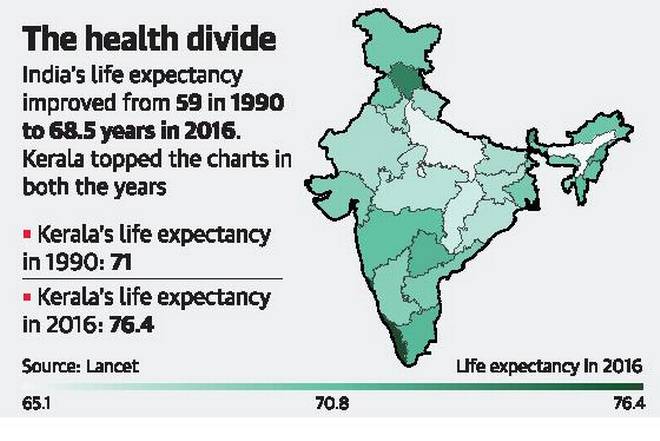
From: Bindu Shajan Perappadan, Indians add more years to their lives, November 15, 2017: The Hindu
Longer life but burdened with illness
The Times of India, Jun 09 2015

Sushmi Dey
Indians live longer, but spend more time with illnesses
While people across the globe are living longer, they are spending more time recovering from sickness. The reasons are non-fatal illnesses and injuries such as diabetes and hearing loss which pose the next major threat in terms of disease burden, says the latest study by a consortium of international researchers. In India, diabetes and other musculoskeletal disorders have replaced diarrheal diseases and vision problems as leading causes of years lived with disability (YLDs) a measure of overall disease burden, expressed as the number of years lost due to ill-health.
Between 1990 and 2013, years lived with disability among women with diabetes increased by 109%, whereas from other musculoskeletal disorders increased by 110% in India.However, iron-deficiency anemia decreased by 12%.Diabetes YLDs also increased for men in India be tween 1990 and 2013, climbing 136%. Among men, YLDs from chronic obstructive pulmonary disease (COPD) increased by 76%, and iron-deficiency anemia YLDs decreased by 32%.
The study says countries around the world may have made significant progress in addressing fatal diseases, but globally the years lived by people with disability increased from 537.6 million in 1990 to 764.8 million in 2013, for both sexes.
The study was conducted by researchers working on the Global Burden of Disease project and led by the Institute for Health Metrics and Evaluation (IHME) at the University of Washing ton. It was published in The Lancet on June 8.
“With success in delaying death, the years of life lived with ill-health are increasing. For example, this has more than doubled in India for diabetes over the past two decades. Accurate understanding of the causes of ill-health is crucial for planning of appropriate health services,“ Lalit Dandona, study co-author and professor at Public Health Foundation of India said.
Apart from diabetes, migraines, chronic obstructive pulmonary disease (COPD), neck pain, anxiety disorder and hearing loss were among the 10 leading causes of YLDs in 2013.
Life Expectancy at birth, after 60/ 2010-14
Subodh Varma, J&K tops post-60 life expectancy list, Oct 27 2016 : The Times of India

i) The actual number of years that the average resident of the 5 best states lived after 60, presumably in the same 2010-14 period, and
ii) Life expectancy in the 5 best countries in 2014.
The Times of India
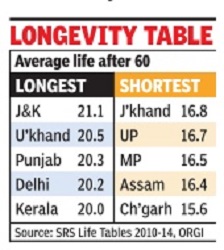
How long will an Indian live after 60? It de pends on which state you live in. Post-60 life expectancy is highest in a state you would least expect -J&K. People of this state who are 60 years old will live for another 21.1 years on an average. At the other extreme is Chhattisgarh, where such life span is 15.6 years.On an average, in India, a man will live for another 17 years and a woman for 19 years after turning 60.
These facets of life and death across all states, and over the years, emerge from recently released `Life Tables' whi ch showcase yearly mortality data collected from a sample of about 7.4 million people across the country. This work is done by the Sample Registration System (SRS) under the Census office. The most recent data is from 2010-2014. Life expectancy can be calculated at birth or at various points in life. `At birth' calculations average out death rates at all subsequent ages.This is usually said to be life expectancy of people in any country or a state within a country ,“ demographer P M Kulkarni, formerly of JNU, said.
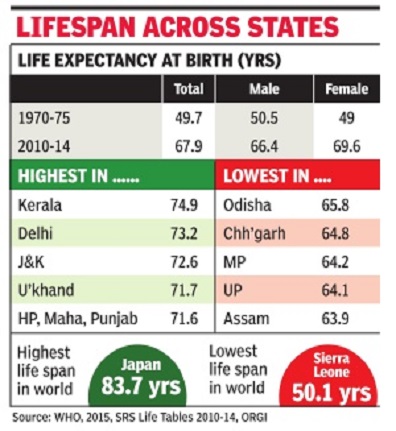
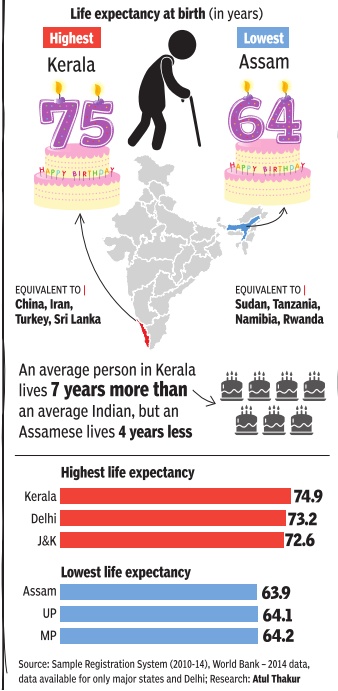
In 1970-75, people's average lifespan in India was just 49.7 years. By 2010-14, it had increased to 67.9 years, an increase of 18.2 years. Another change that has taken place is that women are now living longer than men. Four decades ago, men's average lifespan was 50.5 years compared to 49 years for women. This reversed in the mid-eighties and currently women's life expectancy stands at 69.6, almost three years more than men. Women living longer than men is a global trend attributed to higher death rates in men, being more exposed to health risks. Kerala, with its low infant mortality , higher incomes, higher education levels and better health indicators, has the highest lifespan of 74.9 years among all states. Closely following it are Delhi, J&K, Uttarakhand, Himachal Pradesh, Maharashtra, Punjab. Lowest lifespans are in Assam, followed by UP, MP, Chhattisgarh and Odisha.
Beyond the age of five years, J&K emerges as the state with highest lifespan for every five-year age group except the over 70 years group. According to experts, not too bad poverty levels (15% compared to India's average of about 30%), more equitable land ownership and the temperate climate in Kashmir valley that is less conducive for tropical diseases and pollution may have created conditions for this higher lifespan.
But why is there a difference between J&K's average life expectancy at birth (72.6) and life expectancy at 60 years age (81.1 years)? This is due to higher infant mortality rate, which is in turn dependent on how good are delivery and infant health care services. J&K's infant death rate was 37 per 1000 live births in 2013; the same as Jharkhand and only slightly below the national average of 40. “Once a child survives the first year, and then the first five years, conditions for survival and longer life spans improve considerably ,“ Kulkarni said.
2011: the best and worst states
See graphic : Life expectancy in the Indian states. The best and worst states in 2011
2017, life expectancy level
See graphic: Life expectancy, as in August 2017

