Higher Education, India: 1
This is a collection of articles archived for the excellence of their content. |
Admission of students to colleges
University can deny admission if all documents not produced: HC
Original documents a must for admission, says HC, Oct 11 2016 : The Times of India
Even if a candidate secures a rank in an entrance exam, the university can deny admission if all required documents are not produced, the Delhi high court has said.
HC dismissed a petition filed by a student, Bhim Shankar, seeking a direction to Delhi University (DU) to accept his degree certificate and grant him admission in the LLB course for 2016-2017 session.
Shankar had appeared for the LLB entrance examina tion and had secured a rank under the OBC category . Accordingly , he was called for counselling on August 22 but he could not submit the original graduation degree as required, DU later told court in response to Shankar's plea.
In his petition, the candidate told court he had graduated in 2012 but failed to collect his degree from the university .Once DU administration refused him admission due to nonsubmission of original documents, he collected his original degree on September 8, 2016 . When he approached DU with his original degree certificate after the counselling was over, the varsity did not agree to admit him, prompting him to approach HC. f counselling.
HC, however, reiterated that “a degree not collected cannot be equated with adegree not issued.“
It also held that it was mandatory for candidates to report with the documents in original at the specified date and time for counselling, failing which they would forfeit their claim for admission.
Autonomy
2018: 60 universities, colleges get special status
From: Manash Gohain, JNU among 60 univs, colleges to get major autonomy boost, March 21, 2018: The Times of India
The government rolled out its plan to grant more autonomy to better performing central, state and private universities, with UGC giving 60 institutions special status that will allow them to start new courses, offer competitive salaries and set up off-campus centres without approvals.
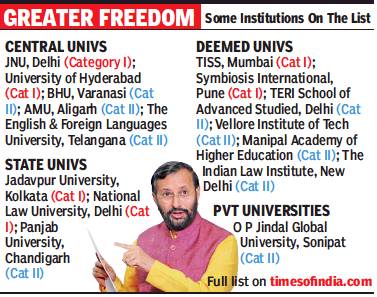
Two central universities — Jawaharlal Nehru University and University of Hyderabad — are in the top category, along with state universities such as Jadavpur University, Kolkata, Algappa University, Karaikudi, and Nalsar University of Law, Telangana, under the “graded autonomy” scheme. The private universities in the list include O P Jindal Global University, Sonipat, and Pandit Deen Dayal Petroleum University, Gujarat.
HRD minister Prakash Javadekar said the selected universities remain in the ambit of the University Grants Commission but will have the freedom to start new courses, off-campus centres, skill development courses, research parks and other new academic programmes. They will also be able to hire foreign faculty, enrol foreign students, provide incentivebased emoluments to faculty, enter into academic collaborations and run distance learning programmes.
As per UGC regulations on “graded autonomy”, five central universities, 21 state universities and 26 private universities have been given this status. Eight colleges have also been given autonomous status under the autonomous colleges regulation.
Autonomous universities with an NAAC score of 3.26 and above may start a new course or department without UGC’s approval, provided no demand for funds from the government is made. UGC, “recognising (that) autonomy is pivotal to promoting and institutionalising excellence in higher education”, notified the regulatory framework in February 2018 to facilitate better performing institutions to improve standards.
“The government is taking steps towards granting autonomy to institutions performing well. It started with the passing of the IIM bill granting complete autonomy to B-schools,” said Javadekar.
3 deemed univs to get show-cause notice for poor quality: Javadekar
The colleges granted autonomy will also be free to set their own syllabus, hold examinations, carry out evaluation as well as declare results. In this case, only the degree will be awarded by the respective university.
The minister also said that a show-cause notice will be given to three deemed universities which are lacking in quality.
The HRD minister said that selected universities will not have to come to the regulator repeatedly to seek permission because they have maintained quality and achieved a benchmark of 3.26 and above in NAAC ranking.
The central universities include Jawaharlal Nehru University (JNU), Aligarh Muslim University (AMU), Banaras Hindu University (BHU), University of Hyderabad and English and Foreign Languages University, Telangana.
The state varsities include Jadhavpur University, Andhra University, Algappa University, National University of Law, Utkal University, Kurukshetra University, Osmania University, Guru Nanak Dev University, University of Jammu, University of Mysore, Anna University, Punjab University and University of Madras, among others.
Categorization of universities as per UGC regulations on graded autonomy
|
Type of Universities |
Category I |
Category II |
Total |
|
Central Universities |
2 |
3 |
5 |
|
State Universities |
12 |
9 |
21 |
|
Deemed Universities |
11 |
13 |
24 |
|
Private Universities |
0 |
2 |
2 |
|
Autonomous colleges |
8 | ||
|
Total |
25 |
27 |
60 |
Universities for grant of graded autonomy
Central universities
|
S.No. |
Name of the University |
NAAC Score |
Category under the Regulations |
|
1. |
Jawaharlal Nehru University, Delhi |
3.77 |
I |
|
2. |
University of Hyderabad, Hyderabad |
3.72 |
I |
|
3. |
Banaras Hindu University, Varanasi |
3.41 |
II |
|
4. |
Aligarh Muslim University , Aligarh |
3.35 |
II |
|
5 |
The English and Foreign Languages University, Telengana |
3.26 |
II |
State universities
|
S.No. |
Name of the University |
NAAC Score |
Category under the Regulations |
|
1. |
Jadavpur University, Jadavpur, Kolkata |
3.68 |
I |
|
2. |
Algappa University, Karaikudi |
3.64 |
I |
|
3. |
NALSAR University of Law, Telangana |
3.60 |
I |
|
4. |
SavitribaiPhule Pune University, Pune |
3.60 |
I |
|
5. |
Andhra University, Visakhapatnam |
3.60 |
I |
|
6. |
National Law University Delhi, Dwarka |
3.59 |
I |
|
7. |
Utkal University, Bhubaneswar |
3.53 |
I |
|
8. |
Kurukshetra University, Kurukshetra |
3.52 |
I |
|
9. |
Sri Venkateswara University, Tirupati |
3.52 |
I |
|
10 |
Osmania University, Hyderabad |
3.52 |
I |
|
11. |
Guru Nanak Dev University, Amritsar |
3.51 |
I |
|
12. |
University of Jammu, Jammu |
3.51 |
I |
|
13. |
University of Mysore, Mysuru |
3.47 |
II |
|
14. |
Anna University, Chennai |
3.46 |
II |
|
15. |
Punjab University, Chandigarh |
3.35 |
II |
|
16. |
Kakatiya University, Warangal |
3.35 |
II |
|
17. |
Punjabi University, Patiala |
3.34 |
II |
|
18. |
Rajiv Gandhi University of Law, Patiala |
3.32 |
II |
|
19. |
National Law University Odisha, Cuttack |
3.32 |
II |
|
20. |
University of Madras, Chennai |
3.32 |
II |
|
21. |
Guru Jambheshwar University of Science & Technology, Hisar |
3.28 |
II |
Institutions deemed to be universities (Category I)
|
S. No. |
Name of the Institution Deemed to be University |
NAAC Score |
Category |
|
1 |
Homi Bhabha National Institute Mumbai, Maharashtra. |
A+ (3.53)
|
I |
|
2 |
Rashtriya Sanskrit Vidyapeetha
|
A +(3.71)
|
I |
|
3 |
Gandhi Institute of Technology and Management (GITAM)
|
A +(3.53)
|
I |
|
4 |
Narsee Monjee Institute of Studies
|
A +(3.59)
|
I |
|
5 |
Sri Ramachandra Medical College and Research Institute
|
A +(3.62)
|
I |
|
6 |
Dr. D.Y. Patil Vidyapeeth
|
A +(3.62)
|
I |
|
7 |
Shanmugha Arts, Science, Technology & Research Academy (SASTRA)Thanjavur, Tamil Nadu. |
A +(3.54) 11.05.2015 to 10.05.2020
|
I |
|
8 |
Symbiosis International
|
A +(3.58)
|
I |
|
9 |
Institute of Chemical Technology,Mumbai, Maharashtra. |
A ++(3.77)
|
I |
|
10 |
Datta Meghe Institute of Medical Sciences
|
A +(3.53) 30.10.2017 to 29.10.2024
|
I |
|
11 |
Tata Institute of Social Sciences
|
A ++(3.89)
|
I |
Institutions deemed to be universities (Category II)
|
S. No. |
Name of the Institution Deemed to be University |
NAAC Score |
Category |
|
1 |
TERI School of Advanced Studies
|
A (3.26)
|
II |
|
2 |
Jain University Bangalore, Karnataka. |
A (3.31)
|
II |
|
3 |
Vellore Institute of Technology
|
A (3.42)
|
II |
|
4 |
Manipal Academy of Higher Education |
A (3.30)
|
II |
|
5 |
KLE Academy of Higher Education and Research
|
A (3.34)
|
II |
|
6 |
Amrita Vishwa Vidyapeetham
|
A (3.40)
|
II |
|
7 |
Kalinga Institute of Industrial Technology (KIIT)
|
A (3.48)
|
II |
|
8 |
JSS Academy of Higher Education & Research
|
A (3.34)
|
II |
|
9 |
ICFAI Foundation for Higher Education and Research,
|
A (3.43)
|
II |
|
10 |
Dr. M.G.R. Educational and Research Institute
|
A (3.31)
|
II |
|
11 |
Padmashree Dr. D.Y. Patil Vidyapeeth Navi Mumbai,
|
A (3.40)
|
II |
|
12 |
The Indian Law Institute
|
A (3.35)
|
II |
|
13 |
Siksha ‘O’ Anusandhan
|
A (3.35)
|
II |
Private universities
|
S. No. |
Name of the Private University |
NAAC Score |
Category |
|
1 |
O.P. Jindal Global University
|
A (3.26)
|
II |
|
2 |
Pandit Deendayal Petroleum University
|
A (3.39)
|
II |
List of colleges conferred autonomous status by UGC
|
S. No |
Name of the College &affiliating University |
|
1 |
Yashvantrao Chavan Institute of Science, Satara, 533, Sadar Bazar, Satara Maharashtra-415 001 affiliated to Shiva-ji University, Kolhapur |
|
2 |
Sri Sivasubramaniya Nadar College of Engineering, Rajiv Gandhi Salai, Kalavakkam-603 110 (Tamilnadu) affiliated to Anna University, Chennai |
|
3 |
G. Narayanamma Institute of Technology & Science (For Women), 8-1-297/2/I, Shaikpet, Hyderabad-500 104 Telangana affiliated to JNTU Hyderabad, Telangana |
|
4 |
Vivekanand College, 2130/E, Tarabai Park, Kolhapur-416 003 (Maharastra) affiliated to Shiva-ji University, Kolhapur |
|
5 |
Sri Vasavi Engineering College, Pedatadepalli, Tadepalligudem-534 101 (West Godavari Dist.,) (Andhra Pradesh) affiliated to Jawaharlal Nehru Technological University, Kakinada |
|
6 |
Bonam Venkata Chalamayya Engineering College, Odalarevu-553 210,Allavaram Mandal, East Godavari Dist., Andhra Pradesh affiliated to Jawaharlal Nehru Technological University, Kakinada, Andhra Pradesh |
|
7 |
Jai Hind College Basantsing Institute of Science & J.T. Lalvani College of Commerce, 23-24 Backbay Reclamation, A-Road, Churchgate, Mumbai-400 020 affiliated to University of Mumbai, Mumbai-400 032 |
|
8 |
Shri Vile Parle Kelavani Mandal’s Mithibai College of Arts, Chauhan Institute of Amrutben Jivanlal College of Commerce and Economics, Vile Parle (West), Mumbai-400 056 affiliated to University of Mumbai |
Colleges
1794-2018: growth
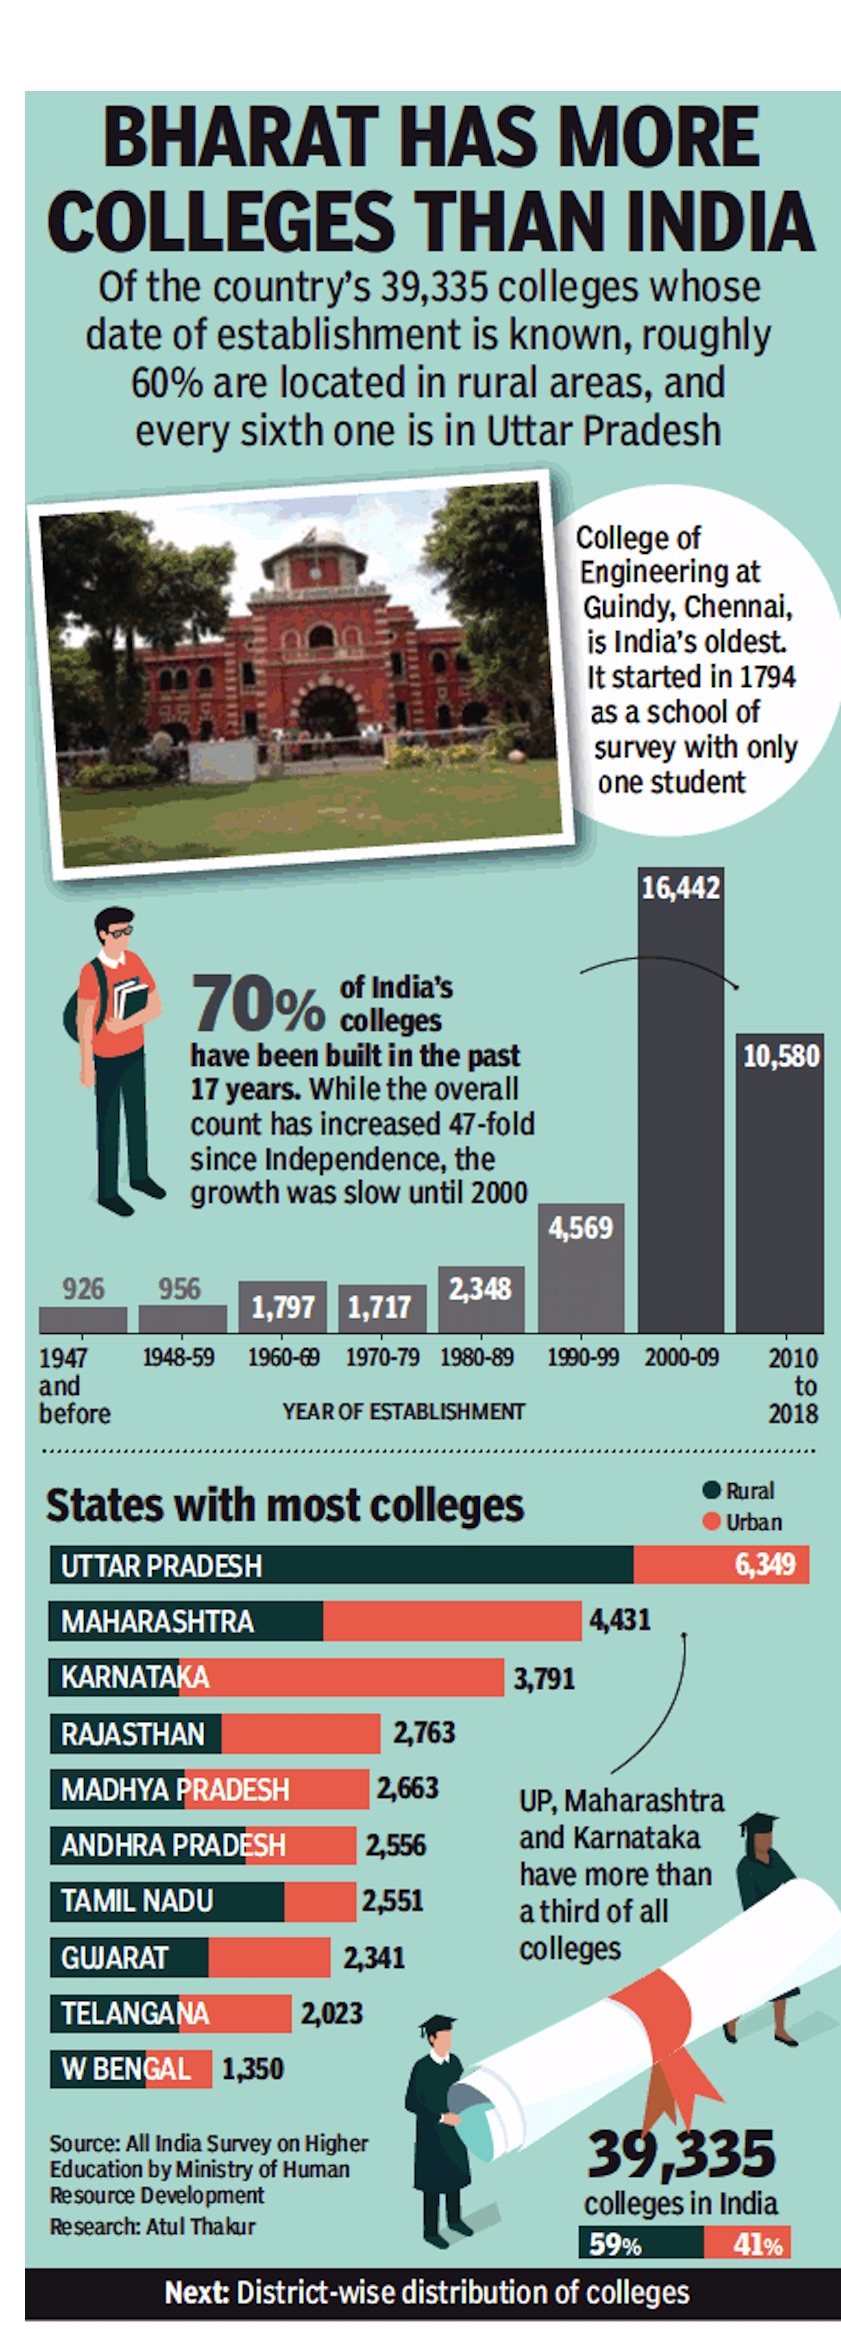
Indian states with the highest number of colleges (presumably in 2018) and their distribution between rural and urban areas
From: April 9, 2018: The Times of India
See graphic:
The growth in the number of colleges in India from 1794 and 1947 to 2010;
Indian states with the highest number of colleges (presumably in 2018) and their distribution between rural and urban areas
Districts in which colleges are concentrated: 2017
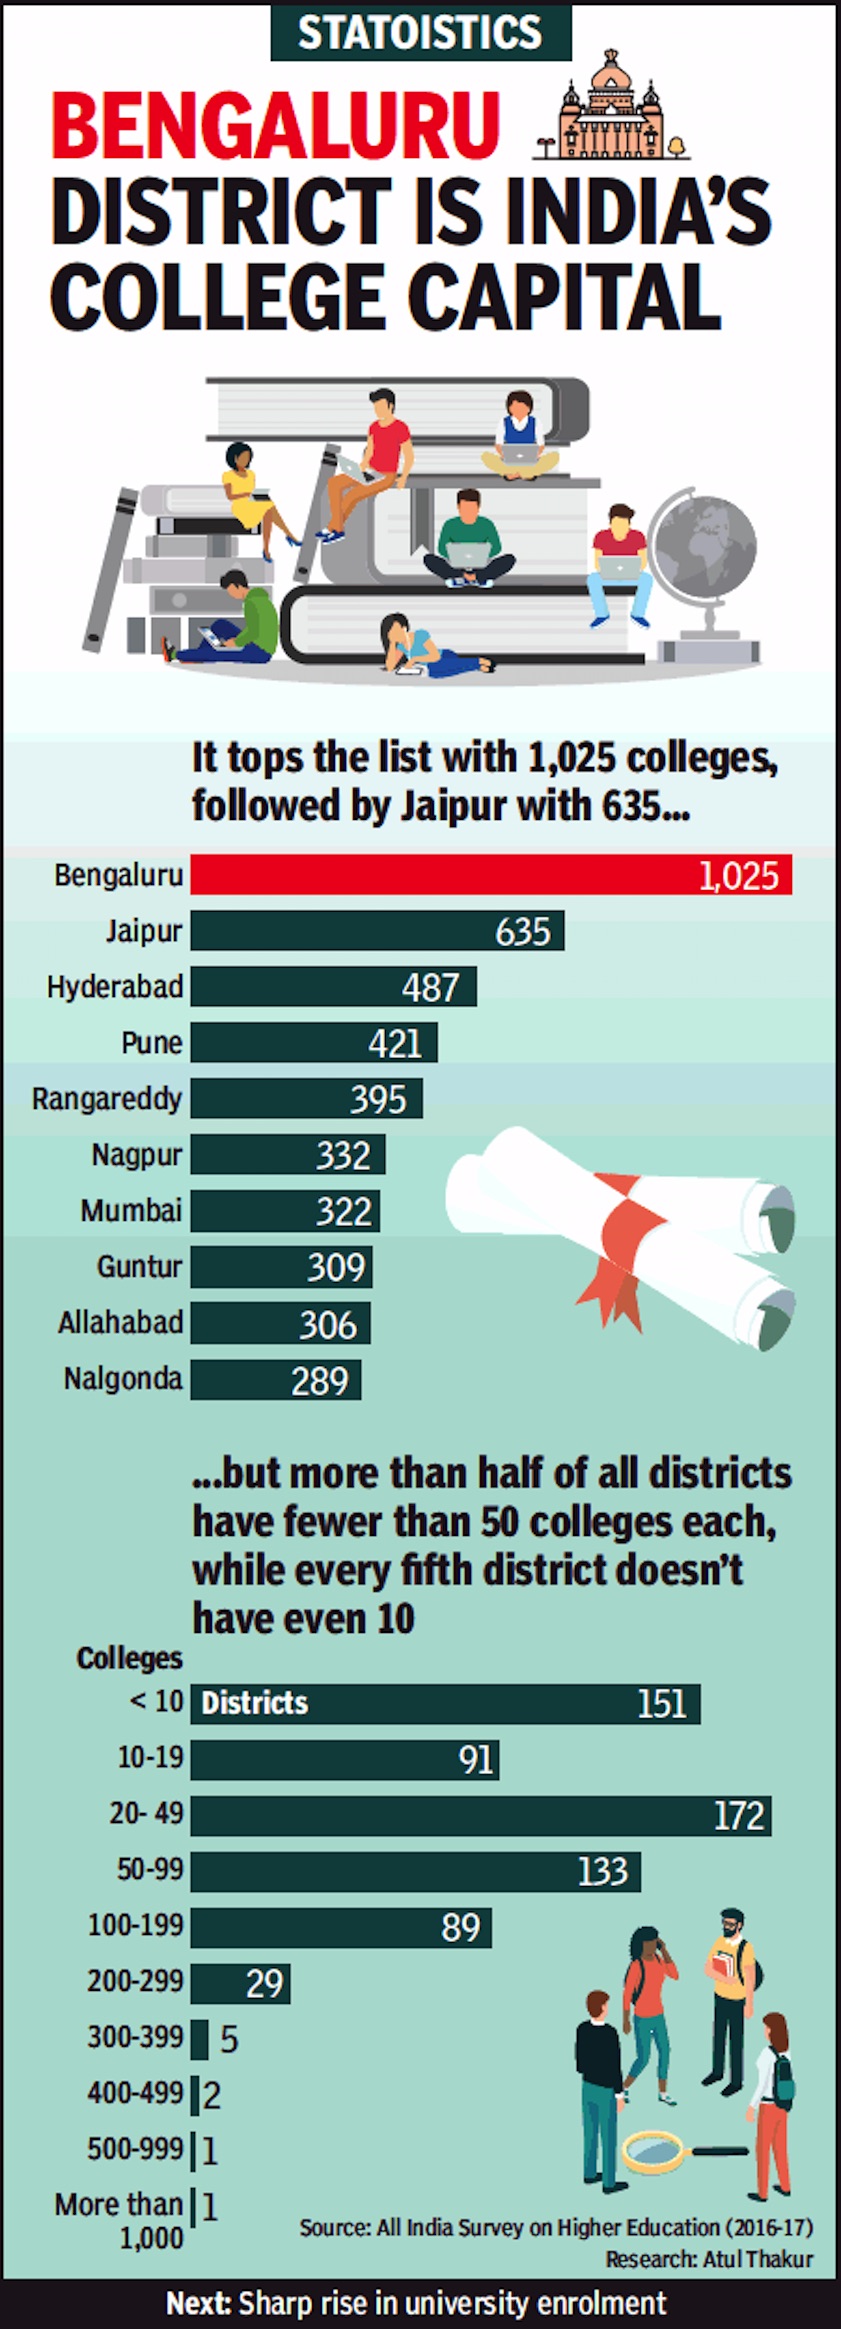
The number of colleges that are likely to be there in a typical Indian district
From: April 10, 2018: The Times of India
See graphic:
The top ten districts in which colleges were concentrated in 2017
The number of colleges that are likely to be there in a typical Indian district
Correspondence courses
Enrolments vis-à-vis regular courses
2018-19
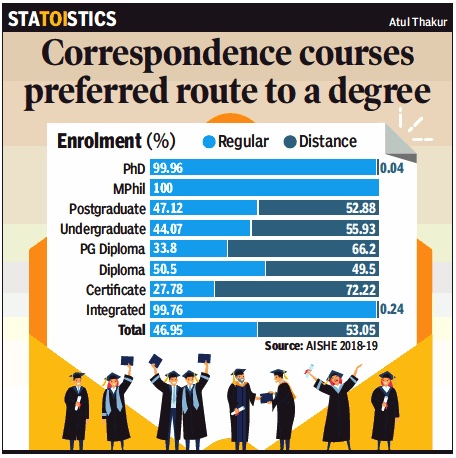
From: March 30, 2020: The Times of India
See graphic:
Enrolment in correspondence courses vis-à-vis regular courses, 2018-19
Costs, affordability
As in 2019
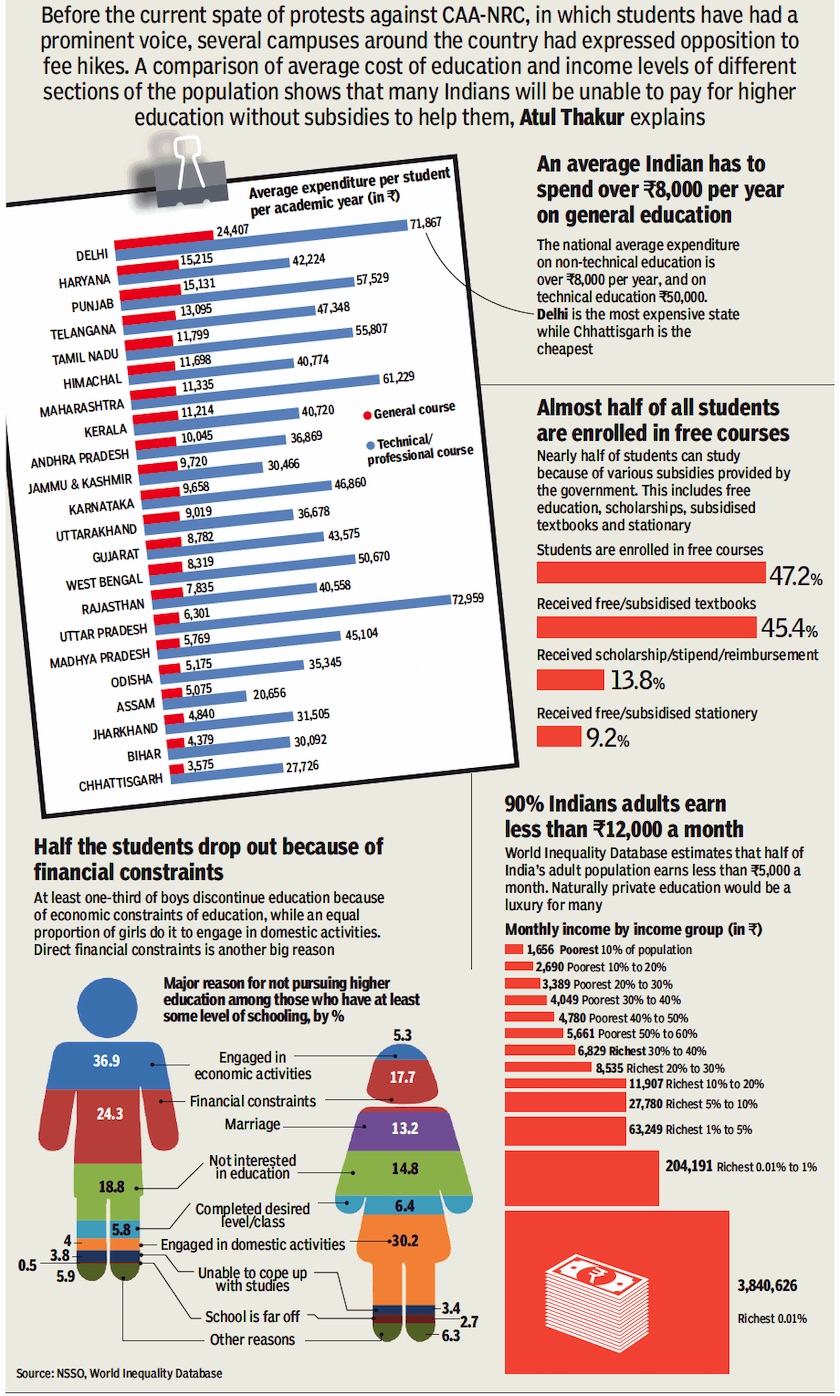
From: Dec 29, 2019 The Times of India
See graphic:
The Cost and affordability of technical and general Higher Education in India, presumably As in 2019
Court judgements
Second attempts and gold medals
HC: Varsity can’t deny gold for 2nd exam attempt, January 29, 2018: The Times of India
It’s a big relief for many students who fail to write an exam owing to illness and fear that their second attempt could deprive them of a gold medal.
The Delhi high court has held that sitting for an exam by a student in the successive academic year owing to illness or other such circumstances in the first year will still be considered the “first attempt”, and that this is no ground for denying any recognition to the student. Justice Indermeet Kaur observed that the university could not deprive the student of the award for achieving the highest score in the batch on the ground that he took the examination in respect of two papers in the following year.
The petitioner, through his advocate Amit George, informed the high court that he was enrolled in the five-year course of BA LLB in 2010 at Amity Law School. For his 6th semester, out of five papers he could not appear in two — Code of Civil Procedure and the paper of Code of Criminal Procedure. These two examinations were scheduled for May, 2013.
The petitioner could not appear in the examinations as he was suffering from chicken pox.
The petitioner wrote his examination in the two papers in 2014 and passed with flying colours. He graduated from the university with the highest score/ cumulative performance index (CPI) for his course i.e. 80.56. In February, 2016, the petitioner was shocked to learn that he was not being considered for the award of Gold Medal in spite of him having achieved the highest score in his course.
Cut-off marks
Reducing entrance marks doesn’t hit standards: SC
Dhananjay Mahapatra, February 9, 2021: The Times of India
The Supreme Court ruled that reducing the cut-off marks for admissions to courses does not lower the standards of education and overruled the Union government by directing lowering of qualifying marks by 10% percentile points to help private colleges fill nearly 7,000 BDS seats for the academic year 2020-21 by February 18.
A bench of Justices LN Rao and Krishna Murari accepted advocate Maninder Singh’s argument that the government could not have refused to accept Dental Council of India’s recommendations for lowering the qualifying marks by 20% percentile points on the ground that lowering the cut-off mark could have adverse impact on education standards. Singh had said the Centre had earlier accepted similar recommendations for lowering cut-off for super specialty courses in medical sciences.
Writing the judgment, Justice Rao said, “If reducing minimum marks amounts to lowering the standards, Centre would not do so for super specialty courses. We are in agreement with Singh, counsel for the petitioners, that lowering minimum marks and reducing the percentile for admission to first-year BDS course would not amount to lowering the standards of education.” It ordered admissions to BDS courses strictly on merit and said the process of admission be completed by February 18.
It also found force in additional solicitor general Aishwarya Bhati’s argument that fees charged by private dental colleges were a deterrent in filling up seats. “The managements of private colleges shall consider reducing the fee charged by them to encourage students to join colleges,” it said. The order implies general category candidates with 40 percentile points, SC/ST/OBCs with 30 percentile points and physically challenged candidates with 35 percentile points would be eligible for admission to BDS courses in government and private colleges. Singh argued that 7,000 seats in BDS courses were vacant and available infrastructure would be wasted. Bhati submitted that 7.71 lakh candidates were found to be eligible for filling up 82,000 MBBS and 28,000 BDS seats, thus for each vacant seat seven candidates were available.
Deemed universities
Cannot use the word 'university' in their names
HIGHLIGHTS
UGC secretary has directed the heads of these institutes that they should “restrain from using the word ‘university'.
Instead, the institution may mention the word ‘deemed to be university’ within parenthesis.
Failure to do so will invite necessary action against the deemed to be university in accordance with the UGC Regulations, 2016.
As many as 123 institutions of higher education which are deemed to be universities have been directed by the University Grants Commission (UGC) to refrain from using the word 'university' in their names.
In a circular issued on November 10, a copy of which is with TOI, UGC secretary PK Thakur citing a Supreme Court order dated November 3, has directed the heads of these institutes that they should "restrain from using the word 'university' within one month from today." "Instead, the institution may mention the word 'deemed to be university' within parenthesis.
Failure to do so will invite necessary action against the deemed to be university in accordance with the UGC (lnstitutions Deemed to be Universities) Regulations, 2016," the circular says. Among the list of institutions which have been sent the directive are the Delhi-based Indian Agricultural Research Institute (Pusa), Indian Institute of Foreign Trade, Institute of Liver and Biliary Sciences and Jamia Hamdard.
Other institutions on the list include the National Dairy Research Institute, Karnal, Forest Research Institute, Dehradun, BIT Mesra (Ranchi), Christ University, Bengaluru, Narsee Monjee Institute of Management Studies, Mumbai, Symbiosis International University, Pune, BITS Pilani, Indian Veterinary Research Institute, Izzatnagar (UP), Graphic Era University, Dehradun and Gurukul Kangri Vishwavidyalaya, Haridwar among others.
Through the circular, the institutions have also been told that "in those cases where the government's notification is with the word 'university', the deemed to be university may submit a proposal with an alternative name (without using the word 'university') to the UGC/ministry of HRD so that necessary amendment can be made by MHRD." The institutions have been asked to ensure compliance "within 15 days from receipt of the letter."
Reacting to the circular, the representatives of most of the institutions approached by TOI claimed that they were already using "deemed to be university" in their names.
R K Singh, director of Indian Veterinary Research Institute (IVRI) situated in Izatnagar, Bareilly, said, "UGC's order will have no impact on IVRI as we do not use the word 'university' in our name since the beginning because our research institute is more important than the varsity.
For academic-related work, we mention IVRI and use the phrase 'deemed to be university' in brackets.
Education loans
2013-15: Tamil Nadu tops
The Times of India, Sep 06 2016
TN accounts for 45% of growth in education loans
Mayur Shetty
Tamil Nadu has generated 45% of all incre mental education loans between FY13 and FY15. Of the total loan growth of Rs 6,597 crore in 2013-15, loans in Tamil Nadu have grown by Rs 2,969 crore.
The data gains significance in light of the state's chief minister J Jayalalithaa's AIADMK election manifesto promise to waive off student loans and farm loans. The manifesto coincided with the rise in defaults which had compel led State Bank of Travanco re to sell some of its defaul ting education loans to asset reconstruction companies.
A large part of the educa tion loans in the state are ad vanced by the troubled Indi an Overseas Bank and Indi an Bank. The numbers were pro vided in reply to a query in the Lok Sabha by minister of state for finance, Santosh Gangwar, on July 22. In his reply, the minister said that banks were not allowed to seek collateral for loans up to Rs 4 lakh and the government has launched a Credit Guarantee Fund Scheme wherein no collateral or third party guarantee were required for loans up to Rs 7.5 lakh.
Enrolment and dropout
1991-2010: Rates of dropout and enrolment rise
More opt for higher education, but even more drop out
Highest Rates Of Increase In Decades
Subodh Varma TIMES INSIGHT GROUP
The Times of India 2013/08/31
1991-2010: Rate of attendance rises
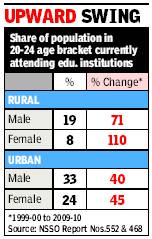
Higher education continues to be a mixed bag in India. A countrywide education survey has found that the rate of attendance in the 20-24 age group (corresponding to graduation and above) has recorded the highest rates of growth in several decades. However, the good news is ofset by the fact that the dropout rate has also kept pace.
The survey, which was carried out by the National Sample Survey Organisation (NSSO) in 2009-10, was released this month. Compared to the 1991-2000 period, the past decade (2001-10) saw attendance rates for the higher age group increase by 71% for boys and 110% for girls in villages. In urban areas, the growth was 40% for boys and 45% for girls.
Though the rise in percentage terms is a marked improvement over previous decades, the data shows that the picture remains dismal at the ground level. In 2009-10, the attendance rates were just 19% for boys and 8% for girls in rural areas; in urban areas, the corresponding figures were 33% and 24%, respectively. This state of higher education compares badly with those in the 5-14 age group, where 87% of boys and 84% of girls were attending school in rural areas, and 91% of all boys and girls in urban areas.
Various measures like mid-day meals, new curricula and better facilities have drawn children to schools, said eminent scientist Yashpal, former chairperson of the UGC. However, in higher education, complex socio-economic conditions skew the growth rate in favour of female students.
While economic pressures force young men to opt out of education at the earliest possible level in order to start earning, young women are increasingly pursuing higher education as it boosts marriage prospects and future employment. An earlier NSSO study had shown that women, despite pursuing higher education, were still not part of the workforce.
“At the higher education level, we need to do away with rigidity, allow more freedom and innovation, and link the courses to life. Resources need to be pumped in on priority basis,” asserted professor Yashpal.
Govt yet to act on panel’s report on higher education
Prof Yashpal had headed a high-level committee on ‘renovation and rejuvenation’ of higher education which submitted a detailed report in 2009. Its battery of suggestions included increased funding for higher education and stricter regulation of private entities. The government is yet to act on the report.
While current attendance rates indicate a positive trend for the future, existing educational levels of people 15 years old and above continue to be dismal. The traditional picture of educational levels-—like a pyramid with a very wide base (of illiterates) tapering to a sharp point (of graduates)—is changing at the bottom but not much at the top. The proportion of those who are illiterate or have studied just up to primary levels is going down but beyond that the pyramid continues to be sharply pointed.
In urban areas, about 15% of males and 11% of females are graduates or above. This is much higher than the rural areas where only 3.7% of males and a mere 1.6% of females have gone up to graduation or beyond. This is despite an explosion of private higher education institutions including universities in recent years.
What is even more alarming is that in 10 years between 1999-2000 and 2009-10, the graduate and above segment of the urban population declined by 5% among males although it increased by 10% among females. In the rural areas, the pent-up demand for education is still driving educational levels higher. The proportion of graduates and above went up by 78% among females but only 12% in males.
2012>2017: from 3 to 3.6 crore university students
See graphic :
i) Students enrolled in Indian universities rose from 3 to 3.6 crore between 2012 and 2016
ii) 4 out of 5 of these were undergraduates;
iii) In 2017, women, OBC and SC students were somewhat under-represented, the STs even more so.
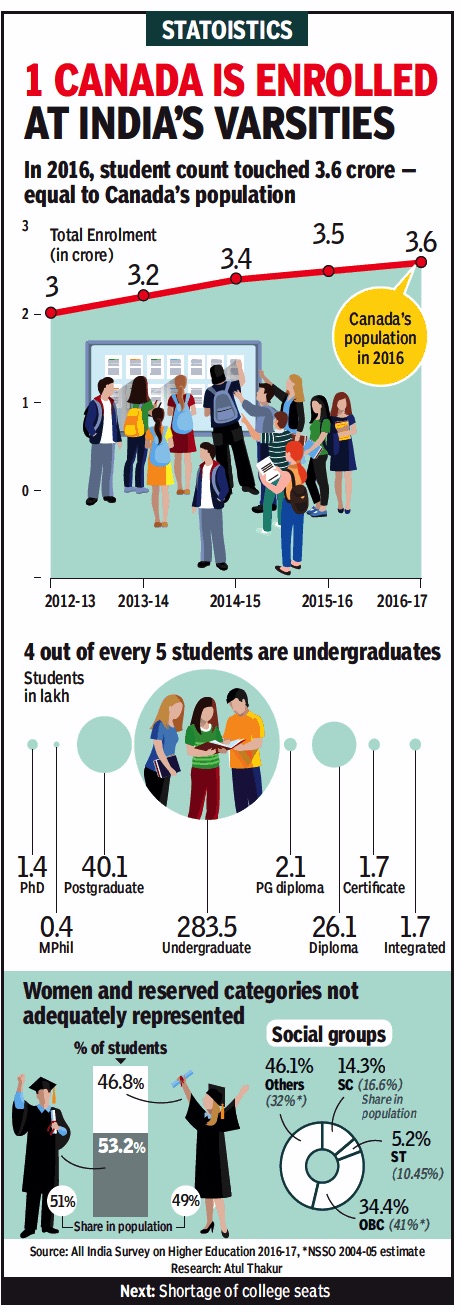
ii) 4 out of 5 of these were undergraduates;
iii) In 2017, women, OBC and SC students were somewhat under-represented, the STs even more so.
From: April 11, 2018: The Times of India
Number of colleges per state: population (ratio): 2017
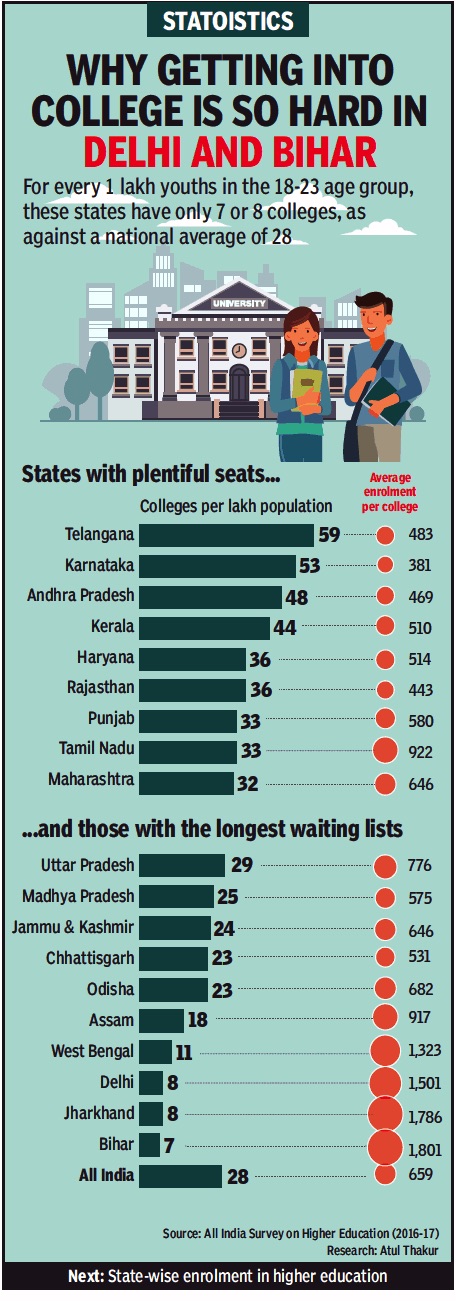
From: April 12, 2018: The Times of India
See graphic:
The ratio of the number of colleges in a state to it population, 2016-17
Enrolment vis-à-vis other countries/ 2017-18
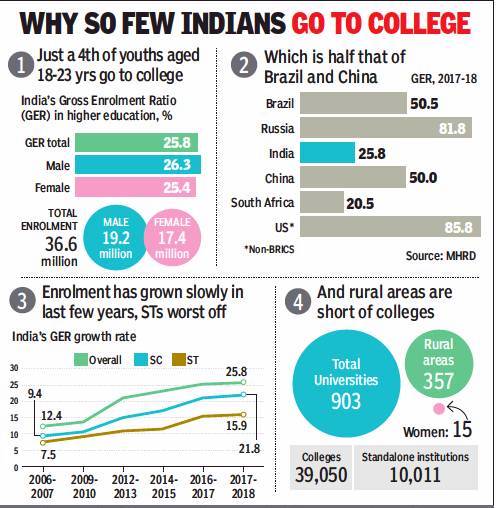
i) Students enrolled in Indian universities,
Enrolment of ii) SC/ ST and iii) rural students;
Enrolment in colleges: India vis-à-vis other countries, 2017-18
From: Manash Gohain, July 10, 2019: The Times of India
See graphic:
2006-18:
i) Students enrolled in Indian universities,
Enrolment of ii) SC/ ST and iii) rural students;
Enrolment in colleges: India vis-à-vis other countries, 2017-18
Gross enrolment ratio, 2015-20
Manash Gohain, June 11, 2021: The Times of India
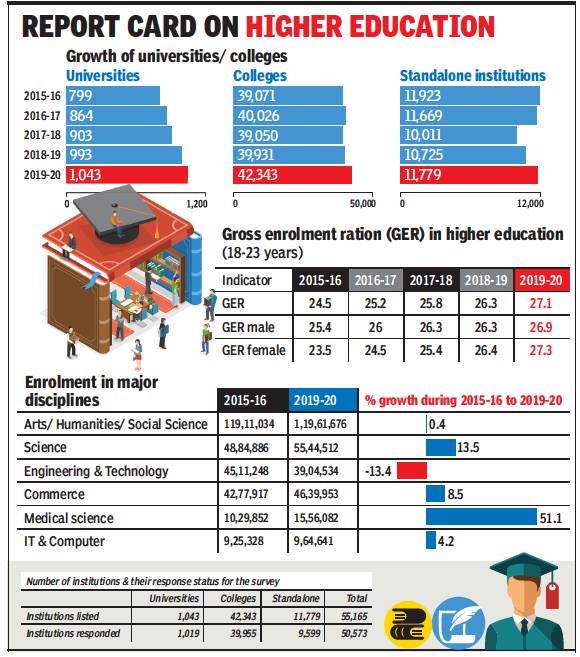
From: Manash Gohain, June 11, 2021: The Times of India
New Delhi: As the gross enrolment ratio (GER) in higher education in India crossed the 27% mark, GER for females at 27.3% was for the second consecutive year a higher percentage compared to males at 26.9%.
In the last five years, female enrolment recorded an 18.2% increase as overall enrolment in higher education grew by11.4% in the same period. The number of universities has increased by 30.5% during the period of 2015-16 to 2019-20 and colleges by about 8.4% in the same period. UP, with the highest student enrolment in India, has 49.1% male and 50.9% female students. Karnataka is the other state with higher female enrolment compared to male students.
Interestingly, according to the All India Survey on Higher Education (AISHE) 2019-20 report released on Thursday, there is a significant shift in the choice of discipline of study, as engineering and technology registered a negative 13.4% growth in the last five years, while medical science enrolment is up by 51.1% in the same period.
Of the 42,343 colleges, almost 60.6% are located in rural areas and nearly 10.8% colleges are exclusively for girls. And majority of the colleges (78.6%) in the country, are privately managed, led by Andhra Pradesh (81%), Telangana (80%), Uttar Pradesh (78.5%) and Tamil Nadu (77.6%). Also 65.5% of the colleges enrol less than 500 students, while 4% of the colleges have enrolment of more than 3,000 students.
The enrolment in higher education stands at 3.9 crore in 2019-20 as compared to 3.7 crore in 2018-19, registering a growth of nearly 11.5 lakh (3%). Total enrolment was 3.4 crore in 2014-15. GER of students belonging to the eligible age group enrolled in higher education in 2019-20 is 27.1% against 26.3% in 2018-19 and 24.3% in 2014-2015. Gender Parity Index (GPI) has increased during the last five years, from 0.9 in 2015- 16 to 1.01, which is a socioeconomic index usually designed to measure the relative access to education of males and females. Education minister Ramesh Pokhriyal said the government’s focus on education of girls, women empowerment and empowerment of socially backward classes are well reflected by the increased participation of women, SCs and STs in higher education. “We have noted a growth of educational institutes in India, ” he said.
Expenditure on higher education
The state-wise expenditure (2011 data)
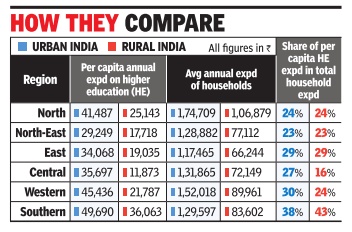
Study: It's 43% Of Family Income In Villages, 38% In Cities. National Avg Is 15% & 18%
Education may be priceless, but the promise of a degree has seen parents across India foot large bills.Those from the rural and urban pockets of southern states spend the most, largely sign up at a private university and finance their children's dream of a technical education.
On average, higher education accounts for 15.3% of the total household expenditure in rural and 18.4% in urban areas. In the south, the corresponding figures are 43% and 38%.
The data is part of a recent study titled `Household Expenditure on Higher Education in India: What do we know and what does recent data have to say'. In absolute terms, families from urban parts of south India spend an average of Rs 49,690 a year on higher education, closely followed by the western states, where it is Rs 45,436. In rural areas, the southern states have an average per-student expenditure of Rs 36,063, which makes up a whopping 43% of their annual household expenditure. This is followed by the northern states, whe re the annual average expense is Rs 25,143.
“For the average citizen, higher education does not come cheap. Most families spend a third of their consumption expenditure, expecting a better return on their investment,“ said S Chandrasekhar, professor, Indira Gandhi Institute of Develop ment Research, Mumbai, and one of the authors of the study. The other co-authors of the study are P Geetha Rani of Central University of Tamil Nadu, Thiruvarur, and Soham Sahoo of University of Goettingen, Germany .
The spend is the lowest -23% of the household expenditure, or Rs 29,249 -in urban parts of North-east India. Among rural areas, the expenditure is lowest, 16% or Rs 11,873, in central India.“When there is uncertainty in the employment prospect, the opportunity cost of pursuing higher education is larger for poorer households, which potentially explains the disparity in demand for higher education across wealth levels,“ stated the paper.
The National Sample Survey Organisation (NSSO) survey of consumption expenditure, typically conducted on ce in five years, provides estimates of expenditure for the household as a whole and not for each member who is pursuing higher education.
First, the average income in rural India is not sufficient to finance quality higher education, the authors noted. In rural India, as per data from the Socio Economic and Caste Census 2011, in nearly 73% of households, the maximum income earned by any member is less than Rs 5,000 per month. Second, an average rural household spends 27% of its total expenditure if any one wants to pursue higher education. “Since poorer households have lower income, this share is likely to be higher for poorer households. This provides support for the policy stance that financial assistance schemes need to be targeted by income slabs,“ said the research.
Faculty
2016-17: Only 4.9% of higher education teachers are Muslims
Vikas Pathak, January 13, 2018: The Hindu
At 4.9%, Muslim representation among teachers in higher educational institutions in India is much lower than the community’s proportion in India’s population (14.2%).
The All-India Survey on Higher Education (AISHE) for the year 2016-17 reveals this. The representation of the Scheduled Castes and Scheduled Tribes is also lower than the populations of the two categories.
While the survey – done by the Ministry of Human Resource Development – shows the representation of SCs at 8.3% of the total number of teachers in higher educational institutions, ST representation is 2.2%.
See also:
2017: vacancies in IITs, central varsities
Most centrallyfunded institutions, including the Indian Institutes of Technology (IITs), National Institutes of Technology (NITs) and universities, are conducting classes with large number of faculty positions vacant, prompting the government to launch a major recruitment drive.
Worst hit are new central universities with 53.28% vacancies followed by NITs with 47% teacher vacancies. Old as well as new IITs, too, have over 35% vacancies, human resource development minister Prakash Javadekar said while announcing a major recruitment drive across campuses in the next fortnight.
In an interaction with a small group of journalists, Javadekar said the ministry was thinking of re-employ ment and wooing industry experts to fill up the teaching vacancies. Concerned over the number of vacancies in faculty positions, Javadekar said institutions will have to at least fill up 75% untenanted posts by the year-end.
Information provided to Parliament by the ministry on August 3, 2017 does not indicate that the situation improved significantly .
While vacancy status for old IITs has been recorded at 39%, new ones are only marginally better at 36%.NITs are worst affected with 47% vacancies. In fact 14 of 20 old NITs have a 40% and more vacancies, while four of eight old IITs have the same vacancy levels.Even Indian Institutes of Management (IIMs) have 26.01% vacancies. Among the IIMs, Indore has 51% vacant positions, followed by Kolkata with 41%.
Among central universities, central university of Haryana, according to HRD records, is reeling under 75.11% vacancies as on April 1, 2017, while in the same period Delhi University recorded a total of 54.75% vacancies against permanent positions. University of Allahabad too has over 64% vacancies to be filled.
Speaking to TOI, Javadekar said the government is monitoring the recruitment process every month and the universities have already started the recruitment process. “In JNU, of the 300 vacancies, we have recruited 200 and the rest will be completed soon.By next month, large number of interviews are to be conducted across DU colleges,“ said Javadekar.
2019-20: Faculty in position
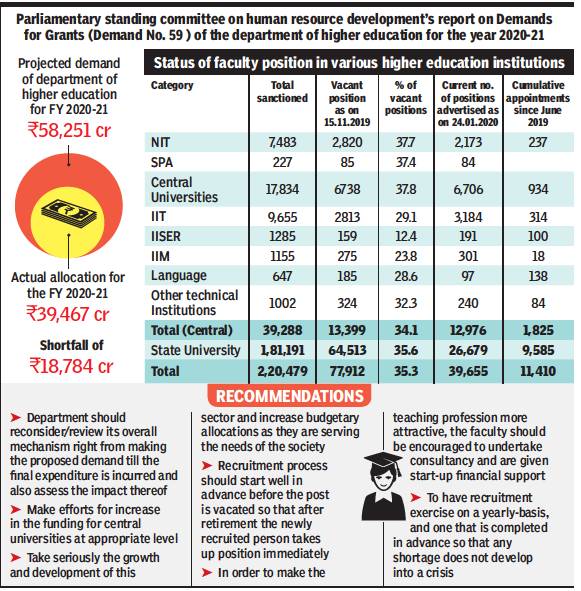
From: Manash Gohain, Grants too less for growth of higher education: Panel, March 12, 2020: The Times of India
See graphic:
Status of faculty position in various higher education institutions, 2019-20
Fees
Can’t increase college fees retrospectively
Yogita Rao, November 15, 2020: The Times of India
Educational institutions cannot retrospectively seek review of fees fixed by Fee Regulating Authority (FRA), ruled the quasi-judicial body after a complaint by students from a private management institute. FRA, in a “well-reasoned and an elaborate” order, pointed out that the institute cannot seek review of fees fixed in 2018, when it opted for no revision in the subsequent year, acquiescing to the fee structure fixed by the authority for two academic years.
N L Dalmia Institute of Management Studies and Research from Mira Road charged MMS students of 2019-20 batch nearly Rs 2.3 lakh, over and above fees (tuition and development) approved by FRA of nearly Rs 1.9 lakh. Two students from 2019-20 batch complained to FRA that the college collected extra and submitted receipts. FRA sought an explanation from the institute, which sought review of the fee structure approved by the authority on January 24, 2018. Citing a provision of the regulatory act, FRA stated that “if the fee approved by the authority is not acceptable to the institution, it may file a review application with detailed reasoning within 15 days from the date of communication”. The institute did not file any review application in 2018. It opted for no upward revision on FRA’s portal in 2019, retaining fees at nearly Rs 1.9 lakh even for 2019-20 batch of 240 students. Therefore, the review application filed now cannot be applicable for both academic years, said the order.
The 2018-19 batch graduated and 2019-20 batch will complete the course in six months. “It is strange a review application for hike in fees is retrospectively being sought, which in no circumstance is permissible,” stated the order of the regulatory body, headed by retired high court judge, Justice M N Gilani.
The institute authorities were not reachable for comments but an official said they provide value-added courses to students to make them industry-ready and receipts were provided. The institute CEO, before the FRA, mentioned “excellent infrastructure, best placement record and many other welfare measures undertaken by the institute”.
An FRA member said the institute will be given a chance to justify excessive fees but if there is no valid reason, as in most such cases, institutes have to refund excessive fees.
Gender, the distribution of students by
2016-17
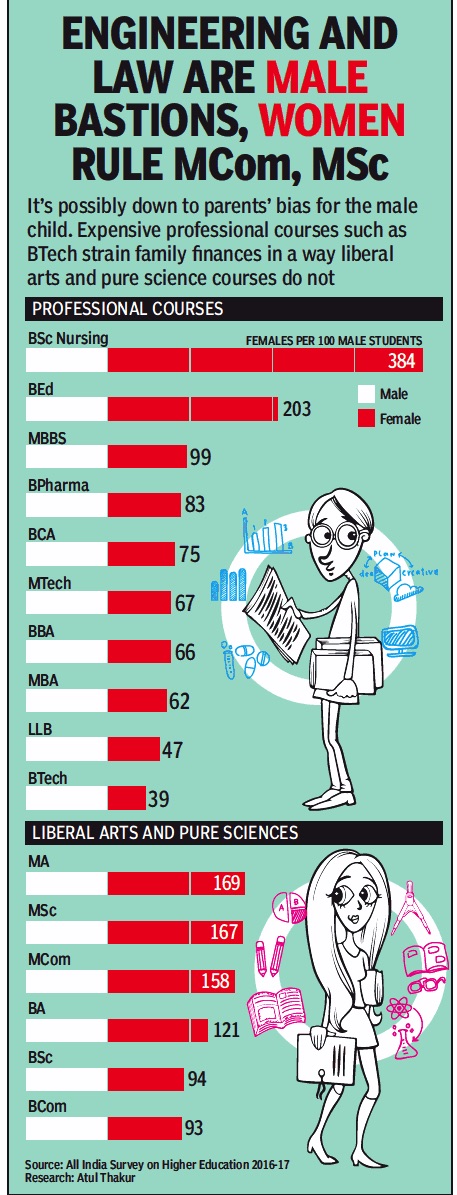
From: April 16, 2018: The Times of India
See graphic:
The number of female students for every 100 male students in the top ten professional courses, and the top six liberal arts and pure sciences courses, 2016-17
2017> 19: More girls than boys in UP, Karnataka
Manash.Gohain , Sep 22, 2019: The Times of India
Girls have been closing the gap with boys in enrolment for higher education. Now, for the first time in two states, they have gone ahead. According to the latest All-India Survey on Higher Education (AISHE) released by the ministry of human resource department on Saturday, in the states of Uttar Pradesh and Karnataka, there are now more females in the age group of 18-23 enrolling for higher education than male students.
The gender shift is most pronounced in Uttar Pradesh. A year ago, there were 1.61 lakh more male students than female in colleges and universities of UP.
Today, there are 90,000 more girls than boys.
In campuses in Karnataka, females are marginally higher (1,600). Overall, female enrolment has also improved from 47.6% in 2017-18 to 48.6% in the latest survey.
At PG level, social science & mgmt favourite
In terms of subjects and streams, at undergraduate level, more than one third of the students (35.9%) are enrolled in arts/ humanities/ social science, while 16.5% students are pursuing science, followed by commerce with 14.1%. Engineering is the fourth choice.
At the postgraduate level, the preferred stream changes to social science and management. Higher up at MPhil and PhD, science and engineering technology has the maximum enrollment.
The gross enrolment ratio (GER) in higher education too has increased marginally – from 25.8 in 2017-18 to 26.3 in 2018-19 – while in absolute terms, enrolment increased from 3.66 crore to 3.74 crore students in the same period. GER for SCs has also shown a growth from 21.8 to 23 and STs from 15.9 to 17.2. In terms of increase in the number of universities, they have grown from 903 (2017-18) to 993 (2018-19) and total higher education institutes (HEIs) from 49,964 to 51,649 in the same period. The number of faculty has also increased from 13.88 lakh to 14.16 lakh.
Girl students exceeded boys by 90,000 in UP and by 2,000 in Karnataka The gross enrolment ratio (GER) in higher education has increased marginally — from 25.8 in 2017-18 to 26.3 in 2018-19
Institutions of Eminence
2017: 100 Institutions apply against 20 slots
Institutions of Eminence plan sees ‘overwhelming’ response, December 13, 2017: The Times of India
The ministry of human resources development has received 100 applications for the ambitious 20 world class institutions project. The 90-day deadline for submission of application ended on Tuesday. The last day saw 27 applications. Maximum number of applications were received from public institutions.
Terming the response as “overwhelming”, HRD minister Prakash Javadekar said,“All lovers of education will welcome this development. This is how world class universities were built in various countries. The same thing will happen in India. The selection of ‘Institutions of Eminence’ will not only improve the quality of education, but also propel competition in the entire education sector.” According to official data, 100 applications have been received. Under public sector, 10 central universities, 25 state universities, six deemed to be universities, 20 institutions of national importance and six stand-alone institutions have applied.
Under private sector, nine private universities and 16 deemed to be universities have applied in brown field category and eight institutions have applied in green field category.
Among those who have applied from the public sector are seven Indian Institutes of Technology (Madras, Delhi, Bombay, Kharagpur, Kanpur, Guwahati, Roorkee), Delhi University and Jawaharlal Nehru University, Jadhavpur University, Goa University, Panjab University and Mangalore University.
From the private sector OP Jindal Global University, Ashoka University, Manipal University and Amity University, among others, have applied for the tag. The UGC had in September started inviting applications from all institutions that are keen to enter the top 100 of global rankings with the government's assistance.
National Eligibility-cum-Entrance Test (NEET)
Set one question paper for all languages: SC
The CBSE's practice of preparing different sets of question papers for students taking the National Eligibility-cum-Entrance Test (NEET) in regional languages is set to go with the Supreme Court terming it “illogical“ and ordering that there must be one question paper for all students irrespective of language.
A bench of Justices Dipak Misra, Amitava Roy and A M Khanwilkar said this was a very serious issue as there would be no uniformity in the entrance examin ation as students would be asked different questions.
“It is illogical practice.How will you evaluate the competence of students when their questions are different.There is no reason for setting different question papers for students. There must be same question paper for all students who take the exam in Hindi, English or other languages,“ the bench said.
The CBSE had found itself in a fix over the regional papers of NEET 2017 conducted on May 7. There were allegations that some of the regional language papers were more difficult than the English and Hindi papers.
Same question papers for all examinees
AmitAnand Choudhary, January 26, 2018: The Times of India
CBSE: Same sets of question papers for all NEET examinees
The current practice of preparing different sets of question papers for students taking the National Eligibility cum Entrance Test (NEET) in regional languages is set to go with the CBSE telling the Supreme Court on Thursday that from this year only one question paper will be set, and that it will be translated into different languages.
The decision was taken after the board found itself in a fix following allegations that the question papers in regional languages for NEET 2017 were more difficult than the English and Hindi papers and a bunch of petitions was filed in the apex court by students seeking quashing of the exam. The students also alleged that some questions in regional languages were wrong and hampered their chances in the entrance test.
The CBSE, which conducts the medical entrance test, was forced to take the decision after the SC termed the practice illogical as there would be no uniformity in the entrance examination and students would be asked different questions.
Different sets of questions illogical: Court
Appearing before a bench of Justices Arun Mishra and S Abdul Nazeer, CBSE’s counsel, Tara Chandra Sharma, told the court that only one question paper would be set for all students and those who opted for vernacular languages would be provided translated question papers in their preferred medium.
Students are allowed to take the exam in 10 languages. The SC had earlier said there would no uniformity in the entrance examination if students were provided different question papers. It had asked the CBSE to get the same question paper translated into different languages.
“It is an illogical practice. How will you evaluate the competence of students when their questions are different? There is no reason for setting different question papers. There must be the same question paper for all students who take the exam in Hindi, English or other language,” the court had said.
The board had contended that if the level of difficulty of all papers was the same, then it served the purpose of uniformity in the examination process and there was nothing wrong in having multiple papers. But the court was not convinced and asked it to do away with the practice.
Private Universities
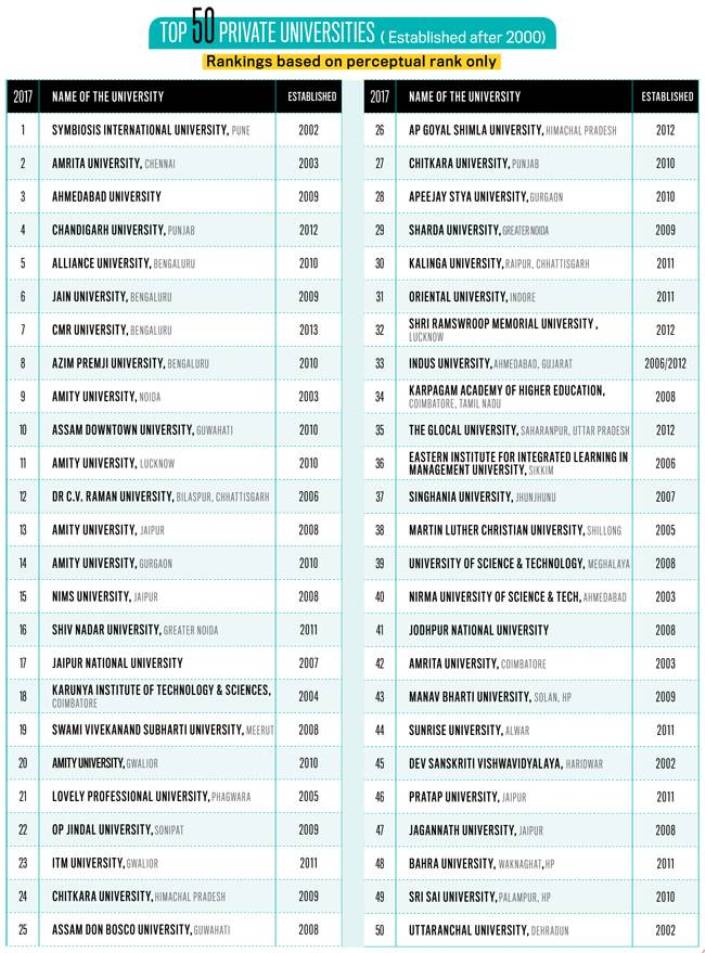
Siddhartha Rai , Thinking minds “India Today” 26/6/2017
Quotas in teaching slots
[ From the archives of the Times of India]
Akshaya Mukul TNN
SC/ST teaching slots in central univs lie vacant
The HRD ministry has overwhelmingly supported the proposed Bill that seeks to give reservation to SC/ST employees in promotion. But the scenario in HRD’s own backyard is anything but enthusiastic.
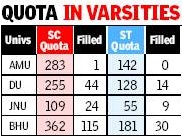
Just over 32% of sanctioned teaching posts for SCs and 41.8% for STs in 40 central universities are occupied. This includes premier institutions like the Delhi University, Jawaharlal Nehru University, Aligarh Muslim University and University of Hyderabad. Vacancies exist in all three categories — assistant professor, associate professor and professor. Ironically, in central varsities, central government run deemed universities and colleges, not only there are reservation for SCs/STs for direct recruitment, but also in promotion. JNU was the last central varsity to agree to give reservation in promotion. Only IITs and IIMs have been exempted from grant of reservation in promotion. On the face of it, the ministry claims it has done everything possible to improve the situation. Its effort includes writing regular letters to central varsities and other institutions to launch special drives to fill the backlog vacancies for SCs/STs.
The regulator, UGC, shows its 2006 guidelines for strict implementation of reservation policy in central government institutions. UGC also told universities not to indulge in the practice of creating department-wise cadres which tends to create single posts with artificially reduced number of posts to avoid reservation. “Initially, many universities protested against quota in promotion but eventually fell in line,” a ministry official says. Rajya Sabha MP Bhalchandra Mungekar, who was actively involved in formulation of UGC’s 2006 regulation, counters the ministry’s claim. “The basic problem is that central universities are not following UGC’s guideline. Reservation in direct recruitment is being flouted,” he says. Another senior universities says, “If vacancies at the entry level are not filled, it would adversely affect the overall picture. Reservation in promotion would not help and vacancies would still remain.” While JNU has worked out a process of quota in promotion at the level of associate professor, DU is yet to form anything concrete. A section within JNU say diluting quality for promotion would have long-term impact. System of affiliated colleges in DU makes it difficult to put in place a system of reservation in promotion, says a senior DU official.
The spread across the states (2014, presumably)
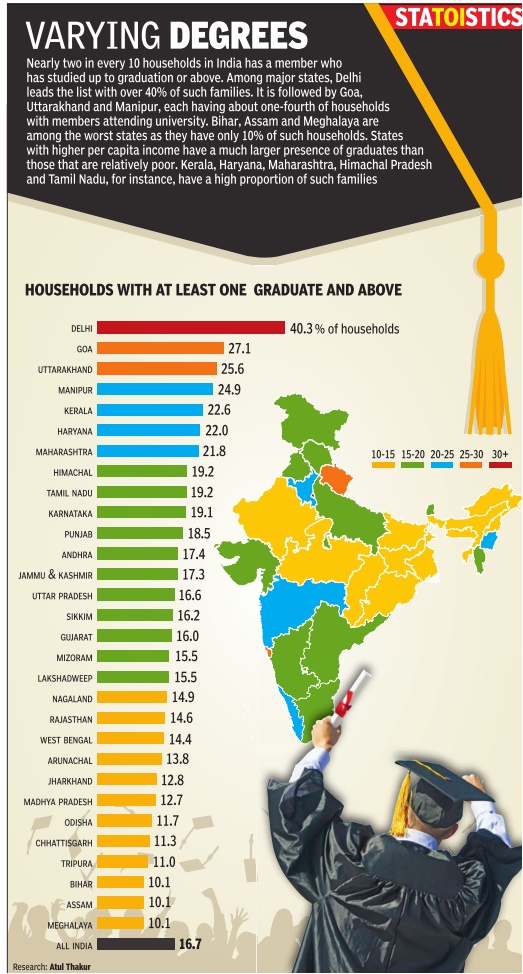
See graphic, ' Indian households with at least one graduate and above, statewise '
Status of higher education/ 2009-15
The Times of India, Aug 21 2015
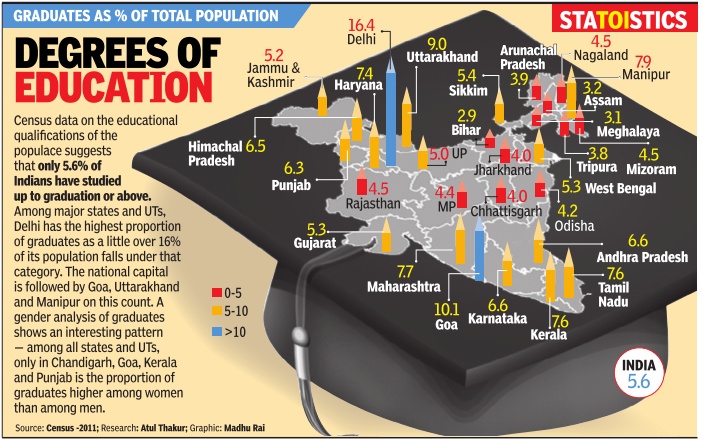
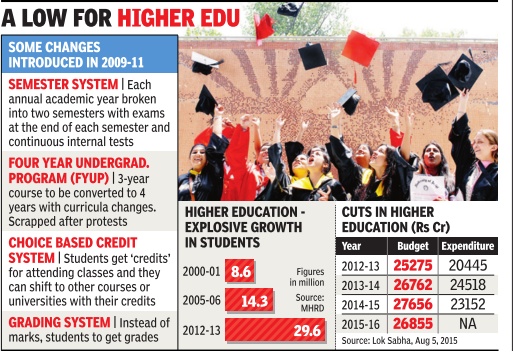
Subodh Varma
Amid staff crunch & fund cuts, new tweaks hobble higher edu
India's gigantic higher education set-up -712 universities, 37,204 col leges, 30 million students, 1.3 million teachers -is in the grip of a simmering crisis as the hunger for better education grows. From UPA-2's time and in the days of the present government too, a top-driven policy of change has seen a semester system started, a four-year undergraduate programme introduced and withdrawn, a new grading system fitfully implemented and, recently , a choice-based credit system partially introduced.
These are deep-striking changes affecting millions.How have they gone down among students and teachers? How is the system, straining to accommodate a flood of students, with teachers in short supply , classrooms filled beyond capacity , and curricula being questioned for relevance, absorbing these changes? TOI found some answers talking to teachers and students across states.
In some varsities the semester system is yet to be implemented. Anil Singh, a lecturer at RML Awadh University in Faizabad, UP , says although UGC introduced it in 2009-10, it has yet to percolate to colleges of his university. “There are no teachers, classrooms, or facilities. We're barely coping in the present system. How can we run a semester system,“ he says.
Allahabad University runs a semester system at the PG level, but a teacher shortage is dragging it down. Over 500 posts of teachers are vacant, says Vikas, who is pursuing a political science PhD.“There are classes where 150 to 200 students sit together. Is that a desirable pupil-teacher ratio,“ he asks.
In MP , semesters were introduced throughout. Without adequate classrooms, laboratories and sufficient teachers, it's a load for stu dents, says Kuldip, an MTech student of RG Technical University. The state decided to scrap the system last year, but under Central pressure it had to continue with it.
In Rajasthan's eight state universities and 40 private ones, the semester system is partially implemented in undergraduate courses, says Mahipal, a student of JNV University , Jodhpur. The experience has been very bad, he claims, because of a teacher shortage. “In many cases, a student gets his or her degree one-and-a-half years late because there are insufficient teachers and non-teaching staff to conduct exams and process results,“ he explains.
Shahnawaz of CDL University, Sirsa, Haryana, complains semester exams clash with the peak harvesting season. “Students travel long distances from far-off villages.They can't spend the whole day in college,“ he says.
Kurukshetra University has 464 regular and 400 contractual teachers, Shahnawaz says. “In many colleges, half the classes are not held. Some times guest lecturers are fixed up -at Rs 250 per lecture.“
In Haryana, Shahnawaz says, results get delayed 6-8 months because of extended exam schedules. In Punjab, the clash with agricultural work crops up among the litany of complaints against semesters.Delayed results, mechanical division of syllabus, lack of teachers, are the others.
“The fee structure changed with the semester system and most colleges added a few hundred rupees, supposedly to meet the cost of extra work in exams etc. This caused hardship to many students,“ says Harinder Bajwa of Punjabi University , Patiala.
In Uttarakhand, semesters have resulted in delayed results, says Dehradun's Abhishek Bhandari. This is because of a teacher shortage in the interior areas and also difficult communication.
“Many distant colleges skip internal assessments.About 50% of internal assessments are delayed. All these add up. Results of the 2013-14 academic year were declared after one year,“ he says.
Himachal too implemented the system at all levels. But teacher shortage has created a “crisis“, Suresh Sarwal of HP University , Shimla, says.PG departments have 300 vacancies and 120 students pack into a class, he says.
Some 60 varsities are supposed to implement the choice-based credit system this year. But in most of thofficials and teachers are unclear how it is to be done.Singh from Faizabad says it will be impossible to implement when the semester system is in doldrums. Delhi University , a laboratory for implementing these changes, has seen stiff opposition from both students and teachers.
Instead of increasing funds for the teetering higher education system so that infrastructure can be improved and more teachers appointed, the government has like the UPA, cut funding. According to a Parliament statement, in 201415, the allocation for higher education was Rs 27,656 crore, actual spending was squeezed to Rs 24,518 crore. This year, allocation was slashed by over Rs 800 crore and reports talk of further curbs on fund release. It doesn't look as if the government has any plans of rescuing the shaky system, headed for chaos.
Cities: The educational levels of various/ 2011
The Times of India, Dec 12 2015
Subodh Varma
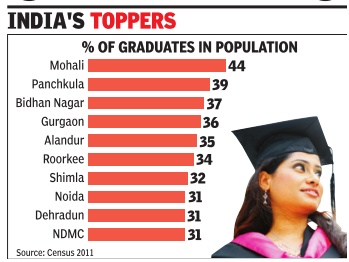
44% of Mohali residents are grads, the highest among Indian cities
Sahibzada Ajit Singh Na gar, better known as Mo hali, the cricket venue near Chandigarh, has the distinction of having the highest share of graduates in its population among all Indian cities.Nearly 44% of its residents are either graduates or above.
Another Chandigarh neighbour, Panchkula, has the second highest share at 39%. Others in the top 10 include Bidhan Nagar, popularly called Salt Lake City, in Kolkata, Gurgaon, and Alandur in Chennai.
These details have been drawn from the data on educational levels of cities collected during Census 2011 and released recently . A total of 505 cities are included, ranging from Jehanabad in Bihar, with a population of 6.6 lakh, to the giant Mumbai Municipal Corporation, with 96 lakh residents. They represent 45% of urban India.
About 6% of India's population were graduates or above in 2011. One third of them stayed in rural areas, and the remaining in urban areas.
The Census office follows its own methodology of classification which does not always harmonise with other authorities, or with common sense. For instance, urban Delhi is divided into New Delhi Municipal Council (NDMC), the Municipal Corporation of Delhi (MCD), and several census towns which would actually come under the jurisdiction of MCD.These were created as categories many decades ago, but continue as units even now.
Bidhan Nagar, Panchkula and SAS Nagar were the top three cities, in that order, in the 2001 Census too. They are urban areas that evolved as hubs of the educated middle class in the 1980s and 1990s. Both Bidhan Nagar and Panchkula house a large number of state government offices and institutions, with their employees staying nearby .
In 2001, again because of a Census office peculiarity , NDMC was broken up into several parts and counted as separate units. This led to four of these parts figuring in the top 10. This time round, NDMC has been aggregated into one unit, and it comes in at the tenth spot.
Gurgaon was placed at the 15th spot and Noida at 14th in 2001. Both have since moved into the top 10, pushing NDMC behind. Two cities from Uttarakhand, its capital Dehradun and the educational hub Roorkee, have moved up into the top rankings. Dehradun became the capital in 2001, drawing within it an explosion of government employees, besides being a base of several institutions since the British times.Roorkee's famous engineering college was upgraded to a fullfledged IIT in 2001. Both Dehradun and Roorkee are major Army cantonments too. So where are the big metropolises of India in this ranking? Delhi is divided into several smaller units. Many of Delhi's Census towns, surprisingly , are near the bottom of the list. The reason is that these areas -like Sultanpur Majra, Mustafabad, Kirari, Bhalaswa Jehangirpuri -are populated by the working class and poorer sections of Delhi. The share of graduates and above in their popula tions is between 5 and 6%.
Chennai clocks in at number 53, with about 24% of its population graduates or above, Kolkata at 79 with 22%, and Greater Mumbai at 192 with about 19% graduates and above. At the very bottom of the ranking are small towns, mostly with industrial populations. The five cities with the least number of graduates are Jamuria and Dabgram, suburbs of Asansol and Siliguri, respectively , in West Bengal, and Bhiwandi (Maharashtra), Loni (UP) and Botad (Gujarat), all industrial townships. Loni is on the outskirts of Delhi.
The spread of higher education
Bengaluru district: villages without graduates
Kumaran P, 104 areas in Bengaluru have zero graduates , Aug 14, 2017: The Times of India
HIGHLIGHTS
30,000 villages in the state were surveyed by the Rural Development and Panchayat Raj Department
The data shows said that over 2,070 villages in Karnataka have zero graduates.
It may be hard to believe that in a booming city like Bengaluru, there could be a whole village that doesn't have a single graduate. And yet, in reality, there isn't just one but 104 areas here (with a population of 200 or more) that have zero graduates!
Take, for example, a place called Manchanahalli, under Bengaluru Urban district. It has a population of 1,796, but not one of them is a graduate. This is also the case with Hosahalli (population of 881), Arehalli (842) and Patnagere Gollahalli (252).
Recently, 30,000 villages in the state were surveyed by the Rural Development and Panchayat Raj Department and the compiled statistics said that over 2,070 villages in Karnataka have zero graduates. But the fact that even Bengaluru, the country's IT capital, has such pockets came as a surprise to the Department of Collegiate Education. It now plans to fix the situation.
Ajay Nagabhushan MN, Commissioner, Department of Collegiate Education, told Mirror: "This census was done based on the socio-economic status of villages in the state. They've given us the list and now it's our job to identify the real numbers and take action to improve the situation."
BUT, HOW'S IT POSSIBLE?
Asked why Bengaluru has so many settlements with no graduates, Nagabhushan explained: "These are places where the infrastructure is poor and teachers are not up to the mark. Then there are several social issues affecting students of such regions too. They quit college mid-way, but more worryingly, they don't want to go to college at all. It is in these areas that we see youth having early marriages. They usually stop education after PU."
So, as the collegiate department begins to take its own count, it has broadly chalked out its plans to remedy the situation.
Trends
2016-17: Science displaces engineering at No. 2
HIGHLIGHTS
Science courses have re-emerged as India’s second most popular undergraduate stream.
Arts has always had the biggest draw and that trend persists.
While 97.3 lakh students joined BA in 2016-17, 47.3 lakh chose BSc courses and 41.6 lakh took up engineering, HRD ministry data shows.
With engineering losing its sheen, science courses have re-emerged as the country’s second most popular undergraduate stream. Arts has always had the biggest draw and that trend persists.
While 97.3 lakh students joined BA in 2016-17, 47.3 lakh chose BSc courses and 41.6 lakh took up engineering, HRD ministry data shows.
"Thanks to growing diversification with BSc courses in branches such as computers, electronics and pharma, science is no more a plain vanilla option. And an engineering degree is valued only if the student has passed out of a reputed institution. We often see an engineer competing for the same job as a BA or a BCom grad,” said Prakash Gopalan, director, Thapar Institute of Engineering and Technology. “Programmes are closing down and so are colleges. Piece all this and it speaks about the engineering education scenario. The word is quality. In times to come this trend may get pronounced if quality is not upped,” he added.
Choices exercised by undergrad applicants have changed dramatically in the past half-a-decade. Till about five years ago, commerce was second to arts while science and engineering vied for third spot.
In 2013, BA courses had 75.1 lakh students, followed by commerce, which saw an enrolment of 28.9 lakh students. B Tech had 17.9 lakh; BE 16.4 lakh candidates and BSc 25.4 lakh students, as per the HRD ministry data.
Then suddenly, commerce lost its appeal and was relegated to the fourth spot. In 2014-2015, engineering was the second-most popular course as the IT sector continued to account for mass recruitments.
The emergence and popularity of engineering saw this professional stream become a broadbased course like BA, BCom and BSc. In fact, as an expert said, even those aspiring to do business or a course like an MBA started signing up for engineering given the design of entrance exams for B-schools.
But now the proliferation of second-rate colleges has acted as a spoiler. Data from 2015-16 and 2016-17 shows science admissions are up while placements in engineering are dipping.
Manash Gohain, July 28, 2018: The Times of India
From: Manash Gohain, July 28, 2018: The Times of India
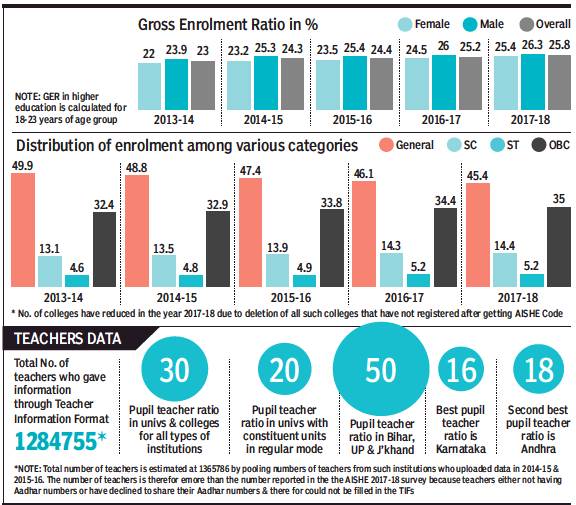
Male and female students enrolled in colleges and universities;
OBC, SC and ST students enrolled in colleges and universities;
Pupil: teacher ratio.
From: July 28, 2018: The Times of India
Enrolment in higher education touched 25.8% this year, marginally up from last year’s 25.2%, but the share of girl students remains lowest in institutions of national importance, according the annual survey conducted by the ministry of human resource development.
Noting a significant growth in enrolment at the undergraduate level with an increase of over 1.20 lakh candidates for the 2017-18 session in the age group of 18-23 years, the All India Survey on Higher Education (AISHE), 2017-18, shows rising enrolment of OBC category students while there is a decline in the general category.
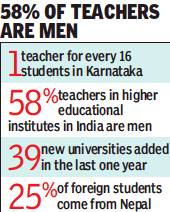
The average pupil-teacher ratio stands at 30, with the best ratio recorded in Karnataka which has one teacher for every 16 students, followed by Andhra Pradesh with 1 for 18. The worst ratio is in Bihar, Uttar Pradesh and Jharkhand with one teacher for nearly every 50 students, said the survey.
In the last five years, distribution of enrolment for general category students has been declining —from 49.9% in 2013-14 to 45.4% in 2017-18.
39 new univs added in last one year: Survey
Growth in enrolment of scheduled caste and tribe students is marginal while OBC enrolment has grown from 32.4% in 2013-14 to 35% in 2017-18. The General Enrolment Ratio (GER) for SC category is 21.8% and 15.9% for ST as compared to the national GER of 25.8%.
For the first time, the survey collected detailed information about individual teachers with men constituting 58% of the teaching community. However, states like Kerala, Meghalaya, Nagaland and Delhi have more women teachers. The lowest gender ratio for teachers in the HEIs has been recorded in Bihar where 80% teachers are men, followed by Jharkhand with 70% men.
The survey states maximum number of students are enrolled in BA programme, followed by B.Sc and B.Com programmes.
The survey points out that 39 new universities were added in last one year. In a total of 903 universities, 15 are exclusively for women. Of the total nearly 40,000 colleges, more than 60% are located in rural areas while 11% are exclusively for women.
The survey points out that over 81,000 teachers in higher educational institutions either don’t have a Aadhar number or refused to reveal their details.
Women in higher education
Women graduates double/ 2001-11
The Times of India, Aug 02 2015
Subodh Varma
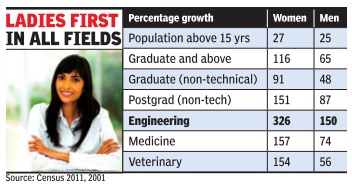
Rise in women grads almost double that of men in a decade
The level of women's education in India witnessed a dramatic rise between 2001 and 2011, with 116% more women emerging graduates or above compared to a just 65% increase among men. There was also a spike in women completing post-graduation (151%) and those earning professional and technical degrees (196%), key findings of Census 2011, released on Friday , reveal. In 2011, the country had over 68 million people who were graduates or more qualified. This is over 8% of 838 million people who were 15 years of age or older. A decade ago, this proportion was about 7%. Those with technical degrees (or equivalent) now number 12 million compared to about 5 million in 2001. However, this is a miniscule 1.4% of the total 15+ years population of India.
The number of women with teachers' training graduate degrees went up by 122%; the rise for those with nursing medicine degrees was 157%. What is more surprising is that women engineers grew by 326% in these years. In 2001, there were only about 4.8 lakh women engineers. This has exploded to over 20 lakh now. Engineering has for long been dominated by men -there are over 52 lakh men in the profession, more than twice the number of women engineers. Overall, engineering and related technological degrees appear to be the most popular courses because the number of such graduates has jumped up by a massive 182% in a decade. This may , of course, lead to saturation of the market, experts feel, though the IT sector is still an at tractive proposition.
There appears to be a preference among women to go for technical education as it is seen to help in getting jobs. This is evident from the fact that the number of women with technical diplomas (not degrees) stands at nearly 19 million, up 146% in a decade. Compare this to non-technical diploma which is held by just 0.34 million (3.4 lakh).
Census 2011 has also released data for educational level for all the people who were seven years or above of age, that is, it includes schoolchildren. The drive for girls to be educated becomes immediately apparent: the number of girls at the mid-school level is up 64%, at matric or secondary level by 50% and at senior secondary level by a whopping 146%. Clearly , a new India is being forged in educational institutions and women are moving towards an equal share. It is now for the economy and those who run it to provide decent employment to educated women -something that has been a big failing till now.
2011-17: Gender gap narrowing
Manash Gohain, Gender gap narrowing in higher edu: HRD survey, January 8, 2018: The Times of India
From: Manash Gohain, Gender gap narrowing in higher edu: HRD survey, January 8, 2018: The Times of India
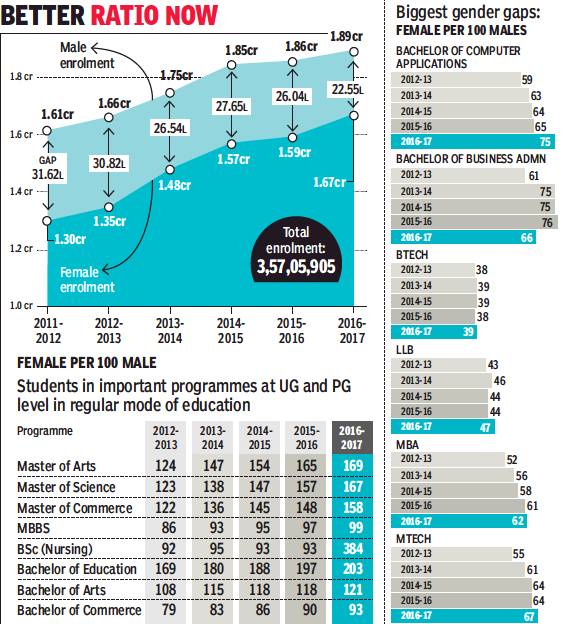
Girl Students Outnumbered Boys In Eight Disciplines In 2016-17
Gender gap in India’s institutes of higher studies has reduced by nine lakh in the last five years with girl students outnumbering men in eight disciplines in 2016-17 academic session, according to a survey of the HRD ministry.
While in master’s of arts, there are 160 women for every 100 men, in bachelor’s of science (nursing) has 384 women for every 100 men. Even in the postgraduate classes of science and commerce, women have handsomely outnumbered men with 167 and 158 respectively per 100 males. However, in undergraduate and technical and professional courses like BTech, law or management, the enrolment is skewed in favour of males and the gap is significant.
The All India Survey on Higher Education, released by the HRD ministry on Friday, says the gender gap in higher educational institutions decreased by over nine lakh from 2011-12 to 2016-17 (31.5 lakh to 21.5 lakh). The survey shows the Gender Partiy Index increased to 0.94 in 2016-17 from 0.86 in 2010-11 with women participation in certain disciplines very high and increasingly sharply in courses like MA, MSc, and MCom.
The enrolment by the end of 2016-17 academic year stands at 3,57,05,905 with a Gross Enrolment Ratio (GER) of 25.2. GER is counted from the number of students enrolled in higher education institutions out of the total population in the age group of 18 to 23 years. Women continue to outnumber men in bachelor’s of arts and education. In MBBS there are 99 women per 100 male students, up from 86 in 2012-13, and in BCom up to 93 from 79 in the same period.
At MSc level, mathematics, physics and zoology are subjects where the number of women is over 60% while in chemistry it is 56.3%. At postgraduate level, the highest number of enrolment has been for mathematics with a total of 1,43,762 students of which 62.1% are women. In social sciences and specially in courses like political science, 52.2% students are women.
However, as per the survey, even though the GER of female is higher, there is still significant gap in BTech, MTech, law and MBA programmes. In BTech, there are only 39 women per 100 men, hardly any improvement from 38 women in 2012-13. Barring MPhil and PG levels, the gap is also significant in diploma level courses with 70% male enrolment.
India aims to attain a GER of 30% by 2020.
2014> 2018-19
MANASH.GOHAIN, Sep 24, 2019: The Times of India
From: MANASH.GOHAIN, Sep 24, 2019: The Times of India
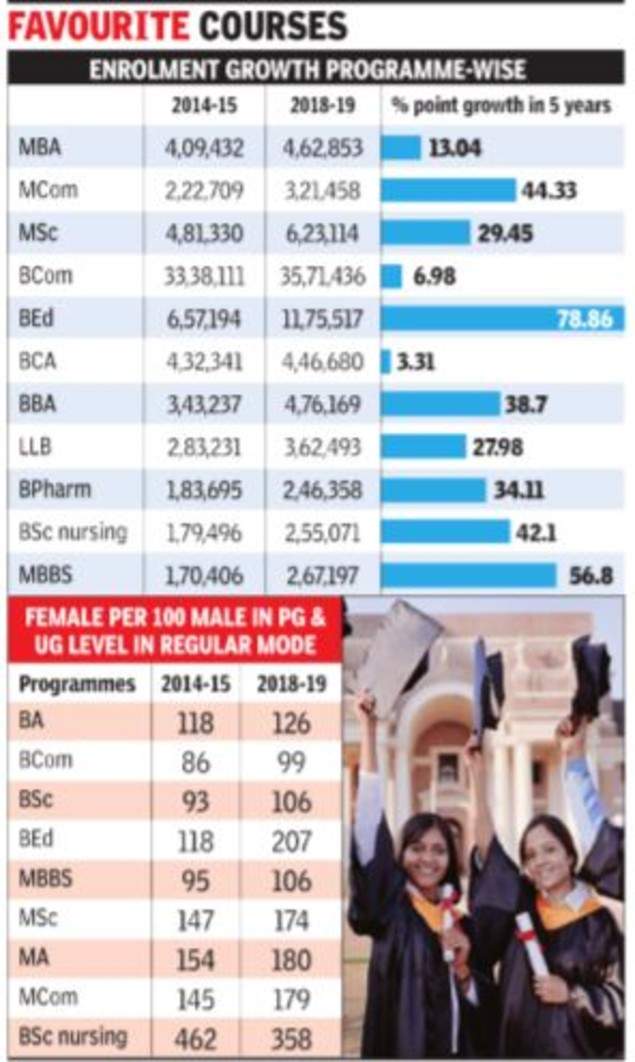
Female scholars number just 24% in 127 institutions of national importance although overall there are more females in eight out of 16 undergraduate and postgraduate programmes on Indian campuses, according to the All India Survey on Higher Education (AISHE) 2018-19.
There are more females pursuing science and medicine at undergraduate level, while for BCom, there are 99 females for every 100 males on campus. Also women comfortably outnumber men among those graduating at UG, PG, PG diploma and MPhil level.
Female participation is high and has increased sharply at MA, MSc and MCom levels during the last five years. In master’s level, there are more females in science and arts with 62.72% and 61.78% of the total enrolment, respectively.
Women made big strides in BCom, BSc & MBBS in 5 yrs
Today some of the programmes where the gender gap is significantly in favour of the females are medical (at UG level) where it is 60.6%, Arts at 53.03% and Science at 51% of total enrolment. In master’s level there are more females in Science and Arts with 62.72% and 61.78% of total enrolment respectively.
Female participation has been dominant in BA, BEd, BSc nursing, MA, MCom and MSc for past five years. But the bigger stride by women in the last five years has been made in BCom, BSc and MBBS.
But what can cause some concern are the figures for the last three years in institutions of national importance which show the numbers for female scholars are more or less static at institutions like AIIMS, IITs, IISERs, NITs and Schools of Planning and Architecture, among others.
Females have also a lot of catching up to do in law where enrolment stands at 33.7% and just 28% and 28.86% in BTech and BE, respectively. In MTech, there has been a continuous decline as the number of females per 100 males have dipped from 64 in 2014-15 to 54 in 2018-19. Despite marked improvement from 58 females per 100 males to 75 in MBA courses, and 64 in 2014-15 to 70 in 2018-19 in BCA, the gender gap remains significant.
Women fare poorly in overall enrolment in technical education (BE/ BTech) with the bulk of the institutions of importance offering professional technical courses. The biggest gap is at the undergraduate level, where there are 26,736 females as compared to 96,724 males. Similarly at postgraduate level, the number of females is just 12,819 in a population of 50,201.
The AISHE data also indicates a shift in preference as increasing number of students opt for professional programmes like management, law, computer applications, pharmacology and medicine, touching a fiveyear high in enrolment. However, traditional engineering and arts programme, as well as BTech/ BE/ MTech enrolment have continued to slide in the last five years.
Meanwhile, enrolment numbers continue to decline for the fifth consecutive year for engineering and technology, bachelor in arts. BSc and MA have for the first time in five years registered negative enrolment figures in 2018-19.
2015-20
Manash Gohain , June 11, 2021: The Times of India
Even though the share of female students is lowest in institutes of national importance, there has been an overall increase of over 18% in female enrolment in higher education from 2015-16 to 2019-20. The All India Survey on Higher Education (AISHE) 2019-20 released on Thursday also revealed that apart from more females being enrolled in MPhil, postgraduate and certificate levels, they continue to dominate in medical sciences, BA and BSc programmes.
However, it is in the professional and technical courses where female enrolment is significantly lower.
Sharp jump in female enrolment at MA, MSc level
The All India Survey on Higher Education also found a very high and sharp increase of female participation at MA, MSc and MCom levels during the last five years. “From 2015-16 to 2019-20, there has been a growth of 11.4% in student enrolment. The rise in female enrolment in higher education during the period is18.2%. The Gender Parity Index in higher education in 2019-20 is 1.01 against 1.00 in 2018-19, indicating an improvement in the relative access to higher education for females,” it stated.
As per the report, the number of female students is lowest for institutes under state private open university (2,499) followed by institutes under State Legislature Act (3,702) whereas the share is highest in state public universities.
“Share of female students is lowest for institutes of national importance (24.7%) followed by deemed universities government (33.4%) and state private universities (34.7%).” The percentage of female students in state public universities is 50.1% and in central universities it is 48.1%. While at master’s level for arts, science and commerce there has been a sharp increase in female participation between 2015-16 and 2019-20, “it is still very low at undergraduate courses”.
See also
Central Board of Secondary Education (CBSE)
Higher Education, India: 1
