Foreign Direct Investment (FDI): India


This is a collection of articles archived for the excellence of their content. |
FDI in India: A timeline
The Hindu, June 21, 2016
Twenty-five years of changes in FDI policy: highlights
1991
July: New industrial policy of Narasimha Rao government as part of the Union Budget presented by Manmohan Singh, which led to a substantive opening up of the Indian economy.
August: FDI up to 51 per cent opened up in 47 high-priority sectors, including software (with 34 sectors under automatic route), with a condition that capital goods imports be financed by foreign equity. Export trading firms, hotels and tourism businesses also allowed 51 per cent FDI.
Foreign Investment Promotion Board (FIPB) set up in the PMO to vet FDI proposals, with a Finance Minister-headed panel deciding on investments taking a call on FDI over Rs 300 crore.
1992
April: FDI in software also put on automatic route.
May: Use of foreign brand names allowed.
June: Dividend balancing norms for FDI-backed firms, linking dividend payments to export income, scrapped for all but consumer goods firms.
1994
October: FDI in Pharma up to 51 per cent put on automatic approval route, except for recombinant DNA technologies.
1996
FIPB transferred to Department of Industrial Policy and Promotion (DIPP); approvals up to Rs. 600 crore by Industry Minister, Cabinet Committee for nods over Rs. 600 crore.
November: Condition linking import of capital goods to foreign equity investments scrapped.
1998
October: 49 per cent FDI allowed in mobile telephony by satellite.
1999
January: FDI in construction of highways, toll roads and ports raised from 74 per cent to 100 per cent.
March: Timeline for considering FDI proposals slashed from six weeks to 30 days.
2000
March: Eases norms for 100 per cent FDI in NBFCs.
October: 26 per cent FDI in insurance sector.
2001
May: 100 per cent FDI in drug manufacturing and pharma, airports, hotel, tourisms, 26 per cent FDI in defence, 74 per cent in select activities of telecom sector, 49 per cent FDI in banking sector.
2004
January: 100 per cent FDI in petroleum product marketing, oil exploration, petroleum production and natural gas pipelines.
March: 74 per cent FDI in private banks.
2005
March: 100 per cent FDI in townships.
November: 74 per cent FDIin telecom, 20 per cent FDI in radio broadcasting.
2006
February: 51 per cent FDI in single brand retail.
March: 74 per cent FDI in telecom.
2008
March: 100 per cent FDIin airports, 74 per cent FDI in non-scheduled air transport services.
2009
January: 100 per cent FDI in fax publication of foreign newspapers, 26 per cent FDI in publication of Indian versions of foreign publications.
2011
November: 100 per cent FDI in brownfield pharmaceutical projects (earlier only in greenfield).
2012
January: 100 per cent FDI in single brand retail.
September: 52 per cent FDI in multi-brand retail. 49 per cent FDI in aviation companies, power exchanges. 74 per cent FDI in teleports, mobile TV.
2014
August: 49 per cent FDI in defence sector, 100 per cent FDI in some aspects of rail infrastructure.
2015
March, April: 49 per cent FDI in insurance, pension sectors.
2016
June: 100 per cent FDI in trading including through e-commerce, amendments to FDI in defence sector policy, 100 per cent FDI in teleports, DTH, mobile TV, 100 per cent FDI in brownfield aviation projects, 74 per cent FDI in private security agencies, amendments to FDI in animal husbandry policy, relaxing norms in single brand retail.
Foreign companies registered in India
Feb 09 2015
DESTINATION INDIA
As of December, 2014, there were over 4,000 foreign companies registered in the country. Of these, a little over 79% were active.Interestingly. the national capital had the highest number of such companies. It was followed by Maharashtra, Karnataka, Haryana and Tamil Nadu, usually perceived as some of the most industrialized states. The relatively large number of companies registered in Haryana seems to be linked to MNCs located in Gurgaon, one of the NCR's leading business hubs
FDI by G20 nations: 2000-15
The Times of India ,Sep 02 2015

Kounteya Sinha
UK leads G20 nations flow to India in FDIHOT The latest data to confirm Britain's increasing interest in investing in India will make PM Narendra Modi happy a couple of months before he embarks on his maiden visit to the United Kingdom. The UK has become the largest investor in India among all G20 countries with a combined revenue of more than $54 billion in India.
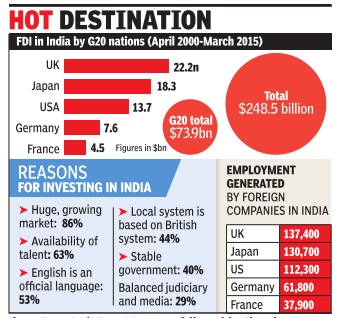
Between the year 2000 and 2015, UK's FDI into India amounts to $22 billion -9% of all FDI in the country .
In total, G20 nations invested $ 73.9 billion in India between 2000-2015 with the UK being the single largest G20 investor into India followed by Japan ($ 18.3 bn), the US ($13.7bn), Germany ($ 7.6 bn) and France ($ 4.5 billion).
As India's largest employer, UK firms employ around 691,000 people across the country -5.5% of total organized private sector jobs in the country . Between 2000 and 2015, UK FDI generated around 138,000 direct jobs, 7% of the total 1.96 million jobs generated by FDI in India.
India's massive talent pool was the main reason for 63% of the British companies to believe in India's potential while India's recent growth story made 86% of them turn to interest towards the Asian giant. English being an official language has helped, too, with 53% of the companies relying on it while 40% said it was the country's stable government.
Confederation for British Industry's first Sterling Assets India report sponsored by PwC UK and brought out in association with the UK India Business Council says that Maharashtra and Delhi have attracted the bulk of Britain's FDI into India -26% and 20% respectively .
The chemicals sector attracts the lion's share of British investment in India, at $5.78 billion (26% of UK FDI), followed by the pharmaceutical sector at $3.76 billion (17% of UK FDI) and the food processing sector at $3.05 billion (14% of UK FDI).
Katja Hall, the confederation's deputy DG, said, “The economic relationship between India and the UK is in fine fettle. The UK has played a significant role in India's growth journey , investing more and creating more jobs than any other G20 nation.PM Modi's steps to improve the ease of doing business in India are a great boost and we look forward to the EU-India FTA talks resuming.“
Private Equity (PE) investments: 2014, 2015
The Times of India, Oct 22 2015

Reeba Zachariah
PE inflows may hit record $20bn in 2015
If the last nine months of private equity (PE) activity are any indication, PE investments are poised for a strong finish in 2015. Bain Consulting, the leader in consulting to PE firms in India and globally , predicts that PE transactions will touch a record $20 billion this year, higher than the previous record of $17.1 billion in 2007.Heightened financing in consumer technology space and bigticket investments in real estate and financial services will propel PE activity to hit a new high this calendar. PE investments for the first nine months of 2015 have al ready hit $16.7 billion, outpacing 2014's total PE deal value of $15.2 billion. “The growth trend indicates that PE investment activity this year will surpass 2007, which was the best period so far,“ said Madhur Singhal, consulting principal, private equity practice, Bain Consulting.
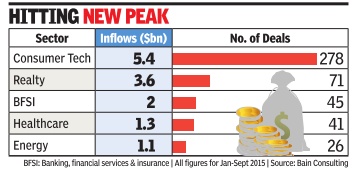
The deal activity has been chiefly driven by the country's booming consumer technology sector, which attracted $5.4 billion of investments, followed by real estate and financial services with $3.6 billion and $2 billion, respectively , during the first nine months of 2015.
Bain Consulting's PE deals database doesn't include transactions where deal value is not disclosed. The three sectors accounted for 65% of the total deal value in the January-September period of 2015 and are expected to keep up the momentum in the October to December period too. “The consumer tech space needs more capital to scale up and will continue to attract more private equity ,“ Singhal said. Early-stage and growth investments dominated 85% of the deals in the first nine months of 2015.
PE funds such as Tiger Global, Blackstone, Temasek, Advent, SoftBank, Actis and GIC have invested about $125 billion in 5,400 deals between 2005 and September-end of 2015. However, exits from portfolio companies continue to remain challenging.Many funds have been forced to hold on to their investments for a longer number of years than originally envisaged.
Exits reached $4.5 billion in the first nine months of this year, driven by public market and secondary sales. Real estate, financial services and telecom witnessed the highest number of exits. The top 10 big-ticket exits, including TPG Capital selling its stake in Shriram City Union Finance for $386 million and New Silk Route offloading its interest in PNB Housing Finance for $257 million, constituted 40% of the total PE exit value in the first nine months of 2015.
2015: India no. 1 destination

The Times of India, Sep 30 2015

India pips US, China as No. 1 FDI destination
Rises 16 llaces in ranking of competitiveness
India has emerged on top of the foreign direct investment (FDI) league table, overtaking China and the US, according to fDi Markets, the FT data service. A ranking of the top destinations for greenfield investment (measured by estimated capital expenditure) in the first half of 2015 shows India at number one, having attracted roughly $3 billion more than China and $4 billion more than the US.
India has also moved up on the World Economic Forum's Global Competitiveness Index by 16 places to 55th position from 71st.
The two reports come as a shot in the arm for the Modi government, which has taken several steps to attract foreign investment and has helped revive the mood of investors since it came to office in May 2014.
“Satisying, our efforts are paying off,“ finance minister Arun Jaitley tweeted.
The government has unveiled several initiatives like `Make in India' and `Digital India' to lure investors.
It has moved to ensure that the country moves up on the World Bank's Ease of Doing Business and states have also started their clean-up act on this parameter.
But experts say there are several areas where the government needs to step up reforms. The areas where investors want more reforms include tax policy, labour laws, cutting red tape and issues linked to land acquisition.
Investors have started taking interest in India and the recent visit of PM Modi to Silicon Valley triggered enormous interest from software and technology czars. India's growth is expected to be the fastest among large economies. Several multilateral agencies have also pointed out that India is a beacon of hope at a time when emerging economies are taking a hit and the Chinese stock market is witnessing volatility. Experts say India is expected to benefit from the slowdown in China and the overall sluggishness in global commodity prices including crude oil is expected to provide a cushion to the growth fortunes of Asia's third largest economy . The government is confident of achieving close to 8% growth in the current fiscal year. India has also moved up on Global Competitiveness Index by 16 places to 55th position.
The FT said that for the past several years, China and the US have vied for FDI supremacy and fought each other nearly to a draw last year, with the US ranking as the number one greenfield destination by number of projects and China coming in first by capital expenditure.
It said India ranked fifth last year for capital investment, after China, the US, the UK and Mexico. In a year when many other major FDI destinations posted declines, India experienced one of 2014's best FDI growth rates, increasing its number of projects by 47%, the article said.
“India is tracking well ahead of where it was at this time last year: it has more than doubled its midyear investment levels, attracting $30 billion by the end of June 2015 compared with $12 billion in the first half of last year,“ the newspaper said.
“Research from fDi Markets found 97 of 154 countries typically classed as emerging markets experiencing declines in capital expenditure on greenfield investment projects in the first six months of this year compared with the same time period last year,“ it said.
Confusion over Financial Times figures
The Times of India, Oct 01 2015

Subodh Varma
RBI pegs fund flow at $20.6Bn in first half of 2015 against FT estimate of $31Bn
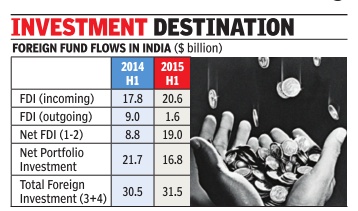
A recent report by a data consultancy owned by the FT of London created a stir by estimating that India is now the most favourite destination for foreign direct investment, beating China and the USA. The fine print indicates that they are talking about “estimated capital expenditures“ in greenfield, that is, new ventures. By this estimate, India attracted $31 billion compared to China's $28 billion in the first half of 2015. Reserve Bank of India (RBI) data for foreign investment flows does not appear to reflect this, causing much puzzlement in India. The total foreign direct investment that flowed into India between January and June 2015 is pegged at $20.6 billion. If you deduct the outflow from India in the form of outgoing FDI from India, this gets pared down to $19 billion.
Besides this inflow, there is also foreign portfolio investment mainly by institutional investors in the stock market. This was about $17 billion in the first half of 2015.
When put together, these two components of investment direct and portfolio yields about $31.5 billion for the same period. But this could hardly be what the FT report is talking about since much of this is neither greenfield nor capital investment.
The other puzzling aspect of the FT report is the com parison with China.
According to the National Statistical Bureau of China, foreign direct investment into China in the first half of 2015 was a whopping $68.4 billion, more than three times that of India's $20.6 billion, between January and June 2015.
A comparison of RBI data between the first halves of 2014 and 2015 shows that incoming FDI has increased by about 16% in 2015 but outgoing FDI has drastically declined, probably due to weakening economies around the world. Hence net FDI inflow to India has jumped up from $8.8 billion to $19 billion.
Analysis of this data by India's Department of Industrial Policy and Promotion (DIPP) indicates that most of the foreign direct investment has come into the IT sector followed by automobiles, trade and the financial sector. Major sources of FDI in India remain Singapore and Mauritius followed by the Netherlands, US and Germany .
Net portfolio investment has, however, sharply declined by about 23% from $21.7 billion in the first half of 2014 to $16.8 billion in the comparable period of 2015.
As a result of these opposing trends, the net foreign flows into India have shown only a marginal increase from $30.5 billion to $31.5 billion between the first halves of 2014 and 2015.
November 2015: Rules changed for 15 sectors
The Times of India, November 11, 2015

Govt tries to move beyond Bihar, goes for FDI reforms
The government announced a raft of changes in the foreign direct investment (FDI) rules for 15 sectors -including retail, defence, construction, banking and electronic media. The PM also was keen to ensure that the rules provide a boost to those manufacturing locally , with sources pointing to the decision to allow “Indian manufacturers“ to retail their goods, including on e-commerce plat forms -a move that will benefit the likes of Fabindia and Hidesign. Other “manufacturers“ too have been allowed to enter the retail arena without the government's approval. In a move that will make it easier for private banks to raise capital, the government has permitted full fungibility of foreign investment in private banks. This means that there will be no sub-limits for foreign portfolio investors (FPIs). While foreign direct investment of up to 74% was permitted until now, portfolio investment -investments by foreign institutional investors -was capped at 49%. Also, banks had to approach the foreign investment promotion board (FIPB) for any increase in foreign investment above 49%. The introduction of fungibility does not, however, mean that strategic investors get a free hand in picking up chunky stakes in banks. RBI regulations require that individual investor holding is capped at below 5%. Also, even promoters of banks are required to dilute their stake below 20% over a period of time. The relaxation of cap on sub-limits is in keeping with the government's proposal to announce composite caps for FDI in various sectors announced in July 2015. However, at the time of the announcement banks were kept out as they were considered `sensitive'.
FDI and the Financial Secrecy Index
The Times of India, Nov 03 2015

Countries such as Switzerland, the US, Singapore and Germany that figure in the top 10 list of FSI-2015 (and are perceived as actively promoting secrecy in global finance) are also among the top 10 FDI investors to India; Graphic courtesy: The Times of India, November 3, 2015
Lubna Kably
Switzerland still top tax haven, US jumps to No. 3
Switzerland has retained its top spot in the financial secrecy index (FSI) 2015, unveiled by the Tax Justice Network (TJN) on Monday . Switzerland is followed by Hong Kong, the US, Singapore and the Cayman Islands. The biggest surprise is the US, which has climbed to third place from sixth place in FSI-2013. Countries such as Switzerland, the US, Singapore and Germany that figure in the top 10 list of FSI-2015 (and are perceived as actively promoting secrecy in global finance) are also among the top 10 FDI investors to India. TJN's biennial FSI ranking is based on a combination of a country's secrecy score and a scale-weightage based on the country's share in the global market for its offshore financial services. Thus, for instance, even though Mauritius (India's top FDI investor) has a secrecy score of 72, it is ranked lower at 23 as it accounts for less than 1% of the global market for offshore financial services compared to Singapore. India's second largest FDI investor, Singapore, has a lower secrecy score of 69 points but is ranked at fourth position. Other top investors in India like the UK, Japan and the Netherlands have an FSI rank of 15, 12 and 41, respectively. Among the notable FDI investors in In dia, countries such as Mauritius, Switzerland and the UAE have a secrecy score of more than 70. As regards the US, TJN's communication states, “US is more of a cause for concern than any other individual country , because of both the size of its offshore sector and also its rather recalcitrant attitude to international co-operation and reform. Though it has been a pioneer in defending itself from foreign secrecy jurisdictions, aggressively taking on the Swiss banking establishment and setting up its technically quite strong Foreign Account Tax Compliance Act (FATCA), it provides little information in return to other countries.“ According to tax experts, the FACTA agreement entered into with India provides for reciprocal exchange of information, but it's too early to comment on the information that will be shared by the US. Singapore and Germany , which also figure in the top 10 list of FSI-2015, are also among the top 10 investor countries for India. Germany's laxity in tackling illicit money and also in spearheading EU's resistance to public access of country-by-country reporting by multinational corporates has been pointed at.
2015: Private equity and FII investments
The Times of India Jan 01 2016
TIMES NEWS NETWORK
Total private equity (PE) investment in India in 2015 rose to its highest in eight years and almost equalled the total foreign direct investment (FDI) in equity inflows three years back, according to a report.
Investments from PE firms rose 67% to $21 billion in 2015, from $12.5 billion, a year earlier.The previous high was $18 billion, recorded in 2007, the report from VCCEdge said. The data excludes real estate and venture debt. A separate report from the same research firm had earlier said that PE funds invested about $2.4 billion in the real estate sector, across 53 transactions, in the first nine months of 2015, This was higher compared to $2.1 billion that they invested in 2014 across 80 deals.
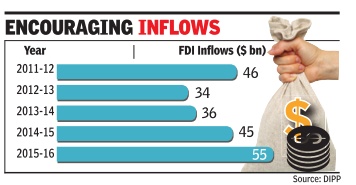
FDI in equity inflows for 201213 was $22.4 billion, out of the total $34 billion the country received. Last year, India received total FDI investments of $44.3 billion, according to latest figures from the department of industrial policy & promotion (DIPP).
The report said angel and venture capital inflows helped early-stage investments. “It was an action-packed 2015 for early-stage investment in India as Angel and Venture Capital investments were the prime drivers of capital inflow. Angel and seed investments grew 64%, increasing to $327 million from $200 million in 2014,“ according to the report.
Venture capital funding also saw a rise, recording the highest ever jump to cross a new milestone in 2015. Overall 473 VC deals were registered during the year, up from 307 recorded in 2014. Deal value too more than doubled, shooting up to $5.4 billion during the year, compared with $2.3 billion a year earlier.
