Economy: India 1
Several sections from this page have been shifted to Economy: India 2 (Ministry data)

This is a collection of articles archived for the excellence of their content. |
Contents |
The yearwise position

ii) Sales Growth of corporate India-Nominal and Real (%), 2002-17;
iii) Quarterly growth in Gross Fixed Capital Formation (%), Jun 2013- Sept 2016; The Times of India, January 31, 2017
2012-16: fastest growth in 5 years
The Times of India, Jun 01 2016
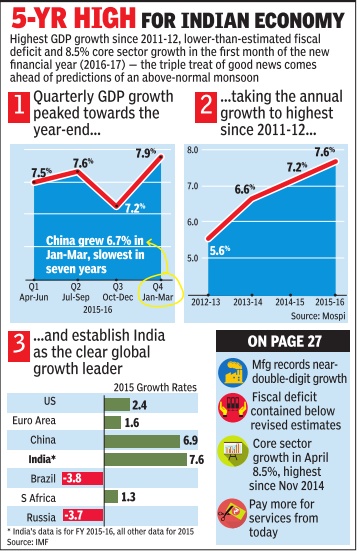
Eco grows fastest in 5 years at 7.6%
The country's economy grew 7.6% in 2015-16, the fastest in five years, while growth in the fourth quarter clocked 7.9%, keeping India ahead as the fastest growing major economy in the world.
The GDP data also brought cheers for the government, which has completed two years in office and is showcasing revival of the economy as a major achievement. India's 7.9% expansion in JanuaryMarch (fastest in six quarters) is higher than China's 6.7% expansion in the same quarter.In October-December quarter Indian economy grew 7.2%.Growth was powered by strong expansion in the manufacturing, which grew 9.3% in 2015-16 compared to 5.5% in 2014-15 and the farm sector, which clocked a growth of 1.2% in 2015-16 compared to a contraction of 0.2% in the previous year. The growth in the farm sector was despite the impact of a drought. Policy makers lauded the improving health of public finances. “.. India continues to remain a bright spot in the world economy with robust macro-economic and fiscal parameters,“ the finance mini stry said in a statement. Economist said they expect a good monsoon to support improving growth in the months ahead.

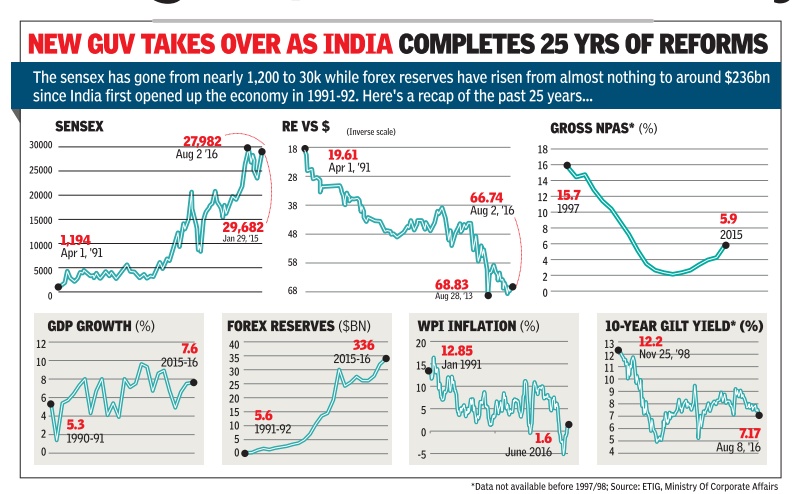



“With renewed forecast of more than normal monsoon this year, the situation in agriculture is expected to improve significantly , which will eventually lead to revival of consumption demand, especially in rural areas,“ said Madan Sabnavis, chief economist at Care Ratings.
“This in turn should also boost investment sentiment and keep food inflation under control. Also implementation of various government schemes and 7th Pay Commission will have an important bearing. With continued strong performance of the service sector, GDP growth in FY17 should see strong contributions from each sector of the economy . We expect GDP growth in FY17 to be around 7.8%,“ he said.
But the numbers also showed some weak spots such as sluggish investment growth.
“Private consumption has emerged as the bulwark of economy in 2015-16, whereas investment growth has slowed.With excess capacity and high leverage, private consumption demand will have to rise further to pare excess capacity and encourage private investment. With normal monsoon, a mild kick to public sector wages and improved transmission of interest rates, private consumption demand is set to get a boost in 2016-17,“ said D K Joshi, chief economist at Crisil.
2014-16: Economic indicators
See graphic

Facts about Indian economy: 2015-16
[The Economic Survey: 2016-17]
Indians on The Move
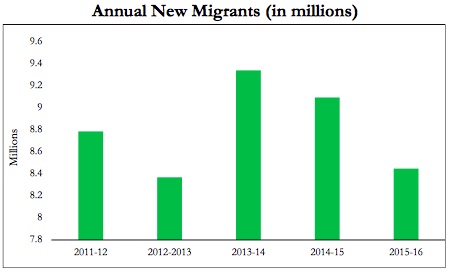
New estimates based on railway passenger traf c data reveal annual work-related migration of about 9 million people, almost double what the 2011 Census suggests.
Biases in Perception
China’s credit rating was upgraded from A+ to AA- in December 2010 while India’s has re- mained unchanged at BBB-. From 2009 to 2015, China’s credit-to-GDP soared from about 142 percent to 205 percent and its growth decelerated. The contrast with India’s indicators is striking.
New Evidence on Weak Targeting of Social Programs
Welfare spending in India suffers from misallocation: as the pair of charts show, the districts with the most poor (in red on the left) are the ones that suffer from the greatest shortfall of funds (in red on the right) in social programs. The districts accounting for the poorest 40% receive 29% of the total funding.
Political Democracy but Fiscal Democracy?
India has 7 taxpayers for every 100 voters ranking us 13th amongst 18 of our democratic G-20 peers.
India's Distinctive Demographic Dividend
India’s share of working age to non-working age population will peak later and at a lower level than that for other countries but last longer. The peak of the growth boost due to the demographic dividend is fast approaching, with peninsular states peaking soon and the hinterland states peaking much later.
India Trades More Than China and a Lot Within Itself
As of 2011, India’s openness - measured as the ratio of trade in goods and services to GDP has far overtaken China’s, a country famed for using trade as an engine of growth. India’s internal trade to GDP is also comparable to that of other large countries and very different from the caricature of a barrier-riddled economy.
Divergence within India, Big Time
Spatial dispersion in income is still rising in India in the last decade (2004-14), unlike the rest of the world and even China. That is, despite more porous borders within India than between countries internationally, the forces of “convergence” have been elusive.
Property Tax Potential Unexploited
Evidence from satellite data indicates that Bengaluru and Jaipur collect only between 5% to 20% of their potential property taxes.
2015-16: economy grew 7.9%
Eco grew 7.9% in '15-16, faster than estimated 7.6%, Feb 01 2017: The Times of India
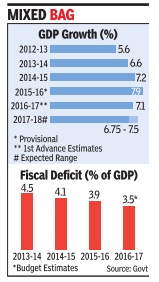
The Central Statistics Office (CSO) said the economy grew by 7.9% in 2015-16, a shade faster than previously estimated 7.6%, on account of better perfor mance by the farm and industrial sectors. CSO, however, left the figure for 2014-15 unchanged at 7.2%.
The revised growth rate would be the fastest pace of expansion for the economy in five years as data for the new series introduced in 2011-12 is available now. It would give the government ammunition to counter the Opposition's charge that the NDA's handling of the economy has slowed down the growth rate.
CSO had said that the economy was estimated to grow 7.1% during the current financial year but did not factor in the impact of demonetisation. The Economic Survey , released on Tuesday , however, indicated that the growth rate could slip to 6.5% due to the cash squeeze.
Higher growth rate would push up the base and could result in a further slowdown during the current finnacial year. It would, however, help the government show a better fiscal performance since the base has expanded.
Separate data showed the fiscal deficit up to December-end has touched 94% of the full year estimate of Rs 5.3 lakh crore.Fiscal deficit during April-December 2015 was estimated at 88% of the budget estimate.
The economy as in 2017
The Times of India, January 31, 2017
For the first time, along with a host of numbers and dry facts, the Economic Survey presented today also highlighted seven curious things about India, ranging from a perception bias against it to a fiscal disparity within it.
1.
Indians on the move
New estimates based on railway passenger traffic data reveal annual work-related migration of about 9 million people, almost double what the 2011 Census suggests.
2. Biases in perception
China's credit rating was upgraded from A+ to AA- in December 2010 while India's has remained unchanged at BBB-. From 2009 to 2015, China's credit-to-GDP soared from about 142 percent to 205 percent and its growth decelerated. The contrast with India's indicators is striking.
3. New evidence on weak targeting of social programs
The Survey says that welfare spending in India suffers from misallocation. Districts with the most poor are the ones that suffer from the greatest shortfall of funds in social programs. The districts accounting for the poorest 40% receive 29% of the total funding.
4. Narrow tax base
India has seven taxpayers for every 100 voters, ranking us 13th amongst 18 of our democratic G-20 peers.
5. India trades more than China
As of 2011, India's openness - measured as the ratio of trade in goods and services to GDP - has far overtaken China's. India's internal trade is also comparable to that of other large countries.
6. India's distinctive demographic dividend
There will a steady rise in India's working age population. While it will be slower compared to other countries, it is expected to last for much longer. Peninsular states are fast approaching the peak of the growth boost due to the demographic dividend.
7. Income divergence within India
During the last decade (2004-14), spatial dispersion in income has been on the rise in India, unlike the rest of the world and even China. Despite more porous borders within India than between countries internationally, the geographical graph of per capita income is skewed.
Balance of payment/ current account deficit
2016-2017
Deficit widens due to lower remittances, March 24, 2017: The Times of India
Remittances from overseas Indians has been dropping continuously for the last five quarters, contributing to the widening of current account deficit (CAD). The trade gap has also widened due to lower software exports.
Balance of payment data released, shows that net personal transfers -which are largely remittances by Indians employed overseas--fell to $13.6 billion during the demonetisation quarter from $14.9 billion, a drop of 9.7%.
According to numbers released by the RBI, the current account deficit widened to $ 7.9 billion (or 1.4% of GDP) in Q3FY17 as compared to $ 7.1 billion (1.4% of GDP) in Q3FY16 and $ 3.4 billion in (0.6% of GDP) in Q2FY17. The CAD is the difference between income from exports and imports, plus the difference from between outbound and inbound investment income.
A statement issued by the Central bank said that the CAD widened despite a slightly lower trade deficit year-on-year, primarily on account of a decline in net invisibles receipts. Invisible includes remittances from software, services and money sent by Indians working oversea. Net services receipts moderated compared to Q3FY16, due to a fall in earnings from software, finan cial services and charges for intellectual property rights.
From April to December, however, the deficit halved to 0.7%, from 1.4% a year ago.
This was primarily because of fall in earnings from software, financial services and charges for intellectual property rights.
Earnings from software exports have been declining year-on-year, but the third quarter has seen a sequential increase in software exports over the second quarter.
The net foreign direct investment of $9.8 billion during the reporting quarter was marginally lower than last year. The RBI said that there was a net outflow of portfolio investment of about $11.3 billion during the period in both equity and debt segments, as against a net inflow of $0.6 billion in the year-ago period. During the current fiscal, net FDI rose 12.3% to $30.6 billion as compared to April-December 2016.
See also
Economy: India 1
Economy: India 2 (Ministry data)
And also...
Income Tax India: Expert advice, 2016-17