Developmental indicators: India
Contents |
1947 vis-à-vis 2020

From: August 15, 2020: The Times of India
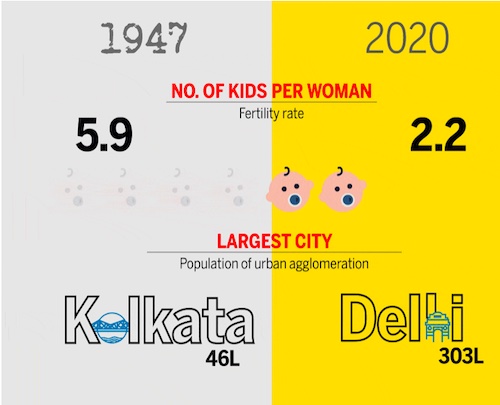
From: August 15, 2020: The Times of India

From: August 15, 2020: The Times of India
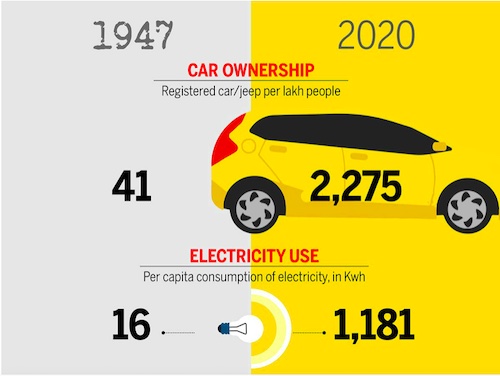
From: Sajeev Kumarapuram, August 15, 2020: The Times of India
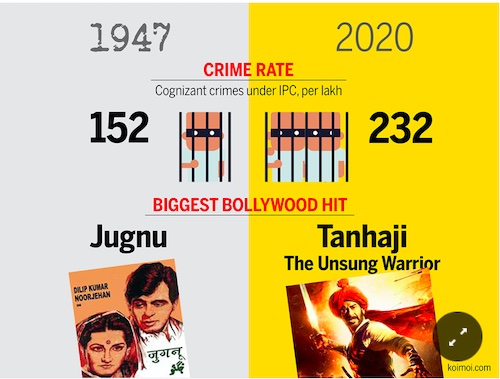
From: Sajeev Kumarapuram, August 15, 2020: The Times of India

From: August 15, 2020: The Times of India

From: August 15, 2020: The Times of India
See graphics:
Income per person and population density- India’s developmental indicators- 1947 vis-à-vis 2020
No. of kids per woman, largest city- India’s developmental indicators- 1947 vis-à-vis 2020
How long Indians live, urban population- India’s developmental indicators- 1947 vis-à-vis 2020
Car ownership, electricity usage- India’s developmental indicators- 1947 vis-à-vis 2020
Crime, biggest bollywood hit- India’s developmental indicators- 1947 vis-à-vis 2020
Political map of India- on the eve of independence and today- India’s developmental indicators- 1947 vis-à-vis 2020
Pakistan on two sides of India, Pakistan on only one side of India- India’s developmental indicators- 1947 vis-à-vis 2020
1947 vis-à-vis 2021
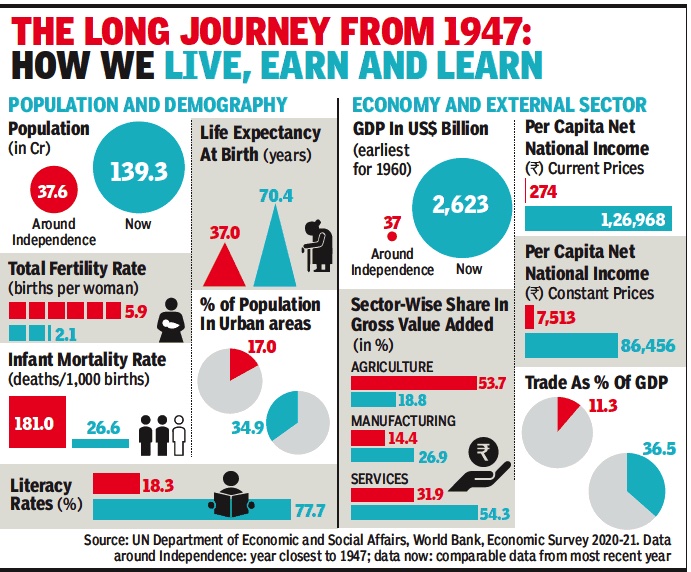
From: August 15, 2021: The Times of India
See graphic:
India’s Developmental indicators: 1947 vis-à-vis 2021
!984-2014
Education

See Graphic ‘Education in India: 1984-2014
Income

See Graphic ‘Per capita income in India: 1984-2014
Infant morality
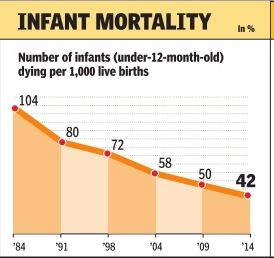
See Graphic ‘Infant Mortality in India: 1984-2014
Poverty

See Graphic ‘Poverty in India: 1984-2014
Unemployment

See Graphic ‘Unemployment in India: 1984-2014
2011> 2018

Electricity,
Tap water,
Toilets at home,
LPG connections.
From: October 5, 2018: The Times of India
See graphic:
Urban and rural India ‘s developmental indicators, 2011> 2018 in terms of access to
Electricity,
Tap water,
Toilets at home,
LPG connections.
2014, 2015

From: January 19, 2019: The Times of India
See graphic:
Status of sustainable development in India: 2014, 2015
2011 vis-à-vis 2021
Source: The Economic Survey of India: February 1, 2022: The Times of India

From: Source: The Economic Survey of India: February 1, 2022: The Times of India
From: Source: The Economic Survey of India: February 1, 2022: The Times of India
From:Source: The Economic Survey of India: February 1, 2022: The Times of India

From: Source: The Economic Survey of India: February 1, 2022: The Times of India

From: Source: The Economic Survey of India: February 1, 2022: The Times of India

From: Source: The Economic Survey of India: February 1, 2022: The Times of India

From: Source: The Economic Survey of India: February 1, 2022: The Times of India

From: Source: The Economic Survey of India: February 1, 2022: The Times of India

From: Source: The Economic Survey of India: February 1, 2022: The Times of India

From: Source: The Economic Survey of India: February 1, 2022: The Times of India

From: Source: The Economic Survey of India: February 1, 2022: The Times of India
From: Source: The Economic Survey of India: February 1, 2022: The Times of India

From: Source: The Economic Survey of India: February 1, 2022: The Times of India
From: Source: The Economic Survey of India: February 1, 2022: The Times of India
How does the picture of India’s economic progress change when we move from a worm’s eye view to a bird’s eye view? A chapter in this year’s economic survey attempts to show the change by moving away from economic data to another kind of data – geospatial data and cartographic techniques.
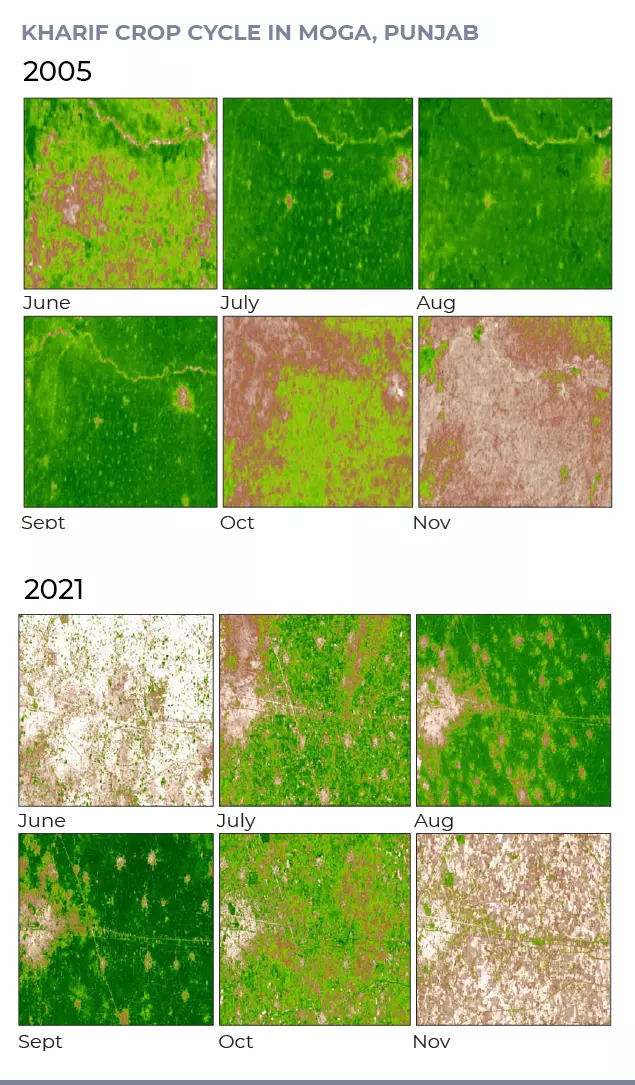
Using these tools the Survey tracked, compared, and illustrated long-term developments in the economy that get ignored in day-to-day news and analysis. For example, can nightlights captured through satellites show how greater access to electricity has changed India? Or can a 15-year visual comparison of sowing cycles in Punjab help us understand why farmers are now burning stubble more than ever?
Here are 12 images of India’s economic progress you may not have seen before:
The night sky is brighter
India’s night-time luminosity in 2012 and 2021 shows the expansion of electricity supply and economic activity.
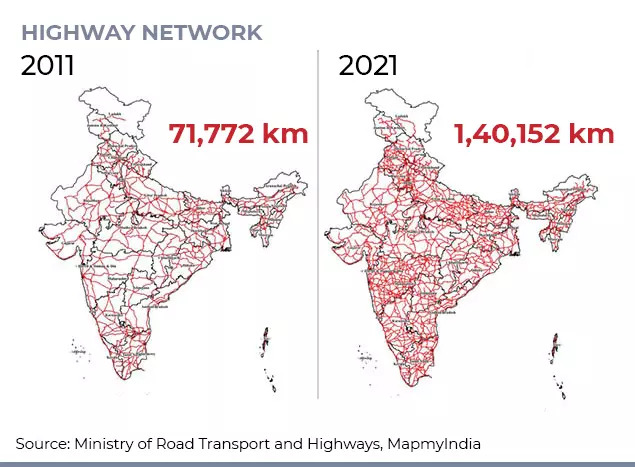
Roads of development are longer
India's national highway length has almost doubled between 2011 and 2021.
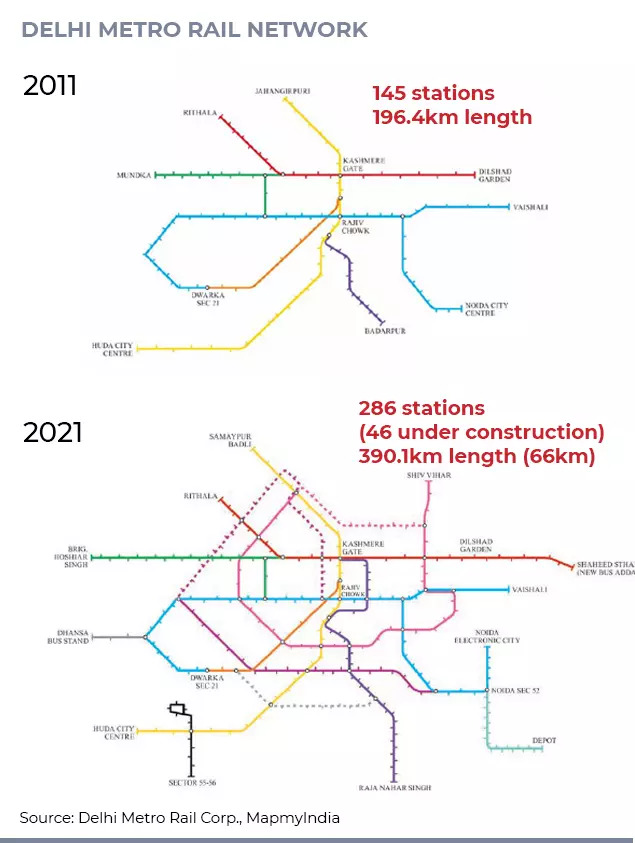
City commutes are faster and better
The expansion of existing metro rail networks in cities like Kolkata, Delhi and Bengaluru and new ones in smaller ones like Lucknow, Kanpur and Kochi has made daily commute more convenient in several cities.
More places to fly to and from
Within a span of just five years, the number of airports has more than doubled.
A bank on every street
The expansion of commercial banking to every nook and corner of the country is an indication of the increase in economic activity.
India's moving to the cities …
As cities get crowded, they have also expanded bringing a much bigger area into their fold.
… and changing the urban landscape
The needs of a growing urban population is changing the face of our cities too.
We are growing more food…
The net sown area has increased by a fifth in the past 15 years.
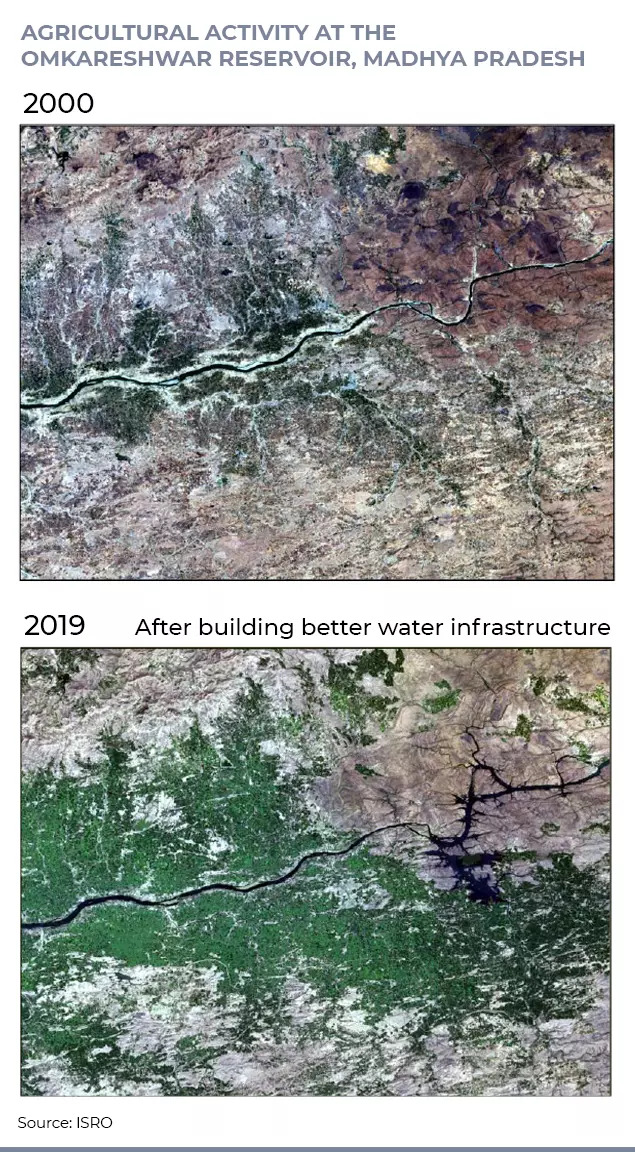
… as irrigation network expands
… and we learn to use water better
We have created problems…
The Kharif crop cycle in Punjab's Moga district has shifted ahead by two-to-three weeks between 2005 and 2021 causing the Kharif harvest to almost coincide with Rabi sowing in November. This has encouraged farmers to burn stubble. This is also related to the restrictions on early transplanting of Kharif paddy put in place in 2009 in order to reduce pumping of groundwater. However, that had the unintended consequence of damaging air quality.
…. but are also making amends
The wasteland redeployment for industrial use in Nellore, Andhra Pradesh, and for generation of solar power in Charanka, Gujarat, show that a change for better is possible.