Developmental indicators: India
(→2011> 2018) |
(→2011> 2018) |
||
| Line 29: | Line 29: | ||
''Urban and rural India ‘s developmental indicators, 2011> 2018 in terms of access to<br/> Electricity, <br/> Tap water, <br/> Toilets at home, <br/> LPG connections.'' | ''Urban and rural India ‘s developmental indicators, 2011> 2018 in terms of access to<br/> Electricity, <br/> Tap water, <br/> Toilets at home, <br/> LPG connections.'' | ||
| + | |||
| + | =2014, 2015= | ||
| + | [[File: Status of sustainable development in India- 2014, 2015.jpg|Status of sustainable development in India: 2014, 2015 <br/> From: [https://epaper.timesgroup.com/Olive/ODN/TimesOfIndia/shared/ShowArticle.aspx?doc=TOIDEL%2F2019%2F01%2F19&entity=Ar00800&sk=16EA670F&mode=image January 19, 2019: ''The Times of India'']|frame|500px]] | ||
| + | |||
| + | '''See graphic''': | ||
| + | |||
| + | ''Status of sustainable development in India: 2014, 2015'' | ||
=2018: Status of sustainable development in the states= | =2018: Status of sustainable development in the states= | ||
Revision as of 14:34, 21 January 2019
Contents |
!984-2014
Education

See Graphic ‘Education in India: 1984-2014
Income

See Graphic ‘Per capita income in India: 1984-2014
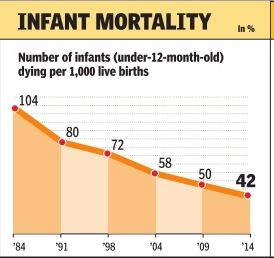
Infant morality

See Graphic ‘Infant Mortality in India: 1984-2014
Poverty

See Graphic ‘Poverty in India: 1984-2014
Unemployment

See Graphic ‘Unemployment in India: 1984-2014
2011> 2018

Electricity,
Tap water,
Toilets at home,
LPG connections.
From: October 5, 2018: The Times of India
See graphic:
Urban and rural India ‘s developmental indicators, 2011> 2018 in terms of access to
Electricity,
Tap water,
Toilets at home,
LPG connections.
2014, 2015

From: January 19, 2019: The Times of India
See graphic:
Status of sustainable development in India: 2014, 2015
2018: Status of sustainable development in the states

overall score of states and UTs
… presumably as in 2018
From: Surojit Gupta, In 12 yrs, poverty, hunger and illiteracy-free India?, December 23, 2018: The Times of India

Where the states are on 13 key goals in 2018.
From: Surojit Gupta, In 12 yrs, poverty, hunger and illiteracy-free India?, December 23, 2018: The Times of India
Kerala, HP On Top In Sustainable Development Goals Index
What if India ended poverty by 2030 and succeeded in sending all its children to school and managed to ensure healthier and more fulfilling lives for its citizens? Sounds great, but also tough you might say. The country, however, is taking big strides towards achieving these targets that are key components of the UN’s Sustainable Development Goals (SDGs).
NITI Aayog has constructed an SDG India Index that measures the country’s performance on 13 of the total 17 SDGs. And though left with distance to cover on each, the country appears on track for now. The 13 goals are no poverty, zero hunger, good health and well being, quality education, gender equality, clean water and sanitation, affordable and clean energy, decent work and economic growth, industry, innovation and infrastructure, reduced inequality, sustainable cities and communities, life on land, peace, justice and strong institutions.
Kerala and Himachal Pradesh have topped the Niti Aayog SDG index. Kerala’s top rank has been attributed to its superior performance in providing good health, reducing hunger, achieving gender equality and providing quality education. Himachal ranks high on providing clean water and sanitation, in reducing inequalities and preserving the mountain ecosystem. Assam, Bihar and UP were at the bottom of the table.
Among the Union Territories, Chandigarh was on top due to what the report called “exemplary performance” in providing clean water and sanitation to its people. It also made good progress towards providing affordable and clean energy, generating decent work and economic growth, and providing quality education.
Tamil Nadu and Puducherry are the best performers among the states and UTs, respectively, for reducing extreme poverty. Seven states are “frontrunners” (index score greater than/equal to 65). Seven states and four were in the category of “aspirants” (index score less than 50), which also means that they were at the bottom of the table. Goa and Delhi are frontrunners in the SDG category of zero hunger.
The 2030 agenda for sustainable development was adopted by 193 member states at the UN General Assembly in September 2015, and came into effect on January 1, 2016.
“It (the index) provides a benchmark to map our progress at the national as well as at the sub-national level,” said Rajiv Kumar, vice chairman of Niti Aayog, which has been mandated to oversee the progress of the SDG goals in India.