Delhi: Economy
(→2014-15) |
(→2007-15: Rise of wholesale pulses) |
||
| Line 86: | Line 86: | ||
=2014-15= | =2014-15= | ||
| − | + | =2007-15= | |
| + | ==Rise of wholesale pulses== | ||
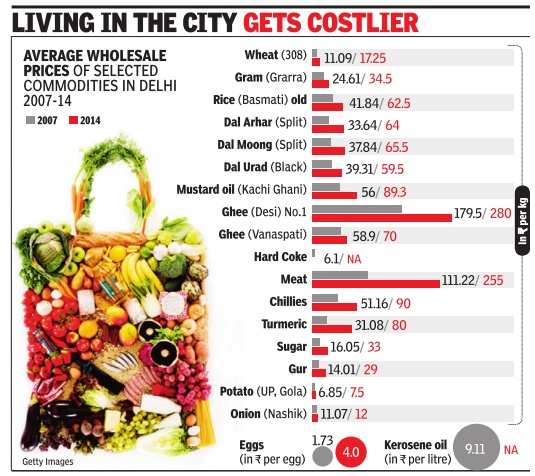
[[File: rise of wholesale prices in delhi.jpg| rise of wholesale prices of pulses: 2007-14; Graphic courtesy: [http://epaperbeta.timesofindia.com//Article.aspx?eid=31808&articlexml=In-7-years-prices-of-pulses-oil-mutton-25062015004028 ''The Times of India'']|frame|500px]] | [[File: rise of wholesale prices in delhi.jpg| rise of wholesale prices of pulses: 2007-14; Graphic courtesy: [http://epaperbeta.timesofindia.com//Article.aspx?eid=31808&articlexml=In-7-years-prices-of-pulses-oil-mutton-25062015004028 ''The Times of India'']|frame|500px]] | ||
[http://epaperbeta.timesofindia.com//Article.aspx?eid=31808&articlexml=In-7-years-prices-of-pulses-oil-mutton-25062015004028 ''The Times of India''], Jun 25 2015 | [http://epaperbeta.timesofindia.com//Article.aspx?eid=31808&articlexml=In-7-years-prices-of-pulses-oil-mutton-25062015004028 ''The Times of India''], Jun 25 2015 | ||
Revision as of 15:35, 26 June 2015
Contents |
Growth (of city): 2001-2011
Delhi gobbled up villages to grow
One Third Of Population In Urbanized Villages In Lal Dora Areas That Doubled In Past Decade
Rukmini Shrinivasan TIG 2013/06/12
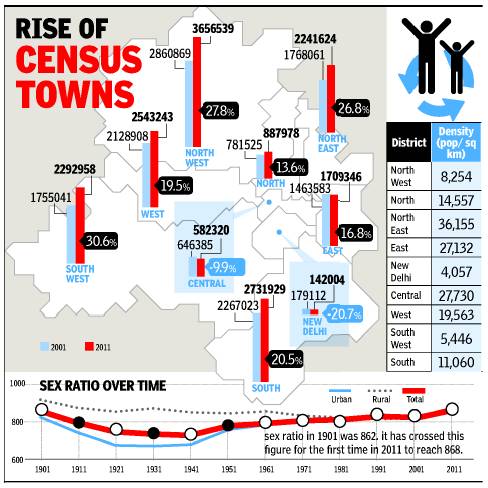
New Delhi: The capital’s growth in the decade 2001-11 has overwhelmingly come from the city swallowing up rural areas, newly released census data shows. The number of census towns—essentially newly urbanized villages in the lal dora areas—nearly doubled over the last decade, taking the proportion of Delhi’s residents who live in these areas to an unprecedented third of the population.
Varsha Joshi, director of census operations for Delhi, released the Primary Census Abstract for the National Capital Territory of Delhi on Tuesday. PCA gives the final population totals for every ward and village in NCT, as well as their literacy rates and sex ratios; provisional numbers were released last year.
The census redefines a village as a census town when it is densely populated and over three-quarters of its men work outside agriculture. In 2011, India had 3,894 census towns, home to half its urban population. The new numbers show that nearly 50 lakh people in Delhi, of a total population of 1.6 crore, live in census towns, which range in size from the 1,178-strong Shakarpur Baramad in east Delhi to Karawal Nagar, home to 2.24 lakh people, in north-east Delhi.
In 2001, 25 lakh people lived in Delhi’s census towns and they formed 18% of the population. By 2011, the proportion of rural residents in NCT had shrunk to just 2.5%. Simultaneously, the number of census nearly doubled to 110. About 30% of the NCT’s population now lives in these census towns. In fact, of the 29 lakh people added to Delhi’s population in the last decade, 24 lakh were added in census towns alone.
Of Delhi’s nine districts, north-west has seen the highest growth in population (22%) and is Delhi’s most populated district with over 36 lakh residents. Over 35% of the north-west lives in census towns. Saraswati Vihar in north-west Delhi has the highest population of any of the NCT’s 27 sub-divisions. Both New Delhi and central Delhi on the other hand have fewer residents than in 2001.
Population numbers at the ward level show that just four years after delimitation, the population of different wards varies wildly, from 1.5 lakh residents in Hastsal to just 15,000 in Kashmere Gate, which saw large-scale slum demolitions.
As The Times of India had reported earlier, Delhi has India’s lowest female workforce participation rate, with just 8.25 lakh women or roughly 10% reporting as workers. In contrast, there are 48 lakh male workers; over half of males across ages in the NCT report as workers. Seelampur reports the lowest female workforce participation of just over 5%. “We took a lot of steps to improve enumeration of women workers, but this is still what we have found. It’s really something we are worried about,” Joshi said. Over 95% of Delhi’s workers are ‘main workers’, meaning that they do economically productive work for over six months in the year. Connaught Place has the highest work participation rates for both men and women.
The proportion of scheduled castes in Delhi’s population has remained nearly constant at 16.75%.
Growth: Jobs, Economy Growing Faster Than National Average
TIMES NEWS NETWORK
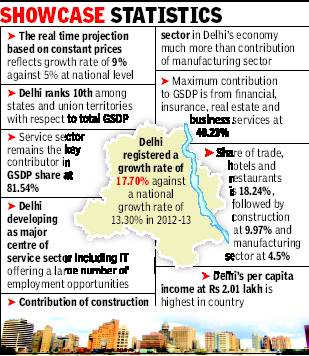
2013: Services once again accounted for the largest share (81.54%) of Delhi’s state gross domestic product (GSDP) in the previous financial year, according to the report “E s t i m a t e s o f S t a t e D o m e s t i c P r o d - u c t — 2 0 1 2 - 1 3 o f D e l h i ” compiled by the Directorate of Economics & Statistics .
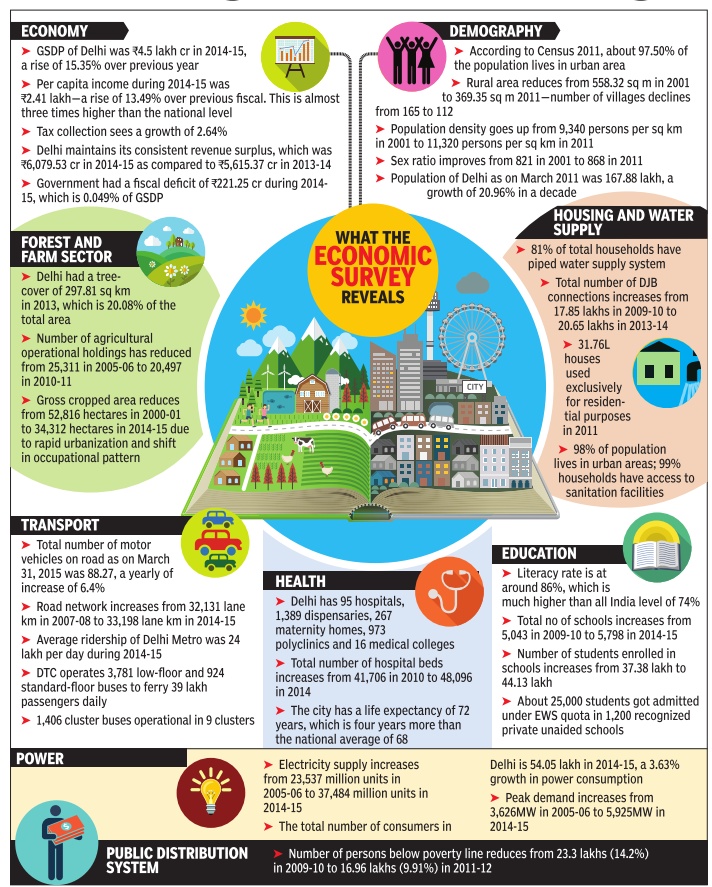
The report said Delhi has become the most attractive city for youths seeking work across the country, thanks to her government’s pragmatic economic policies. It added that the 17.7% growth in Delhi’s GSDP, compared to 13.3% at the national level, reflects the city’s economic health. After accounting for inflation, the growth amounts to 9%, compared to 5% at the national level. The report states that Delhi’s GSDP is the 10th largest in India.
The predominance of services in Delhi’s economy is in line with the city’s industrial policy that promotes non-polluting units. The secondary sector (industry) contributes 17.69% and the primary sector (agriculture) 0.77% of the GSDP, the report states.
Finance, insurance, real estate and business services make up 40.23% of the service pie, followed by trade, hotels and restaurants with 18.24%, and construction (9.97%). Large-scale construction across the city has increased the contribution of this sector.
The report states that the ratio of Delhi’s GSDP to the all-India GDP at both current and constant prices has increased steadily. Delhi contributes 3.87% of the national GDP with only 1.42% of the population. Since 1998-99, Delhi’s GSDP has risen from Rs 53,226 crore to Rs 3.65 lakh crore—an increase of 687% “during the last 14 years of the present government,” a statement from the CM’s office stated.
Per capita income in Delhi is Rs 2.01 lakh compared to Rs 1.73 lakh in 2011-12—an increase of 15.77%. It is three times the national average of Rs 68,747. Per capita income crossed the Rs 1 lakh mark in 2008-09, and increased to Rs 1.27 lakh in 2009-10. In 1998-99, it was only Rs 40,060.
Growth: per capita income
Delhi's per capita income highest in India: Report
PTI | Aug 31, 2013
NEW DELHI: Delhi's average per capita income, at more than Rs 2 lakh per year in 2012-13, is the highest in India, a official report said Saturday.
"The average per capita income in Delhi is nearly three times the estimate for the all India average. During the seven year period from 2005-06 to 2012-13, it grew at the rate of about seven percent per annum vis-a-vis around three percent for India," said the Delhi Human Development Report 2013.
"The sustained growth in per capita income has been associated with a reduction in poverty to single-digit figures to 9.9 percent in 2011-12 from approximately 13 percent in 2004-05," it added.
Labour and migration
According to the report, the tightening of the labour market has contributed to the lowering of poverty.
During 1999-2000 to 2011-12, an additional 1.3 million people were added to Delhi's workforce taking the total figure to 5.56 million.
Although, the rate of migration has stabilized in Delhi during the last decade, around 75,000 people still come to Delhi every year in search of a livelihood, said the report.
"The city has absorbed the migrants rather well, with the migrants rating themselves better than the non-migrants in terms of several indicators of well-being," it said.
While one third of the migrant population perceived that work opportunities in Delhi had improved over the last three years, two thirds of households considered their income to be stable.
Sex ratio in Delhi: 2011
In 2011 Delhi had a higher proportion of women in its population than it has had at any time in over a century. The sex ratio – number of females of all ages for every 1,000 males – was 868 in 2011, the first time that it has crossed 862, the previous highest set way back in 1901. This change has taken place despite no significant improvements in Delhi’s child sex ratio which stands at 871 girls for every 1,000 boys between the ages of 0 and 6. The figure for 2001 was only marginally lower at 868. There seemed to be more family migration taking place and fewer single male migrants, Varsha Joshi, director of census operations for Delhi, had said earlier. That could partly explain the dramatic improvement in the overall sex ratio between 2001, when it was 821, and 2011.
2014-15

2014-15
2007-15
Rise of wholesale pulses

The Times of India, Jun 25 2015
Neha Lalchandani
In 7 years, prices of pulses, oil & mutton nearly doubled
In the past seven years, the prices of many food items seem to have doubled in Delhi. The Economic Survey of Delhi for 2014-15 shows that pulses, oil and even mutton are now twice as costly . Interestingly, Delhi's consumer price index during 2014 at 223 was lesser than the national average of 247, indicating that inflation in Delhi since 2001 has actually been lower than in most other cities. The survey , however, shows that potato and onion have registered an insignificant rise in their wholesale price since 2007 onion has gone up from Rs 1,107 per quintal to Rs 1,200 per quintal while potato is up from Rs 685 per quintal to Rs 750 per quintal. Against this, the price of pulses has risen exponentially in the wholesale market and its impact has been felt more acutely in the retail market. Arhar has gone up from Rs 3,365 per quintal to Rs 6,400 per quintal while price of moong has risen from Rs 3,784 per quintal to Rs 6,550 per quintal.
“Barring seasonal fluctuations in some commodities like onion, potato and wheat due to decline in arrivals, inclement weather in the major producing areas, transportation bottlenecks, increase in cost of movement and lower stocks the retail prices of most essential commodities have exhibited a steady trend in all metro cities in India.“ It has attributed the rise in prices to low production, market inefficiencies, wastage due to inadequate storage facilities etc.
In the case of pulses, Naresh Gupta, president of the grain merchants association, says a change in the minimum supply price has been instrumental in the sharp rise in prices, but more importantly , a shortage in supply is responsible for the rise in the price of grains. “Moong is the major crop grown in India but the rest is largely imported.The dollar exchange rate has also gone up significantly in he past 10 years. When we have been unable to meet demand, the prices will, of course, rise,“ he said.

