Corporations, corporate performance: India

This is a collection of articles archived for the excellence of their content. |
Contents |
Corporate debt
2016/ debt-to-GDP ratio is 55%
Corporate debt in emerging market economies including India, which used to average at 49% GDP nearly a decade ago, has now risen to 55% of the GDP , according to a latest RBI report.
India stands at the seventh place when measuring its government debt-to-GDP ratio -far behind countries such as China, Indonesia and Malaysia. The report also sheds light on how the system could be setting itself up for more cases of wilful defaulters like the now defunct Kingfisher Airlines. In a study of firms with more than $1-billion assets over 19 years, it was found that bigger corporates tend to be more leveraged post a crisis, compared to smaller firms.
Why it matters? In December, the RBI, in its fifth bimonthly policy statement, held rates for the first time in 2016, given the excess liquidity entering the system post-demonetisation. From some qu arters, the low-interest rate regime was hailed as the right time for pushing more loans to consumers, but the latest RBI report cautions against such a move. Titled, `Corporate Leverage in EMEs: Has the Global Financial Crisis Changed the Determinants?', the report draws parallels to the 2008 financial crisis.
“The post crisis period was characterised by abundant global liquidity and search for yield, which possibly resulted in lenient creditscore evaluations and leverage built-up. It is also possible that these firms with low profit took advantage of their possible future upturn and borrowed cheaply from debt markets,“ said the report.
Given the RBI's successive interest rates and current neutral stance, it is possible that we are on the cusp of a change in the policy rate cycle. And its at this juncture, the reports warns that lenders need to exercise more prudence.
Sector-wise performance
2010-14
HIGH-GROWTH RIDE - Auto, Pharma top wealth creators in 4 years
The Times of India, Jan 01 2015


Partha Sinha & Shubham Mukherjee
Realty, infra cos saw biggest value erosion since the 2010 highs as the economy went through a turmoil and the markets stagnated before rebounding to new peaks in 2014
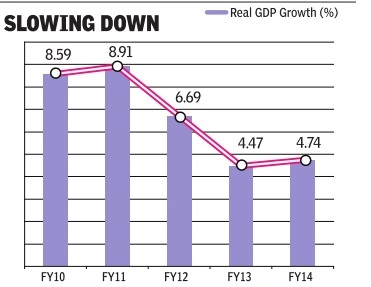
Just over four years ago, the Indian economy was cruising at a near 9% annual rate of growth and on Di wali day in 2010, the sensex scaled a new high, closing above the 21,000 mark for the first time ever.However, since then as inflation rates spiked and interest rates spiralled, the government entered a phase of prolonged policy paralysis with the growth nearly halving to about 4.5% within two years. Rupee depreciation and widening current account deficit added to the negativity and it has since been a phase of almost flat GDP growth with muted corporate performance.
But a focused group of companies braved the headwinds and posted handsome returns for anyone who had invested in them, reveals a TOI-commissioned study done by Motilal Oswal Securities (See `Top Of The Charts' table). Significantly, most of these companies are not even leaders in the respective industries they operate in.Incidentally , the sectors that created wealth such as healthcare, consumer, automobiles, private sector banks and retail are all consumer-facing.
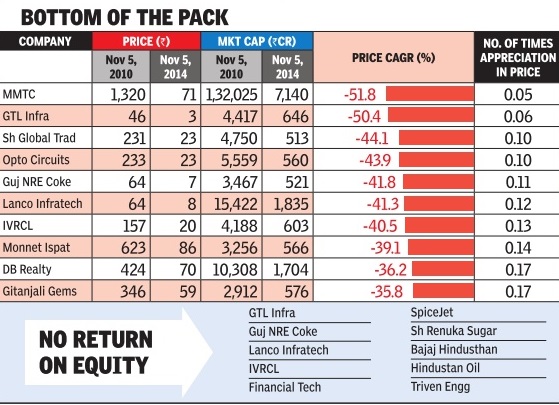
Topping the list of these outliers is Eicher Motors, makers of Royal Enfield bikes, with an eye-popping stock rise of about nine times in just four years. The stock rose from Rs 1,410 in early November 2010 to Rs 12,849 on this Diwali day . On the flip side, the biggest loser is MMTC with a current market capitalization of just about 5% of the value four years ago. So if you had invested Rs 100 in MMTC four years ago, you would be left with just Rs 5.
When contacted by TOI, Siddhartha Lal, MD & CEO, Eicher Motors, credited his performance to a differentiated product offering, providing a seamless chain between production to retail and an unrelenting focus on the two product lines motorcycles and commercial vehicles. “We are committed to the investor community and our longterm focus may have added to this (performance),“ he said.
Six of the top-20 wealth creators Eicher Motors, Motherson Sumi, TVS Motor, MRF , Wabco India and Apollo Tyres belong to automobiles. Consumer (Berger Paints, Bata India and Britannia), healthcare (Aurobindo Pharma, Sun Pharma and Torrent Pharma), and technology (Mindtree, HCL Technologies and Tech Mahindra) have contributed three companies each to the top-20 wealth creators' list. Besides, there are two NBFCs (Sundaram Finance and Bajaj Finance), a cement company (Shree Cement), a capital goods company (Havells India), and a Logistics company (Blue Dart Express).
Rajat Rajgarhia, MD, institutional equities, Motilal Oswal Securities, puts the findings of the study in perspective. “ Any time is the right time to buy stocks; the art lies in stock-picking. Even during the last four years, when the market indices have gone nowhere, numerous stocks have multiplied several times. On the flip side, hordes of stocks are now available at small fractions of their value four years ago,“ he said.
In contrast to the stocks that have grown investors' wealth multiple times, some of the worst performers have lost up to 95% of their value during this period, while a large number have witnessed around 75% value erosion (See `Bottom Of The Pile' table). All the stocks in the list of top-20 wealth destroyers have erased at wealth destroyers have erased at least 75% of their market capitali zation during the four-year period.
Some of the top laggards are from sectors which have been in a secular downturn for the past few years like power, real estate, infra structure and sugar. Companies like Shree Renuka Sugars, Bajaj Hindustan, JP Power Ventures, etc belong to this group.Metal companies like MMTC, Monnet Ispat and Hindustan Copper are in a cyclical downturn. There's a third group, consisting of companies which got into major controversies and faced regulatory scrutiny . DB Realty , Financial Technologies and Bhusan Steel belong to the third group.
Eight sectors outperformed the CNX Nifty over the four-year period: healthcare, consumer, automobiles, cement, technology , private sector banks, retail, and textiles (see `Best Sectors' table). All other sectors chemicals & fertilizers, NBFCs, telecom, oil & gas, capital goods, media, public sector banks, utilities, metals, real estate, and miscellaneous underperformed. A total of 12 sectors healthcare, consumer, automobiles, cement, technology , private sector banks, retail, textiles, chemicals & fertilizers, NBFCs, telecom, and oil & gas delivered positive returns. Seven sectors capital goods, media, public sector banks, utilities, metals, real estate, and miscellaneous delivered negative returns. The performance of the technology and healthcare sectors has been favourably impacted by a weakening rupee. Most of the sectors that destroyed wealth including real estate, metals, utilities, infrastructure, public sector banks, and capital goods are deeply cyclical and were affected by policy paralysis during the UPA-2 regime.