Air pollution: India
This is a collection of articles archived for the excellence of their content. |
Acid rain
2001-2012: pH levels between 4.77- 5.32
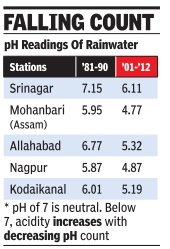
Pollution is causing `life-giving' rain to turn increasingly acidic in many parts of the country , particularly in the last decade, research by India Meteorological Department and Indian Institute of Tropical Meteorology has revealed.
Analysis of rainwater samples from Nagpur, Mohanbari (in Assam), Allahabad, Visakhapatnam and Kodaikanal in the decade 2001-2012 shows a pH level varying between and 4.77 to 5.32, indicating that these places have actually been receiving `acid rain'.
Rainwater with pH below 5.65 is considered acidic.
Potential of hydrogen, or pH, is a scale to measure acidity or alkalinity of a solution, where 7 is `neutral'. For lesser values, acidity increases with decreasing count.
Acid rain is a result of rain water in the atmosphere mixing with polluting gases such as oxides of sulphur and nitrogen emitted from power plants, automobiles and some industrial units.
Acid rain can reduce soil nutrition, corrode buildings (such as Taj Mahal), kill aquatic life and increase heavy metal concentration in soil and water, impacting human health. Acid rain causes leaching of soil nutrients, which means that these nutrients are not available to plants and crops grown in the soil, affecting productivity . Acid rain has had a corrosive effect on monuments,“ experts said.
Acid rain can also dissolve salts of heavy metals found in rocks and soil. These heavy metals then find their way into agriculture fields, water sources and ultimately human physiologies. According to the study by scientists V Vizaya Bhaskar and P S P Rao, which was published in the Journal of Atmospheric Chemistry , almost all global atmosphere watch (GAW) stations in India showed a decreasing trend in pH levels with each passing decade during the period of analysis (1981to 2012).
Carbon emissions
India and the world: 2020

From: February 12, 2021: The Times of India
See graphic:
Carbon emissions in India and the world: 2020
Causes, principal
Some experts' views
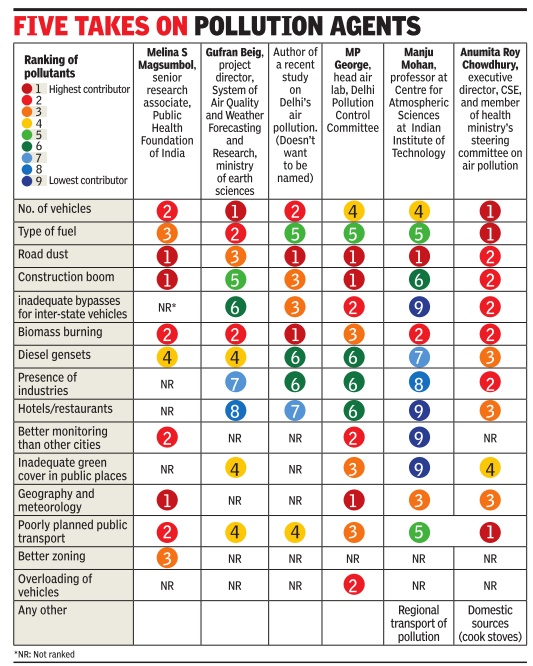
See graphic:
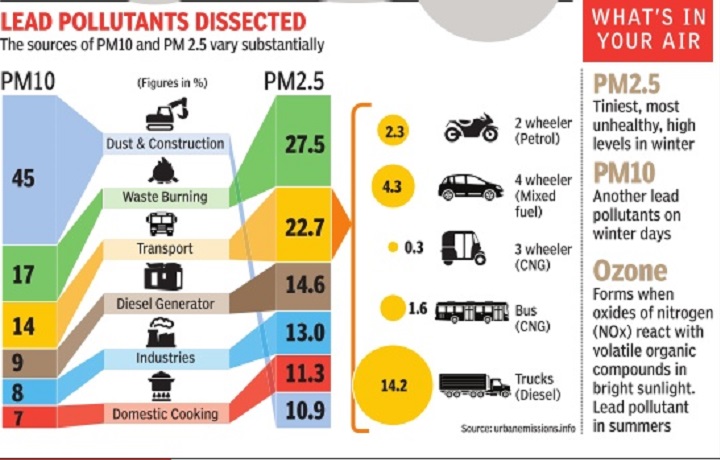
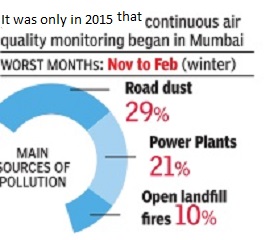
What contributes most to air pollution in India.
How the weather makes air foul or fair
Amit Bhattacharya, Nov 21, 2019: The Times of India
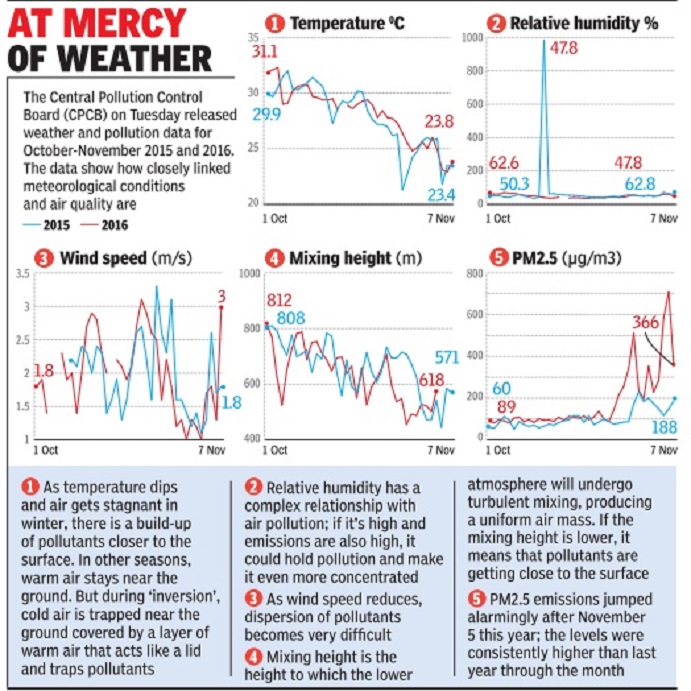
NEW DELHI: This month, Delhi-NCR has seen dramatic variation in pollution levels, suffering noxious smog one day and enjoying crisp sunshine just 24 hours later. Clearly, even though pollution is mainly a by-product of fossil fuel emissions and other human activities, weather determines air quality on any given day more than any other factor. TOI explains how the interplay of key weather variables decide the quality of the air you breathe. One thing is for certain though, the factors controlling the weather won’t change. The only way to bring down pollution is to reduce fossil fuel emissions, biomass burning and control dust.
1. WIND SPEED
Pollutants tend to pile up in calm conditions, when wind speeds are not more than about 10kmph. Speeds of 15kmph or more favour dispersal of pollutants, which, literally, clears the air. Winds of up to 35kmph brought AQI down from 458 (‘severe’) on November 15 to 215 (‘poor’) in less than 48 hours in Delhi.
2. WIND DIRECTION
Which way the wind blows is as important as the speed. In stubble burning season, northwesterly winds of moderate speeds transport smoke from farm fires in Punjab and Haryana to NCR and beyond. In December-January, easterly winds can push pollutants from IndoGangetic plains to NCR .
3. TEMPERATURE
Hot air rises while cold air stays close to the ground. This is why pollution in north India peaks in winter. And also why nights are generally fouler than days. Temperatures are the key determinant of ‘mixing height’ — which is the depth of the layer of air closest to the ground within which pollutants and aerosols move. In cold conditions, pollutants are trapped close to the ground because of low mixing height. 4. CLOUDINESS In general, overcast skies lead to cool days and low mixing heights while sunny days have the opposite effect. Most smog episodes in NCR this month coincided with cloudy skies. Low clouds increase humidity, which can lead to fog formation.
5. RAIN/HUMIDITY
Rain washes away pollutants and can quickly clean the air. However, wet spells leave behind high humidity, which can lead to fog under calm winds. Fog increases pollution as water droplets act as secondary particles interacting with pollutants. On November 2, very light rain (0.5mm) in Delhi led to thick smog the next day, sending AQI shooting up to 494. It was the second worst pollution episode in Delhi since 2015.
6. WESTERN DISTURBANCE
Western Disturbances are pulses of west moving low pressure originating close to the Mediterranean. Usually bring cool, moist winds that strike the Himalayas, often resulting in rain/snow. When a Western Disturbance nears the region, wind speeds decrease over the plains, leading to build-up of pollution. As Western Disturbance moves east away from NCR, strong westerly winds sweep through cleaning up the foul air. All smog spells this month coincided with Western Disturbances.
2018: Arab dust made Gurgaon, NCR India’s worst
Shilpy Arora, August 6, 2018: The Times of India
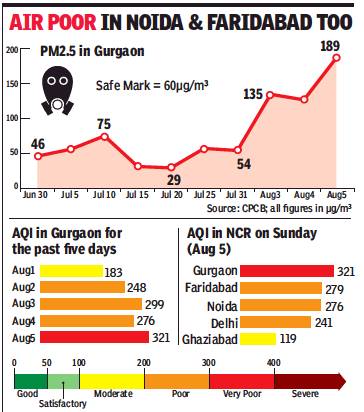
From: Shilpy Arora, August 6, 2018: The Times of India
The city, which has been NCR’s most polluted for the past three days, Central Pollution Control Board (CPCB) declared Gurgaon as the most polluted among the country’s 62 cities measured, with AQI crossing the 300 mark.
With AQI hovering between ‘poor’ and ‘very poor’ categories, Gurgaon is witnessing air quality this poor after a month. On Sunday, AQI was 321 (‘Very Poor’), compared to other NCR cities — Delhi, Faridabad, Ghaziabad, Noida and Greater Noida at 241 (Poor), 279 (Poor), 119 (Moderate), 276 (Poor) and 232 (Poor), respectively. On Saturday and Friday, the city had recorded AQI at 276 and 299 (both ‘Poor’), respectively.
For the past month, the level of PM2.5 has been below 80 micrograms per cubic metre (µg/m3 ). Peak PM2.5 on Sunday was 189µg/m3 , compared to 127 and 135 on Saturday and Friday, respectively. The permissible limit for PM2.5 is 60µg/m3 .
While authorities blamed it on a dust storm from the Arabian peninsula, environmentalists blamed authorities for not implementing GRAP (graded response action plan) until now. “A dust storm in the Arabian peninsula has led to an increase in atmospheric dust in Delhi and NCR since Thursday. The dust storm started in Oman on July 27. The dust entered the Arabian Sea over next few days, before reaching northwest India and Delhi-NCR. It generally takes 2-3 days for the dust to reach Delhi-NCR, depending on wind speed and other parameters. There are hardly any local factors responsible for a spike in particulate matter in the city,” said an official of Haryana State Pollution Control Board (HSPCB).
Dipnakar Saha, former head of air laboratory division at CPCB, told TOI, “Gurgaon is worst-affected as it lies to the west of Delhi and the dust is blowing from a northwestern direction. Humidity levels in Delhi and NCR are high, so particulate matter gets stuck to moisture in air. Til there is a strong wind and rain, the situation might prevail in the region. However, we can’t ignore local factors that add to pollution.” The Met department expects showers on Monday that could bring down AQI levels.
2020: cooking fuel, agriculture, natural sources
Chandra Bhushan, September 26, 2020: The Times of India
The writer is CEO, International Forum for Environment, Sustainability and Technology (iFOREST)
By focussing on cities and vehicles, we have been barking up the wrong tree on air pollution
Chandra Bhushan
1) ‘National Ambient Air Quality Status & Trends 2019’, which contains air quality data for 344 cities/ towns from 28 states and 6 UTs. This is the only report that gives a snapshot of the status of air pollution in the country.
2) ‘Impact of the Lockdown on Ambient Air Quality’. This report compares data for 12 cities from different parts of the country, including Delhi and NCR towns, during the lockdown phases with the corresponding periods in 2019. The report also estimates the various sources on air pollution in Delhi by chemically analysing PM2.5 (particles less than 2.5 microns in size or fine particles) in different phases of lockdown. Furthermore, it measured PM2.5 concentrations using satellite to estimate the air quality improvement over the entire country.
Here are the major findings of these two reports: India has predominantly a PM10 problem: Most cities are exceeding the National Ambient Air Quality Standards (NAAQS) for PM10 (particles less than 10 microns in size or coarse particles). About 78% of the cities exceeded PM10 standards compared to 36% for PM2.5, 9% for NO2 and none for SO2.
We are not winning the air pollution battle: The data for the last few years show that while the SO2 concentration has decreased and NO2 concentration has remained stable, the PM2.5 levels have increased and PM10 levels have remained very high and are fluctuating. So, the two problem parameters – PM2.5 and PM10 – are not showing any sign of abating. In fact, PM2.5 levels have increased significantly in the last three years.
The CPCB report also lays to rest the controversy about air quality improvements in Delhi. PM2.5 levels in Delhi have consistently increased in the last 3 years and were 144 micrograms per cubic meters (μg/m3) in 2019 – more than three times the standard. The baseline pollution level in India is high: During the peak lockdown (March 25-April 19 2020 ), ground based monitoring stations in 12 cities recorded average PM2.5 levels of 25-50 μg/m3 and PM10 levels of 50-110 μg/m3. The satellite recorded PM2.5 levels in different parts of the country as 29-76 μg/m3, with an all-India average of 59 μg/m3. These levels are double the WHO standards and almost the same as NAAQS.
So, when transportation and industries were down by 80%, coal power plants were operating at 40% capacity, and people were largely indoors, even in relatively less polluting months of March-April, the country was barely meeting NAAQS. This indicates that pollution from cooking fuel, agriculture and natural sources are sufficient to breach air quality norms in large parts of the country.
An interesting fact the report captures is that during the [2020] lockdown in Delhi, the ratio of PM2.5 to PM10 was higher than in 2019. This is contrary to the general understanding; one would have expected lower ratio during the lockdown because factories and vehicles were not operating. The only plausible reason seems to be that we have been underestimating the contribution of PM2.5 from cooking fuel and natural sources.
If we join the dots, what emerges is that controlling PM10 emissions is key to solving the air pollution crisis. This would mean reducing the burning of solid fuels like biomass and coal and controlling emissions from land and agriculture. But by mainly focussing on cities and vehicles, we have lost the plot on air pollution. I will discuss this in detail in my next column.
The writer is CEO, International Forum for Environment, Sustainability and Technology (iFOREST)
City-wise
Most cities do not meet national air quality standards

Since 2011, at least 94 Indian cities have not met national air quality standards
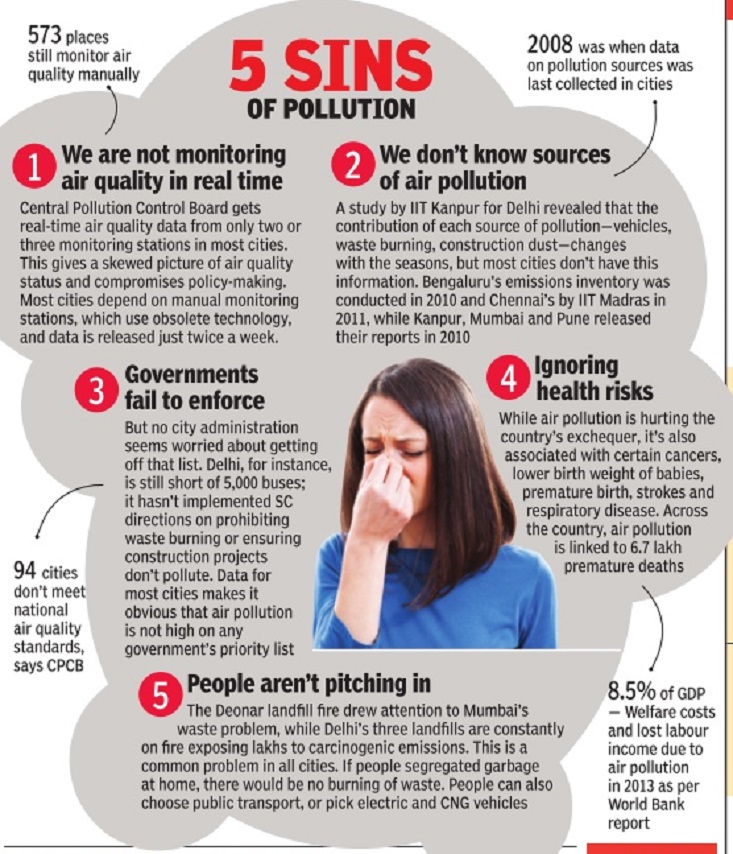
The Times of India
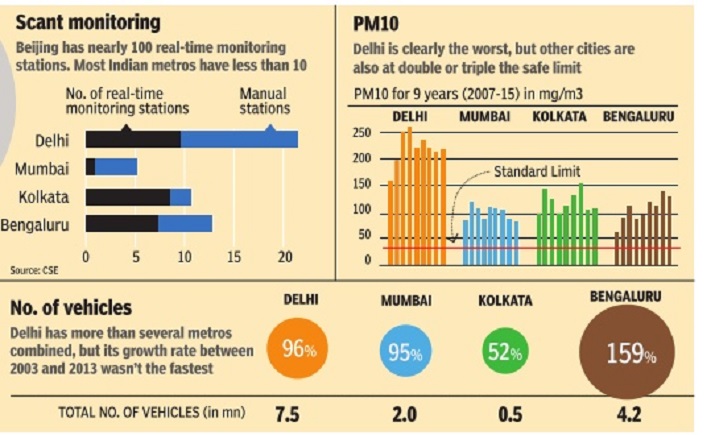
i) The monitoring of air pollution,
ii) PM10 particles in the air, 2007-15,
iii) Total number of vehicles in the city and the growth in the number of vehicles, 2003-13
The Times of India
Jayashree Nandi, Delhi Today, Your City Tomorrow. Nov 06 2016 : The Times of India
94 Cities Haven't Met Air Quality Standards In 5 Years
There's something the hillside retreat of Parwanoo in Himachal Pradesh has in common with the industrial town of Korba in Chhattisgarh--both have consistently recorded higher than acceptable particulate matter (PM) levels.
Since 2011, at least 94 Indian cities have not met national air quality standards. Many of these cities have been on the list from the 1990s, say officials of the Central Pollution Control Board (CPCB).Neither the Centre nor the states have put in place a plan to ensure that cities get taken off this list.The World Health Organisation's recent urban air quality database lists 10 Indian cities among the world's 20 worst polluted. But that doesn't seem to worry the CPCB or administrators either.
For the past couple of years when air pollution in Delhi, Kanpur, Lucknow and Varanasi touched dangerous levels, CPCB did nothing to ensure that its directions on meeting air quality standards were en forced. It also ignored its own studies, commissioned from Chittaranjan National Cancer Institute in 2003, on the impact of air pollution on children over 15 years, which found serious physical and psychological impacts.
The Centre has made only one major decision this year to tackle air pollution--notifying BSVI emission standards for vehicles manufactured after April 2020, which will bring down particulate emissions from vehicles by 60%-80%. The National Air Quality Standard notification, 2009, says safe standards for air should be met 98% of the year, a criterion none of the cities monitored by CPCB meet.Dipankar Saha, additional director, air laboratory at CPCB said: “This is not relevant anymore since we have started real-time monitoring of cities. We alert the nonattaining cities every three years.“
But CPCB only monitors 29 cities real time and has just one continuous air quality monitor at most locations.The rest are manual monitoring machines which are “highly inefficient“ and at times “inaccurate“, say experts.
“Only when there is pressure from the people and the judiciary, cities start acting on pollution. There is no national policy. Even the government's smart city project only makes a passing reference to air quality but doesn't make it binding on cities to meet this criteria,“ says Anumita Roy Chowdhury, head of Centre for Science and Environment's clean air programme. CPCB's air quality bulletins routinely show Faridabad, Agra, Kanpur and Lucknow in “severe“ or “very poor“ categories.
This month for the first time CPCB used its statutory powers to direct municipalities in NCR to take steps to curb air pollution. “The air act gives us statutory powers to issue closure orders or cut electricity or water supply to industries that do not meet norms but it doesn't give us powers to penalize municipalities. So our directions are not binding on them,“ said Saha. In this situation, he is not sure how air quality standards will be met in cities.
“CPCB and state pollution boards have the power to take immediate action,“ insists Kanchi Kohli of Namati Environmental Justice Programme. “They can hold municipalities accountable if they want to.“
DELHI IS THE MOST POLLUTED, BUT OTHER METROS AREN'T GETTING BETTER Nov 06 2016 : The Times of India
Emission levels in 14 major cities
2017
From: Vishwa Mohan, Delhi fares worst on emission levels, fuel use – or does it?, August 25, 2018: The Times of India
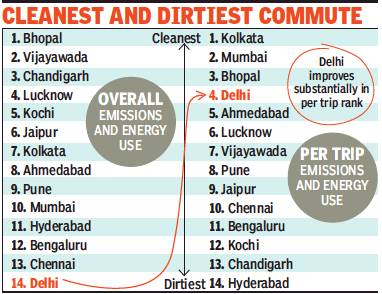
City Goes Up 10 Ranks On Per Trip Basis
Emission levels are the least in Bhopal (Madhya Pradesh) which also guzzles the lowest amount of fuel for urban commute while Delhi is the worst on both these parameters among 14 Indian cities assessed and ranked by Delhi-based thinktank Centre for Science and Environment (CSE).
In its study on the cleanliness aspect of urban mobility in these cities, the CSE has found that though Kolkata and Mumbai figured at seventh and 10th positions, respectively, in terms of overall emissions and energy consumption, these two cities emit the least among six mega cities due to high usage of public transport and walking.
The thinktank selected the 14 cities for its study as these are among the most populous in different regions and can be used as better indicators in the race for clean and low carbon mobility.
The study groups six of them — Delhi, Mumbai, Kolkata, Chennai, Bengaluru and Hyderabad — as “mega cities” while the remaining eight are clubbed as metropolitan cities.
The overall analysis was done on the basis of the combined score on total emissions of heat-trapping carbon dioxide and toxic pollutants like particulate matter and nitrogen oxides, as well as energy-guzzling from urban commuting practices.
Kolkata figured at the top among the mega cities for the lowest level of emissions and energy consumption, banking on its “public transport culture, compact city design, high street density, short travel distances and restricted availability of land for roads and parking”.
‘Delhi PM emission 3 times more than that of Mumbai’
Despite having the thirdhighest share of public transport trips, Delhi came at the bottom as overall emissions and fuel use are the highest due to the sheer number of personal vehicles, high volume of travel and long trip distances.
“This negates per-trip emissions improvement derived from its CNG programme and limited public transport strategy,” said CSE’s report, “The Urban Commute”, which was released in Kolkata on Friday.
Delhi has the highest vehicle stock among these cities. As a result, Delhi emits PM five times more than Kolkata and three times more than Mumbai. Besides, its poor rank is an effect of its relatively higher population compared to other mega cities.
The thinktank in its study analysed level of motorisation, travel demand based on population, share of different modes of transport (public transport, walking, cycling and personal vehicles), average length of daily travel trips and quality of vehicle technologies and fuels to come at its findings.
“This review has become necessary as greenhouse gas emissions from transport — though the thirdhighest currently among all sectors — has recorded the steepest increase. This is also responsible for health-damaging toxic exposure,” said Anumita Roychowdhury, executive director (research and advocacy), CSE.
The report attributed the increase in greenhouse gas emission from transport to massive motorisation in the past few years. It noted that it took 57 years (1951-2008) for India to cross the mark of 105 million registered vehicles. But thereafter, the same number was added in a mere six years (2009-15). Bengaluru, Hyderabad and Chennai score poorly as they have a lower share of public transport compared to Delhi.
2022, Dec
From: Himanshi Dhawan, Dec 13, 2022: The Times of India
See graphic:
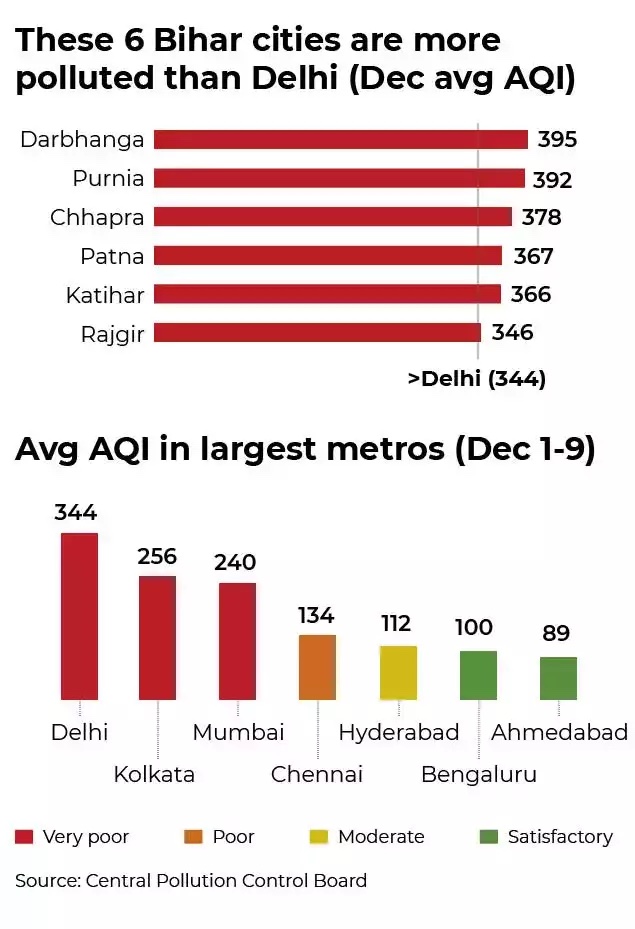
Air pollution in some of the worst affected Indian cities, as in December 2022
BENGALURU
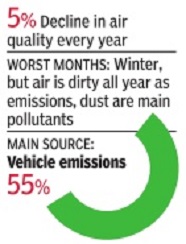
An unusual combination of a long weekend a dispute over sharing water keeping out fireworks from Tamil Nadu, and activism meant Bengaluru had slightly cleaner air this Di wali compared to previous years. But that's no indication of overall air quality in the city . The annual average increase in levels of respirable suspended particulate matter in the last five years is 5%, according to the Karnataka State Pollu tion Control Board The increasing pollution is in step with the rising number of vehicles: 8% every year. While vehicle emissions are the main source, road and construc tion dust and burning of garbage also contribute “In fact, the air we breathe in Bengaluru is clean only during bandh days,“ says Lakshman, chair man, KSPCB. The problem is the lack of coordinated efforts by various civic agencies.While KSPCB monitors air quality and churns out data, its power stops at issuing notices to various agencies. State governments have failed to set out an action plan to tackle air pollution. Transport department officials said they try to detect pollut ing vehicles. “We have random checks to fine those without pollution under control certificates. It isn't easy as we are short staffed,“ said an official.
--Rohith BR & Aditi Sequeira
CHENNAI
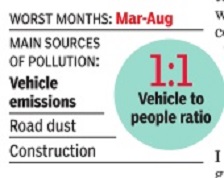
In humid Chennai's `winter' months of No vember and December, doctors' clinics fill up with patients with respiratory illnesses.The numbers are far lower during in March to August, but those are the months when the PM10 count goes up to 200mcg per cubic metre. Winter may get people coughing, but it's in summer that the air is dirtier. Vehicular emissions, road dust and construction activity (including eight years of work on the Chennai Metro Rail) are major air pollutants. The ratio of people to vehicles is almost 1:1 in Chennai, says Tamil Nadu Pollution Control Board lab director Dr K Rangana than. TNPCB works with the corporation and transport de partment to keep pollu tion in check.
“Chennai's air is clean. Improving g reen cover could further bring down pollution levels,“ says Ranganathan. Air quality at Adyar, a busy residential and commercial locality within easy access of the beach, is the best in the city. It records PM10 count as low as 20mcg per cubic metre--but that could also be because the monitoring device is located at the green Periyar Science and Technology Centre, beside the lush IIT-M campus.
--Abdullah Nurullah
Indo-Gangetic plains
Jasjeev Gandhiok, Nov 19, 2019: The Times of India
From: Jasjeev Gandhiok, Nov 19, 2019: The Times of India
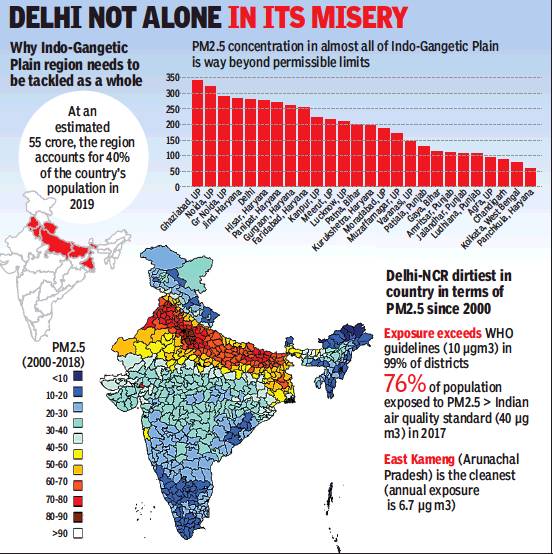
With two smog episodes already this month, Delhi has been in the news for all the wrong reasons. However, the national capital is not alone in its misery — Ghaziabad, Noida, Greater Noida and Jind have fared worse in the last two weeks (November 1-15). In fact, the problem is spread across the Indo-Gangetic Plain (IGP) region and experts say an airshed approach is required to tackle the problem if the NCAP target of a 25% reduction in PM2.5 levels by 2024 has to be met.
At a discussion organised by Climate Trends, a Delhi-based communications initiative, experts and pollution control boards sought better cooperation among states and greater focus on smaller towns where higher emissions may be going undetected. “The problem of high pollution in Delhi was not as prevalent in the winters a decade ago because background emissions from neighbouring towns and cities were not that high. This has, however, grown a lot and is going unchecked. One needs to treat the entire Indo-Gangetic Plain as one expansive area; plans need to be in place for not just one city alone,” Dr Sagnik Dey, associate professor at IIT-Delhi and coordinator for the Centre for Excellence for Research for Clean Air, said.
Dey said there were gaps in data that were not allowing comprehensive action to be taken on the ground. “We live in the age of data and, yet, there is no air pollution figures for the entire rural India. To address the problem of air pollution comprehensively, we need to delineate ‘airsheds’ based on wind flows in the regions and their pollutant reach. While city action plans have been submitted, these should be integrated with the larger airshed management strategy to make an effective plan,” Dey said.
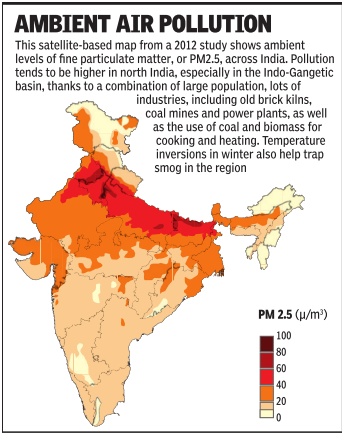
A 2012 study by IIT-Delhi mapped the aerosol transfer across Indo-Gangetic belt, finding it to be world’s most polluted hotspot — stretching from Punjab, Haryana, Delhi, UP and Bihar to all the way to West Bengal. Experts say the entire belt has a complex set of topographical and meteorological conditions that produce a landlocked valley effect.
Data analysed by Urban Sciences across 26 cities in Indo-Gangetic Plain from November 1-15 showed Ghaziabad to be the most polluted. There were five cities from Haryana too that experts say are missing from the NCAP list of 102+20 cities. Ronak Sutaria, CEO at Urban Sciences says there’s a need to scale up monitoring across the region. Dr Ravindra Khaiwal, additional professor, School of Public Health, PGIMER Chandigarh, suggested incentivising people to cut down on pollution levels.
KOLKATA
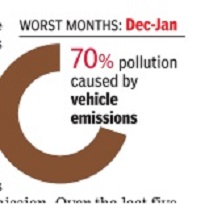
Last week, after Diwali the PM 10 count in Kolkata was 10 times the permissible limit, and though it dropped, it remained at 3.5 times above normal for the next four nights. Every year, pollution peaks after the festival, though the worst months are December and January . The administration has been taking sporadic steps to check pollution. For instance, use of adulterated fuel by autorickshaws, a major source of pollution, was banned. Automatic pollution recording stations have been set up, but monitoring and implementation of norms remain lax.Automatic recording stations often do not work. The three major causes of pollution are vehicle emission, construction dust and industrial emission. Over the last five years, a number of industrial units have been forced to move out of Kolkata or adopt less-polluting methods. Many have switched from coal to LPG. Pollution from construction dust remains a threat since Kolkata is expanding fast and construction activity is on the rise.
--Prithvijit Mitra
Mumbai
See also Air pollution: Mumbai
Mumbai's a coastal city isn't always able to counter the pollutants in the air. On several days in the year, air quality drops into the poor category , and experts say more monitoring and data is needed to ensure it doesn't go the Delhi way. Not all existing monitoring stations are able to give us the right picture because they don't meet the required standards. Having access to data and using it to take precautionary measures is important,“ says Neha Parkhi of Indian Institute of Tropical Meteorology. Local governments claim to have recognized air pollution as a major problem. “Some of the major sources of pollution are smoke from bakeries and burning garbage,“ says Vinayak Karnik, deputy chief engineer, Brihanmumbai Municipal Corporation environment department. The corporation issues an environment status report every August. In its recent report (2015-2016), BMC said the total number of vehicles in the city rose from 25 lakh in 2015 to 27 lakh in 2016, he says. –
--Vinamrata Borwankar
Varanasi, Allahabad, Gwalior/ 2015
The Times of India, Dec 13 2016
Jayashree Nandi
Varanasi, Allahabad had no clean air day in 2015
People in Varanasi, Allahabad and Gwalior did not have a single “good air“ day throughout 2015, making these cities worse than Delhi, at least in terms of lack of clean air, according to Central Pollution Control Board (CPCB) data. By contrast, Delhi saw 24 clean air days last year, when PM2.5 concentrations were below 30 mgm3.
The figures were quoted in “Varanasi Chokes“, a report released in Varanasi on Monday that delves deeper into PM Modi's constituency where the air pollution crisis is severe and monitoring lax. The report was presented by IndiaSpend, Centre for Environment and Energy Development and Care4Air at a workshop in the holy city .
Air pollution data for Varanasi and Allahabad were available for 227 and 263 days, respectively , during 2015. Average PM10 (coarse pollution particles) levels in Varanasi have increased steadily between 2010 and 2016.
The report is also being used by civil society organisations to demand action on air pollution and make it an agenda for political parties in the upcoming UP election.
Varanasi has only three air quality monitoring stations with just one online monitoring station that monitors both PM10 and PM2.5. In comparison, Delhi has 13 continuous air quality monitoring stations.
Data for four weeks between October 2015 and November 2015 for Varanasi showed the city's average PM2.5 (fine, respirable pollution particles) levels were at least two to three times the national safe standard of 60 micrograms per cubic metres. Abysmal air quality monitoring infrastructure in these cities is also responsible for lack of focus on controlling emissions in the region, experts said.
The scientists who participated in Monday's conference said that emission sources in the Indo-Gangetic plains had increased massively , contributing to the problem. “There is satellite data to show how aerosol optical depth (pollution particles) has increased rapidly in the last decade in the region. We need tighter emission standards for industries and other sources to control this,“ said S N Tripathi of department of civil engineering at IIT Kanpur.
He added that PM1 (particles of less than 1 micron diameter or superfine particles) levels were nearly as high as PM2.5 emissions around Kanpur. “The sources of PM1emissions are similar to PM2.5 emission sourc es -vehicles, industries, biomass burning and others.“
Tripathi's research team has found PM1 24-hour average to be as high as 300 micrograms per cubic metres, five times the PM2.5 safe standard in Kanpur during winter. The sources of emissions were varied and complex because scientists are seeing the share of secondary particles which are formed from chemical reactions between gases such as sulphur dioxide (SO2) and oxides of nitrogen (NOx) are also very high. Tripathi's findings are significant because PM1 particles can travel to the deepest area of the lungs, pass through the cell membranes of the alveoli, enter the bloodstream, damage the inner walls of arteries.
The report also quotes testimonies of doctors and patients from Varanasi who say there is several-fold rise in health conditions associated with air and water pollution.
2015: improvement, status quo and deterioration in different cities
The Times of India, Jun 02 2016
Jayashree Nandi
Some good news, some bad for 15 major cities on air quality front
A Central Pollution Control Board (CPCB) report on air quality in 15 cities shows that most cities are breaching the national annual safe standard.
While some are seeing a rising trend and some, interestingly, are also showing a decreasing trend in PM 10 (coarse pollution particles) levels, the study also shows that most cities saw an improvement in 2015 compared to previous years. The CPCB concludes in its report that improvement could be linked to implementation of stricter vehicle norms and better fuel quality.
The report was compiled by the CPCB after the NGT in its February 9 order directed it to file an “analysis report“ on pollution levels in all major cities identified by the tribunal.The report is also one of the documents on the basis of which the NGT is spearheading the efforts to reduce pollution in other major cities while an air pollution case pertaining to the Capital is being heard in the Supreme Court.
The NGT asked for more air pollution data from states on Wednesday with details of major sources so that it can come up with effective solutions. The report, which com piles pollution levels from manual monitoring stations in 15 cities, shows that PM 10 levels seem to be falling in Mumbai, Pune, Ludhiana, Amritsar, Chennai while in Lucknow they are stabilising.
There are no clear trends in Bengaluru, Jalandhar, Al lahabad, Kanpur and Kolkata, but PM levels are seen increasing in Hyderabad and Varanasi. “The reason for decrease in PM 10 levels may be implementation of stricter vehicle norms (BS IV),“ the study claims. “The fluctuating trends in some cities co uld be because of vehicles, diesel gen sets, small scale industries, biomass incineration, resuspension of traffic dust and others,“ it said.
Experts, however, said the report is inadequate as it doesn't correlate PM 10 levels with vehicle numbers, establishment of new industries, introduction of cleaner fuels and other interventions.They also pointed that PM 10 is not an effective indicator for pollution caused by combustion sources like vehicles or waste burning. The CPCB should have provided with PM 2.5 data (fine, respirable pollution particles) to give a clearer picture.
BS IV was introduced in NCR, Mumbai, Kolkata, Chennai, Bengaluru, Hyderabad, Ahmedabad, Pune, Surat, Kanpur, Lucknow, Sholapur, Jamshedpur and Agra in 2010.The gradual PM 10 rise in Varanasi could be because it is still on BS III but experts said improvements in Ludhiana, Amritsar or Nagpur cannot be due to better fuel norms.
2015/ 2016: Greenpeace study of 280 cities
See graphic:
Cities, most and least polluted, 2015-16
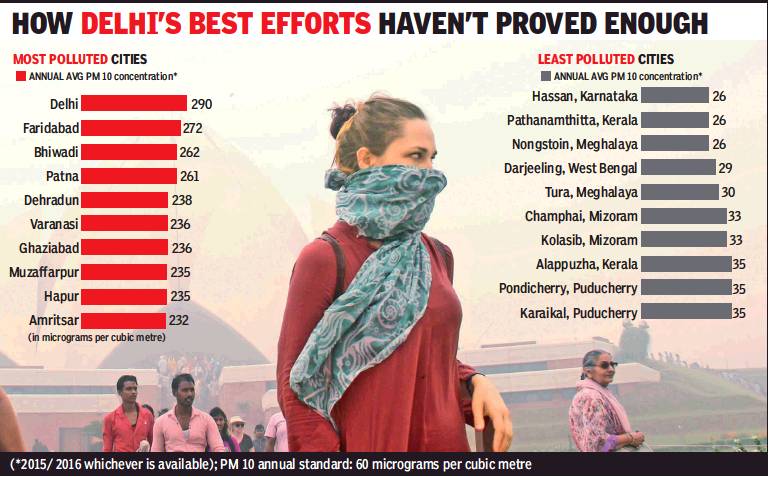
From: Delhi most polluted among 280 cities where air quality is tracked, January 30, 2018: The Times of India
Study Finds PM10 Levels In Capital Way Above Safe Limits Through The Year
Airpocalypse II, a report by environmental NGO Greenpeace India, has found that more than 47% of the population in India is still living in areas where there is no air quality monitoring. Greenpeace researchers analysed PM10 (coarse pollution particles) annual averages for 280 cities monitored by the Central Pollution Control Board under their national air quality monitoring programme, which shows Delhi to be the most polluted and Hassan in Karnataka to have the cleanest air.
Of the 630 million people living in 280 cities where CPCB monitors air quality, close to 550 million live in areas exceeding national safe standards for PM10; and 180 million people live in areas where air pollution levels are more than twice the safe standard of 60 micrograms per cubic metres set by CPCB.
“This includes 47 million children under five years of age, living in areas where the standard is exceeded and 17 million in areas where the air pollution levels are more than twice the stipulated standards,” the report states.
While there is no air pollution monitoring for nearly 580 million people, real-time data are available for a population of only 190 million. Most children under five years live in cities where PM10 levels are more than twice the safe standard — Uttar Pradesh (6.3 million) and Rajasthan (2.1 million), followed by Bihar (1.7 million), Maharashtra (1.4 million) and Delhi (1.4 million).
“Only 16% of the population inhabiting the districts has real-time air quality data available, showing how inhumanly we are responding to the national health crisis in front of us. Even the manual data collected for 300 cities/ towns across the country are not shared in a timely manner and in a format that can be accessed and understood easily by general public,” Sunil Dahiya, senior campaigner, Greenpeace India, said.
Data on monthly PM10 levels during 2016 in Delhi were obtained from six manually operated air quality monitoring stations installed across the city, operating under the Delhi Pollution Control Committee. Assessment of air quality from Delhi, meanwhile, showed that annual PM10 levels were between four and seven times higher than the annual standard prescribed under NAAQS at the six locations data were collected from.
“Not only were the annual values above the annual standard, but they were also way above the daily standard. Except for a couple of months at two stations, we did not see any of the months having PM10 below the daily standard of 100 µg/m3 ,” the report said.
According to the data, Anand Vihar had both the highest peak and annual levels during 2016. Annual PM10 levels during 2016 for RK Puram, Mandir Marg, Punjabi Bagh, Civil Lines, IGI and Anand Vihar were 276, 238, 274, 282, 247 and 423 micrograms per cubic metre, respectively. Overall, the annual PM10 levels for Delhi during 2016 was at 290µg/m3 — nearly three times the safe standard.
Greenpeace researchers also made RTI inquiries and accessed state pollution control board annual reports to check what was being done in polluted cities to comply with national standards.
Based on pollution levels between 2011 and 2015, CPCB had issued directions to states to formulate action plans to reduce air pollution levels across 94 non-attainment (those not meeting safe standard) cities spread across the country. These plans were to be made during 2016 by the state pollution control boards.
“As per the directions, action was required to be taken within a specific timeline, ranging from action on the directions within a week to six months. As per the update with us most of the pollution control boards forwarded the letter to the relevant departments for further action. Apart from Delhi-NCR where a Graded Response Action Plan has come into force and, in Lucknow, where the same plan has been copied for Lucknow city (on paper only — its implementation still seems to be a distant dream), no other city seems to be taking any action of any worth against the polluters,” the report found.
2017, air quality, city-wise
See graphic
Air quality, June 2017, Bangalore, Chennai, Delhi, Mumbai and Pune
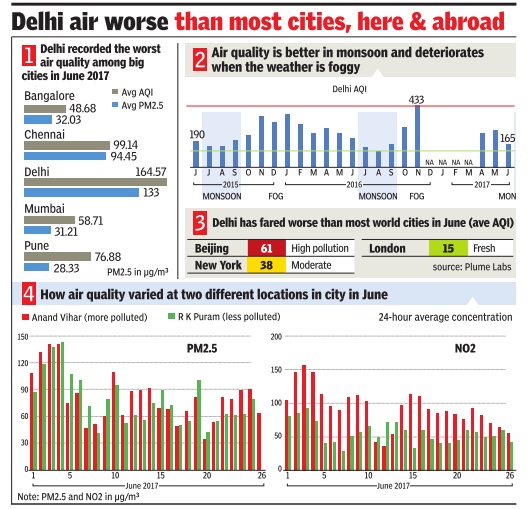
2017 city-wise quality: Chicago U study
From: November 27, 2017: The Times of India
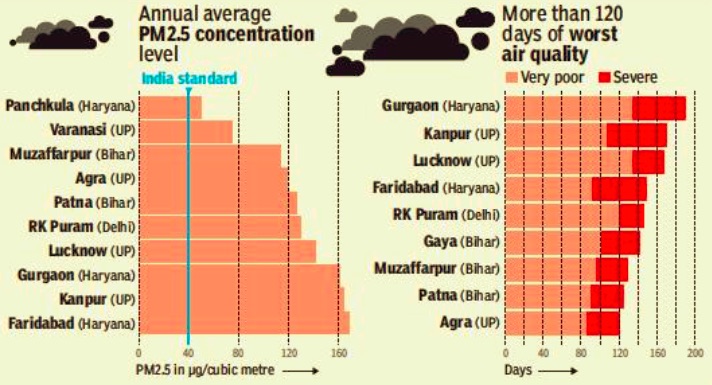
See graphic:
Annual average PM2.5 concentration level, city-wise; Cities having more than 120 days of worst air quality, 2016
2018
2018: nine Indian towns
From: Ritam Halder, Don’t pack your bags yet: Air in these smaller towns is worse than Delhi’s, February 16, 2019: The Times of India
New IIT-Kanpur Study Finds Patna, Varanasi And Kanpur To Be More Polluted Than Capital
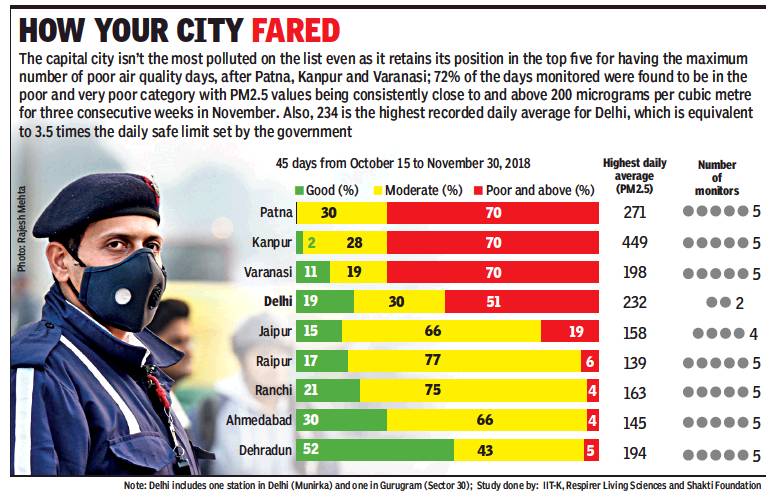
Patna, Varanasi and Kanpur are more polluted than Delhi, a report by IIT Kanpur, Respirer Living Sciences and Shakti Foundation on air pollution data collected using low-cost air quality monitoring devices in nine cities, has revealed.
In the north, monitors were installed in Delhi, Varanasi, Patna, Kanpur, Jaipur and Dehradun. In central India, they were installed in Ahmedabad, Ranchi and Raipur.
According to the report — Visualising the impact of episodic air pollution in the cities from October 15 to November 30, 2018 — Patna, Varanasi and Kanpur recorded the worst air quality, with 70% ‘poor’ and ‘very poor’ AQI days. Patna had zero ‘good’ days, Kanpur was close second with 2%, and Varanasi marginally better at 11%.
Delhi and Jaipur were the next most polluted of the nine cities monitored for PM 2.5 levels. Delhi recorded 51% ‘poor’ and ‘very poor’ days and 19% ‘good” AQI days, while Jaipur had 19% ‘poor’ and ‘very poor’ and 15% ‘good’ AQI days.
Sachida Nand Tripathi, heads of Centre for Environmental Science & Engineering, IIT Kanpur, told TOI that the study shows how in the absence of high-end monitoring stations, the network based on low-cost wellcalibrated censors can help. “This data, which is comprehensive and accurate, especially from new places, will help policy makers too. Only Delhi had multiple stations till now while other cities had one or two. This winter, Bihar has come up with some highly polluted cities. Even Kolkata had some of the most polluted days. So more monitoring is bringing in more information regarding the air we breathe in different parts of the country,” Tripathi said, adding that IIT Kanpur researchers have helped calibrate the censors used in the study.
The data was collected using low-cost air quality monitors (Atmos) across the cities. These devices were calibrated against reference grade monitors (E-BAM) and have primarily being deployed in residential and office buildings. The assessment period spans 45 days, during which the episodes of Diwali and agriculture fire burnings were witnessed.
The report also revealed that the highest daily averages were recorded in Kanpur, Patna, Delhi, Varanasi and Dehradun during the Diwali week. Kanpur in particular had several ‘severe’ air quality days with persistent pollution levels peaking at 355, 449 and 305 micrograms per cubic meters at the time.
In the cities across central India, however, Ranchi topped the charts with Ahmedabad followed by Raipur. The peaks experienced in these cities were significantly lower in comparison with most cities in the north.
Varanasi witnessed the maximum PM2.5 level and consistently topped the charts for ‘poor’ air quality for over a couple of weeks in a row, indicating a persistent problem of poor air.
“Contrary to the popular notion, most monitoring locations spread across cities in the Indo-Gangetic Plain have recorded averages higher than Delhi and Gurgaon. The top five locations were in Varanasi, Kanpur and Patna,” said Ronak Sutaria, CEO, Respirer Living Sciences, adding that now, focus needs to shift to other cities too.
“There is a need to broaden the narrative. There is a low-cost sensor technology which can provide a wider, better understanding. In this study, sensors were placed in residential and institutional areas and not in industrial and traffic zones. So we have the data of where people are living or working, the air we breathe the most,” Sutaria said.
2018: the 6 most polluted cities
Ritam Halder, Delhi world’s most polluted capital: Report, March 5, 2019: The Times of India
From: Ritam Halder, Delhi world’s most polluted capital: Report, March 5, 2019: The Times of India
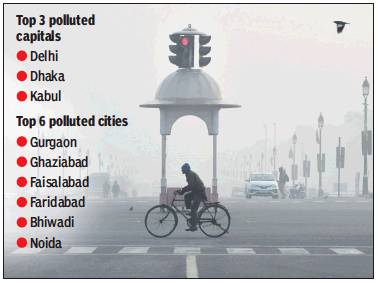
Delhi is the most polluted capital in the world, while Gurgaon is the most polluted city, revealed a Greenpeace report.
According to the latest data compiled in the IQAir AirVisual 2018 World Air Quality Report and interactive world’s most polluted cities ranking, prepared in collaboration with Greenpeace Southeast Asia, to reveal the state of particulate matter (PM2.5) pollution in 2018, Delhi had an average yearly PM2.5 concentration at 113.5 micrograms per cubic metre, followed by Dhaka at 97.1micrograms per cubic metre. Kabul was at the third spot with 61.8 micrograms per cubic metre.
However, in terms of cities, Delhi takes the no 11spot, as Gurgaon took no 1spot with an annual average PM2.5 reading of 135.8 micrograms per cubic metre. Ghaziabad is no 2 with 135.2 micrograms per cubic metre and Faisalabad in Pakistan is third with 130.4 micrograms per cubic metre. Faridabad, Bhiwadi, Noida take the next three spots with average PM2.5 readings of 129.1, 125.4 and 123.6 micrograms per cubic metre respectively.
According to the National Ambient Air Quality Standards, the annual permissible limit for PM2.5 is 40ug/m3. The annual permissible limits prescribed by the World Health Organization are even lower at 10ug/m3.
“This report is based on 2018 air quality data from public monitoring sources, with a focus on data which has been published in real-time or near real-time. These sources include government monitoring networks, as well as validated data from air quality monitors operated by private individuals and organisations,” the report stated.
2018: the 14 most polluted cities
From: Ritam Halder, Elected caretakers not proactive in finding lasting solution to bad air, April 10, 2019: The Times of India
Report Says Delhi Witnessing Criminal Negligence, Laziness From Politicians
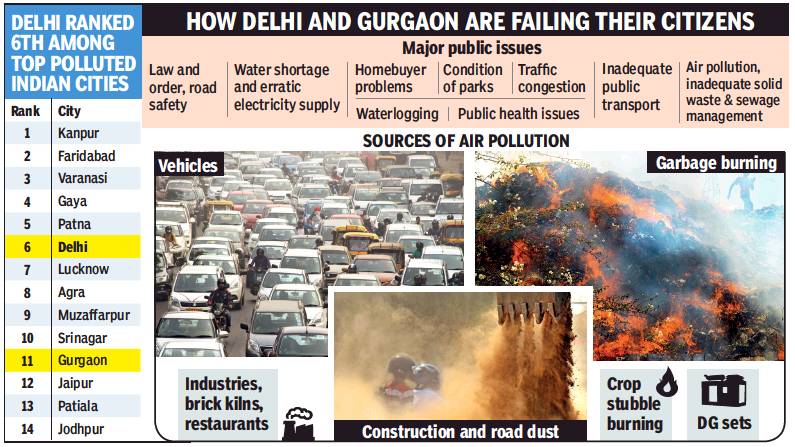
For a city with seven MPs and an elected government with several MLAs, the government institutional machinery can at best be described as reactive than pro-active based on evidence available, claims a report titled ‘Political Leaders’ Positions and Actions on Air Quality’.
“Instead of instant relief, the city is witnessing criminal negligence and laziness from elected caretakers and their implementation agencies in the form of piece-meal, limited, and short-term impact solutions being applied,” says the report by a Delhi-based organisation, Climate Trends. It does a review of the political leadership, citizen perceptions and stakeholder initiatives in the 14 cities of India ranked by WHO in 2018 as the world’s most polluted. These include three cities of NCR — Delhi, Gurgaon and Faridabad with the capital getting the sixth spot.
For Faridabad, ranked second after Kanpur, the warning bells had been ringing since long as all types of pollution sources exist in this industrial town that lead to high levels of pollution in both summer and winter months, contrary to the state government view, the report says. Ranked 11 is Gurgaon. Despite poor air quality it does not yet feature in National Clean Air Programme (NCAP) of Government of India and monitoring of air pollution in the past few years has not been carried out by CPCB. Only in 2018, continuous monitoring started.
“Though high levels of toxic metals are being found in children in the city, the sole focus in government policy and MP actions has been on road infrastructure and Metro project,” it states.
Director of Climate Trends Aarti Khosla said that India clearly needs more intense public awareness campaigns. “The recent State of Global Air report attributed 1.2 million deaths in India due to air pollution. In such a scenario, air pollution alerts and health advisories are a must to contain the public health emergency. While plans are underway, we need greater political commitment for better implementation of existing policies and plans. A national strategy that addresses key sources of pollution — industries, thermal plants, transport, waste management, will have to be developed such that our development doesn’t face any compromise but we don’t end up compromising public health at the same time,” she added.
According to her, it’s a step in the right direction that party manifestos are prioritising air pollution. “While the Congress manifesto talked about sectoral targets to tackle air pollution, BJP’s manifesto talks about converting NCAP into a mission. Our analysis of the 14 most polluted cities of the world, all of which are in north India, clearly shows that there is patchy recognition of the problem of unhealthy air. Inadequate monitoring and insufficient data on poor air quality is a primary reason for limited understanding of the problem,” she said.
The report also points out what Delhi MPs have done on air pollution in Parliament. In 2018, MP from Chandni Chowk and Union minister of environment, forest and climate change, Dr Harsh Vardhan, said that there is no conclusive data available in the country to establish direct correlation of death/disease exclusively to air pollution. New Delhi MP Meenakshi Lekhi has asked questions about air pollution at different times on oddeven, level of pollution, impact of pollution on monuments, pollution measuring devices and monitoring of industries from the relevant ministries.
NCR, 2018: 5 of world’s 10 most polluted cities
Ritam Halder, Rank-bad air: 5 of world’s 10 worst in NCR, March 6, 2019: The Times of India
From: Ritam Halder, Rank-bad air: 5 of world’s 10 worst in NCR, March 6, 2019: The Times of India
Gurgaon, Ghaziabad Top-Most Polluted Cities, Delhi At 11th
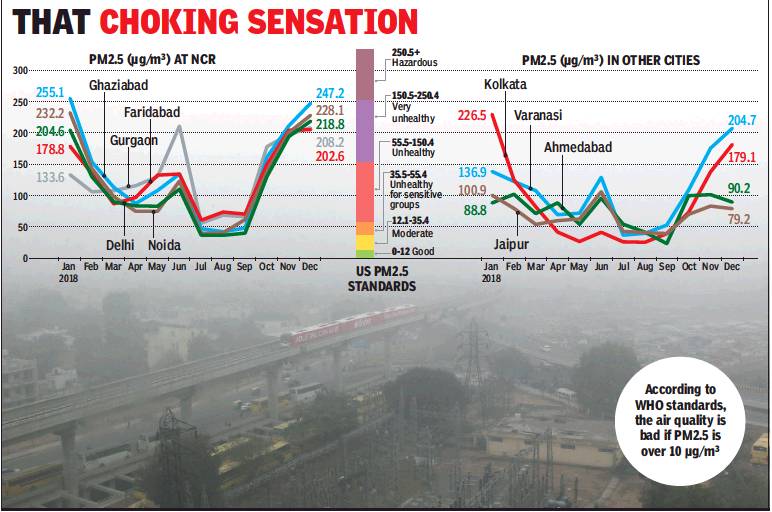
Five out of the top 10 most-polluted cities in the world are in Delhi-NCR with Gurgaon being at the number 1 spot clocking an annual average PM2.5 reading of 135.8 micrograms per cubic metre (ug/m3) in 2018. This has been revealed by data compiled in the IQAir AirVisual 2018 World Air Quality Report prepared in collaboration with Greenpeace Southeast Asia.
Ghaziabad is at the second spot with 135.2ug/m3, while Faisalabad in Pakistan is third with 130.4. Faridabad, Bhiwadi and Noida take the next three spots with average PM2.5 readings of 129.1, 125.4 and 123.6, respectively.
Delhi had an average yearly PM2.5 concentration of 113.5ug/m3 putting it eleventh on the list. However, it is still the most polluted capital followed by Dhaka at 97.1. The third spot went to Kabul with 61.8ug/m3.
The National Ambient Air Quality Standards puts the annual permissible PM2.5 limit at 40ug/m3. The annual permissible limits prescribed by World Health Organization is even lower at 10ug/m3.
The data also reveals that Delhi was ranked 12th in 2017 with an average reading of 108.2ug/m3, which increased to 113.5ug/m3 in 2018.
Monthly data also showed an overall increase in Delhi with November, December and January having the foulest air quality. In January 2017, the average PM2.5 was 157ug/m3, while in 2018 it was 204.6ug/m3. In December 2017, it was 199.9ug/ m3, while in 2018 it was 218.8ug/m3. In November 2017, it was 231.3ug/m3, while the next year it was 194.2ug/m3.
Air pollution has been a major issue plaguing policymakers and citizens in India. If the country reduces particulate pollution by 25% under National Clean Air Programme (NCAP), residents of Delhi and Uttar Pradesh could live almost three years longer, according to a recent Air Quality Life Index (AQLI) report.
The Greenpeace report stated that four of the five most-polluted countries and regions in the world were located in South Asia. “Of the 84 cities monitored, 99% failed to meet the WHO annual guidelines for PM2.5. As a whole, cities here average a PM2.5 concentration of 60ug/m3, six times the recommended limit of 10ug/m3. Sources of PM2.5 pollution vary by region and city, but common contributors include vehicle exhaust, open crop and biomass burning, industrial emissions and coal combustion,” it stated.
The city rankings show Asian locations dominating the highest 100 average PM2.5 levels during 2018, with cities in India, China, Pakistan and Bangladesh occupying the top 50 spots. Middle-East region cities also rank highly with Kuwait City, Dubai and Manama all exceeding the WHO guidelines by over 500%.
At country-level weighted by population, Bangladesh emerged as the most-polluted country on average, closely followed by Pakistan and India, with Middle-Eastern countries, Afghanistan and Mongolia also within the top 10.
“Of the cities included in South Asia, it is interesting to note that, although Delhi typically receives most media coverage as one of the world’s pollution capitals, the Indian capital only ranks 10th for annual PM2.5 concentration,” the report stated.
Pujarini Sen of Greenpeace India said, “We need to do much more than was has already been planned and done. If we want India to breathe clean air, it’s high time that our plans such as NCAP, GRAP, CAP, etc become stringent, aggressive, legally binding and most of all implementable at ground.”
2022
March 23, 2022: The Times of India
Most polluted countries;
Top polluted Indian cities with annual PM2.5 concentrations, 2021
From: March 23, 2022: The Times of India
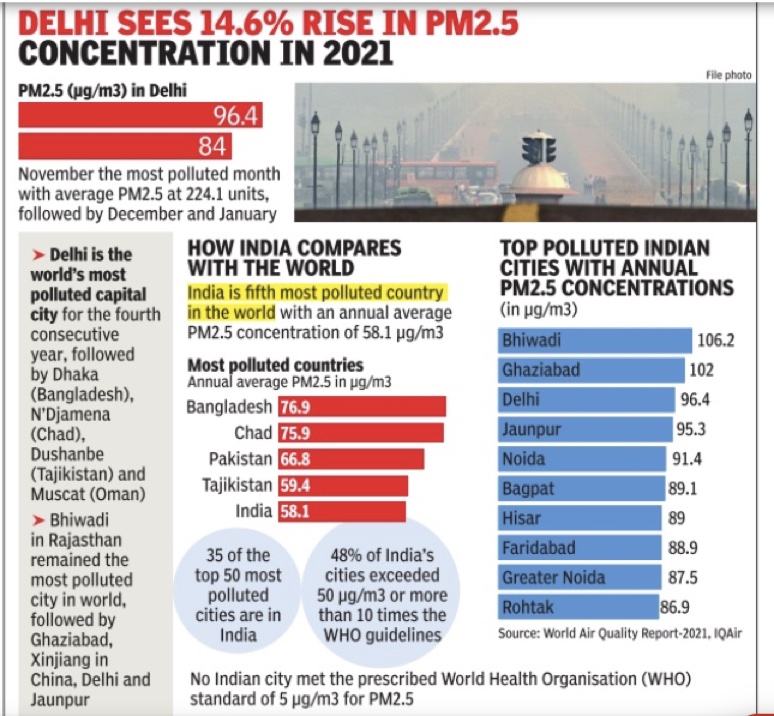
New Delhi: Delhi emerged as the most polluted capital and the fourth most polluted city in the world, according to a 2021 World Air Quality Report by Swiss organisation IQAir.
The report said Delhi saw a 14. 6% increase in PM2. 5 concentration in 2021, with levels rising to 96. 4 ug/m3 (micrograms per cubic metres) from 84 ug/m3 in 2020. This was nearly 20 times the WHO’s safety limit of 5 ug/m3.
Thirty-five of the world’s 50 most polluted cities were in India, the report said. None of the Indian cities met the prescribed WHO standards for PM2. 5 while 48% of the country’s cities exceeded 50 ug/ m3, or more than 10 times the WHO guidelines. The report named 63 Indian cities in the 100 most polluted worldwide.
According to the report, Bhiwadi in Rajasthan was the most polluted city in the word, followed by Ghaziabad in UP. Both fall in NCR. They were followed by Hotan (China), New Delhi and Jaunpur (UP), Faisalabad (Pakistan), Noida (UP), Bahawalpur (Pakistan), Peshawar (Pakistan) and Bagpat (UP).
“India’s annual average PM2. 5 levels reached 58. 1 ug/ m3 in 2021, ending a three-year trend of improving air quality. Its annual PM2. 5 averages have now returned to pre-quarantine concentrations as measured in 2019,” the report stated.
Pointing out challenges, the report said air pollution is the second-biggest risk factor for disease and its economic cost is estimated to exceed $150 billion annually. The report stated that while the Union environment ministry enacted the National Clean Air Programme, which aims to reduce particulate pollution by 20-30% by 2024 in all non-attainment cities, the lockdowns, restrictions and the economic downturn due to the pandemic have made it difficult to determine the plan’s impact based on air pollution levels alone.
The report listed vehicular emissions, power generation, industrial waste, biomass combustion for cooking, construction and stubble burning as the major sources of pollution.
“It is estimated that 20% to 35% of the total urban PM2. 5 concentrations is directly or indirectly due to internal combustion engines in motor vehicles. Annual vehicle sales in India are expected to increase, with the estimated fleet reaching 10. 5 million in 2030,” the report said.
Greenpeace India campaign manager Avinash Chanchal termed the report “a wake-up call” for governments and corporations.
“It once again highlights that people are breathing dangerously polluted air. Vehicular emissions are one of the major contributors to urban PM2. 5 concentrations. With annual vehicle sales in India set to increase, it is certainly going to impact the air quality if corrective measures are not taken in time,” he said.
Chanchal said the solution was “readily accessible”. “PM air pollution is produced by burning of fuels, which is a major contributor to the climate crisis. It is high time that governments promote renewable energy for transportation and build infrastructure that encourages cycling, public transport and pedestrians,” he added.
Details
Priyangi Agarwal, January 11, 2023: The Times of India
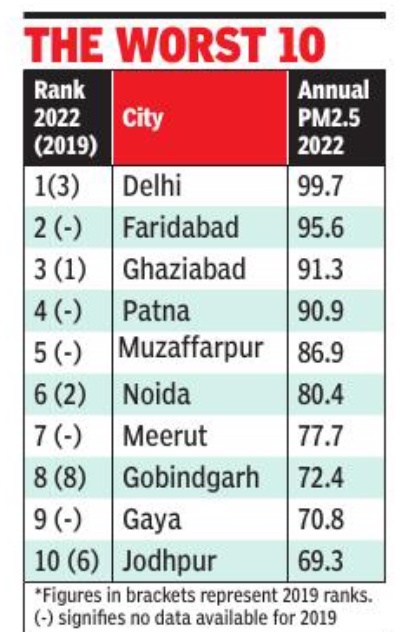
From: Priyangi Agarwal, January 11, 2023: The Times of India
New Delhi : Delhi has earned the dubious tag of being India’s most polluted city, “rising” from rank 3 in 2019 and rank 2 last year in the list of worst-polluted cities, as per the National Clean Air Programme (NCAP) Tracker based on annual PM2. 5 levels measured by the Central Pollution Control Board.
While Delhi’s annual PM2. 5 levels improved by 7. 4% since 2019, from 108 microgram per cubic metre to 99. 7, Ghaziabad and Noida, the two cities above the capital in the 2019 list, recorded sharper improvements of 22. 2% and 29. 8%, respectively.
The Centre launched NCAP in 2019, setting a target of reducing key air pollutants PM10 and PM2. 5 by 20-30% by 2024 in 131 “non-attainment” cities — cities that didn’t meet the national air quality standards. In September 2022, the Centre set a revised target of a 40% reduction in particulate matter concentration in cities covered under NCAP by 2026. To meet these targets, around Rs 6,897. 06 crore have been released to the cities under the programme and by the finance commission. The annual safe limit for PM2. 5 is 40 micrograms/cubic metre.
Cold wave abates but fog hits 100 flights
After battling a cold wave for five days, Delhi finally got some respite from frigid weather on Tuesday with a 3-degree rise in minimum temperatures even though dense fog conditions continued, delaying over 100 flights and 39 Delhi-bound trains. The capital had 9 hours of dense fog, from 12.30am to 9.30am. Cold wave conditions aren’t expected to return for four days, the met department said.
Air still ‘severe’, light rain likely tomorrow
The air quality of the capital continued to remain in the ‘severe’ category for the second consecutive day on Tuesday. The overall Air Quality Index (AQI) was 407 on Tuesday, as against 434 on Monday, as per CPCB’s bulletin released at 4 pm. However, it improved to ‘very poor’ category on Tuesday evening, with an AQI of 394 at 6pm. The IMD has predicted very light rain or drizzle.
2022 – 2023
Kushagra Dixit, Oct 5, 2023: The Times of India
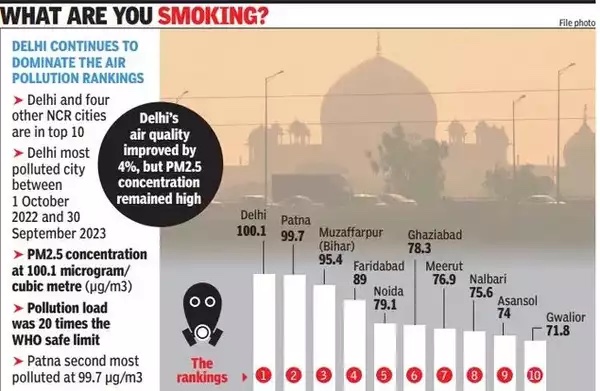
From: Kushagra Dixit, Oct 5, 2023: The Times of India
NEW DELHI: Despite a slight improvement in air quality over the past year, Delhi was very polluted with high PM2.5 levels, according to Climate Trends and Respirer Living Sciences. Their study said that Delhi and four other NCR towns — Faridabad, Ghaziabad, Noida and Meerut — were among India’s top 10 polluted cities.
According to the study, between October 1 last year and September 30 this year, Delhi recorded an average PM2.5 concentration of 100.1 micrograms per cubic metres — thrice the government’s standard of 30 and 20 times the safe limit of 5 micrograms defined by the World Health Organization.
Following Delhi were Patna and Muzaffarpur, both in Bihar, with 99.7 micrograms per cubic metre.
The cleanest air was deemed to be in Aizawl, Mizoram, where the PM2.5 level was 11.1 micrograms per cubic metre.
Assessing the six major state capitals facing the challenge of clean air during the peak pollution months between October and March from 2019 to 2023, the study found that Mumbai’s air worsened steadily while Delhi’s and Lucknow’s improved.
“From October 1, 2023, a revised version of Graded Response Action Plan has come into force in Delhi and 24 nearby districts, collectively known as the National Capital Region. The region has several places which frequently top Indian and global air pollution rankings.
Delhi saw a 4% improvement in air quality over the previous year between October last year and September this year. The other NCR cities in the top 10 too showed significant improvement in air pollution during this period: Ghaziabad 25%, Faridabad and Noida 12% and Meerut, 11%.
The study analysed two sets of air quality data, first the PM2.5 data for the past one year from October 1, 2022, to September 30, 2023, to track improvement in air quality. The second data comprised PM2.5 readings during winter, roughly October–March when pollution levels are high. It said that pollution in cities like Delhi was highest during the winter months because of factors like cooler temperatures, low or no rainfall, stubble burning and bursting of firecrackers.
“In the peak pollution months of October-December 2022, the PM2.5 levels dropped in six of the top 10 cities — Delhi, Faridabad, Noida, Ghaziabad and Meerut in NCR and Muzaffarpur in Bihar — indicating an improvement in air quality over the previous year. How much of this was due to climatic factors (rain, wind) and how much due to policy intervention is a matter of deeper study,” the study said.
However, despite the decline, the absolute PM2.5 levels in these places are extremely high and pose serious health risks. In Delhi, it averaged 157.1 microgram per cubic metre in October-December 2022. The figure was 174.4 in the same period in 2021, 180.5 in 2020 and 176.9 in 2020.
2023: India world’s 3rd worst, Delhi worst affected capital
Vishwa Mohan, March 20, 2024: The Times of India
New Delhi: India was ranked the third most polluted country and New Delhi the most polluted capital in the 2023 World Air Quality report by Swiss tech company, IQAir. The latest report by the company that provides live information on major air pollutants globally, found Begusarai in Bihar as the most polluted city globally last year.
The report, released Tuesday, showed Bangladesh and Pakistan were the top two most polluted countries in 2023. India showed a relative decline as the country was ranked 8th in 2022, an improvement from 2021 when it had the 5th rank. IQAir said 13 of the 15 most polluted cities in the world in 2023 were in India with Begusarai, Guwahati and Delhi being the top three.
Silchar, Aizawl, Damoh among least polluted
Vishwa Mohan, March 20, 2024: The Times of India
New Delhi:While many Indian cities figured among the worst polluted in IQAir’s 2023 World Air Quality report, some made the list for the right reasons. Silchar in Assam (7th), Aizawl in Mizoram (8th) and Damoh in MP (15th) figured in the list of least polluted cities in central and south Asia region, home to many polluted cities in the world.
In 2023, only 10 out of the reporting 134 countries succeeded in achieving the WHO annual particulate matter PM2.5 standards of 5 micrograms per cubic metre (µg/m3). Exposure to PM2.5, one of the key pollutants, leads to and exacerbates numerous health conditions, including asthma, cancer, stroke and lung disease.
The report, factoring in hazardous PM2.5 concentrations, found that Delhi’s PM2.5 concentration in 2023 had risen by 10% from 2022 with levels peaking in Nov, which saw a monthly average of 255 µg/m3.
The report analysed data from all air pollution monitoring stations in India and underlined that 1.3 billion people in India experience PM2.5 concentrations exceeding the WHO recommended annual guideline level of 5 µg/m3. Overall, India with PM2.5 concentrations of 54.5 µg/m3 reported 10 times higher pollution levels the WHO PM2.5 annual standard.
“Furthermore, 1.3billion, or 96% of the population, experience PM2.5 levels more than seven times the WHO annual PM2.5 guideline. This trend is reflected in city-level data with more than 66% of the country’s cities reporting annual averages greater than 35 µg/m3,” said the report.
It noted that India has an extensive air quality monitor- ing network, hosting more air quality monitoring stations than all other countries in central and south Asian region combined. The vast network has contributed data from 256 cities in 2023, representing 74% of cities in the central and south Asia region.
For the 2023 report, data from more than 30,000 air quality monitoring stations across 7,812 locations in 134 countries, territories and regions were analysed.
“In many parts of the world, lack of air quality data delays decisive action and perpetuates unnecessary suffering. Air quality data saves lives. Where air quality is reported, action is taken, and air quality improves,” said Frank Hammes, global CEO, IQAir.
Costs due to air pollution to..
2019: Cost to industry, economy

From: April 21, 2021: The Times of India
See graphic:
The Cost of Air pollution to Indian industry, economy, 2019
Diwali pollution
See also graphic and Air pollution: Delhi
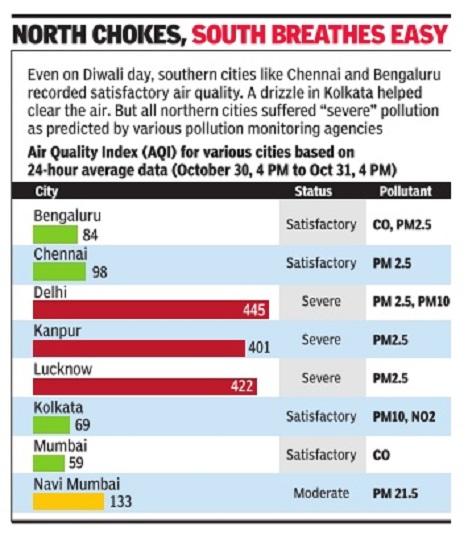
The Times of India
City-wise, 2015-21
Nov 5, 2021: The Times of India
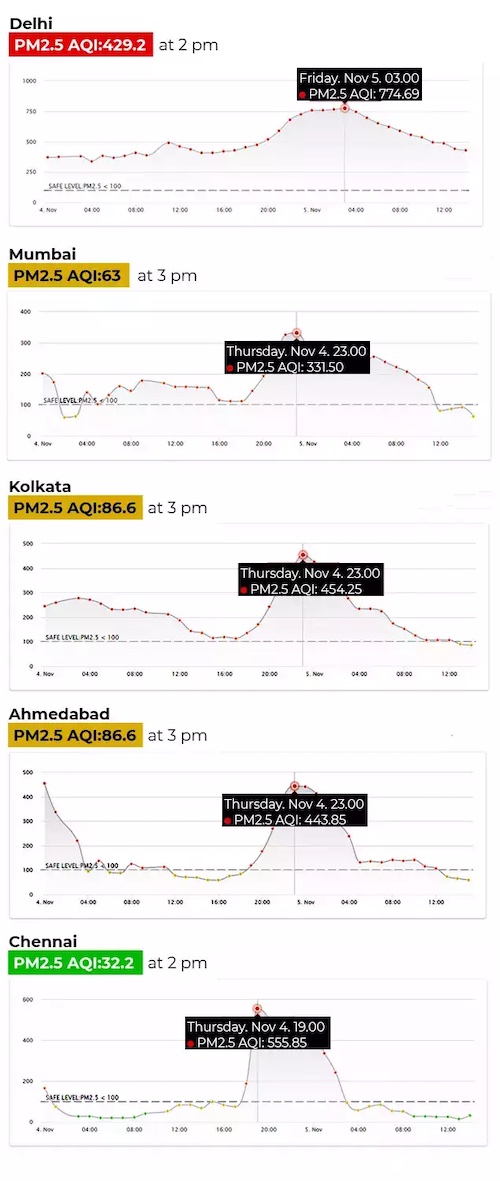
From: Nov 5, 2021: The Times of India
From: Nov 5, 2021: The Times of India
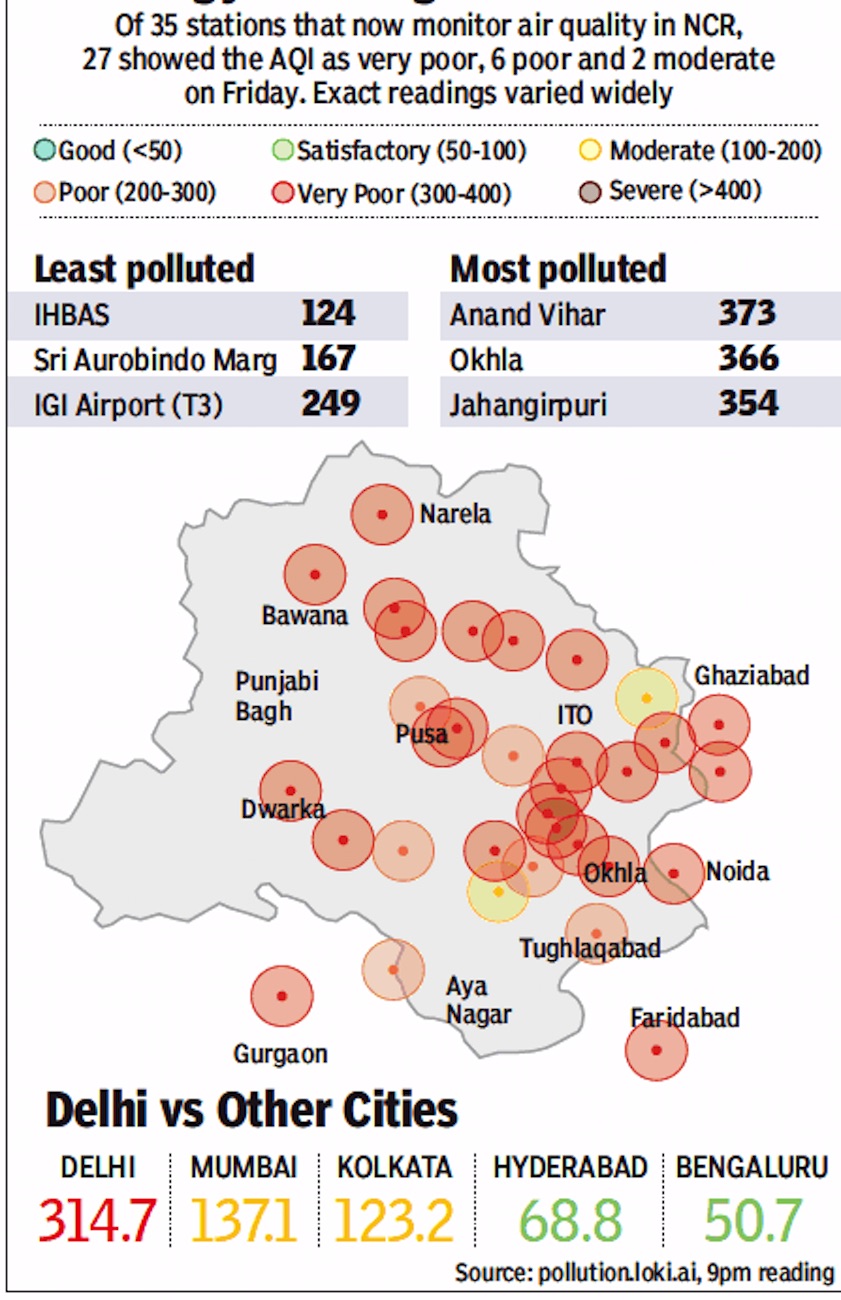
NEW DELHI: Grey skies, a thick layer of acrid smog and dangerously high concentration of lung-damaging fine particles in the air. Delhiites woke up to a grim morning on Friday as rampant cracker bursting on Diwali night and emissions from farm fires pushed pollution levels beyond the "severe" category.
The pollution levels in the national capital skyrocketed from 243 micrograms per cubic metre at 6pm on Diwali day to 410 micrograms per cubic metre at 9am on the next day, around seven times the safe limit of 60 micrograms per cubic metre.
Data shows that average pollution levels recorded in the national capital were the highest in the last five years, leaving citizens across the city gasping for breath.
Delhi's air quality index (AQI), which entered the 'severe' zone last night, continued its upward trend and stood at 463 at 3pm on Friday.
The spike in pollution levels came after citizens across the NCR flouted the cracker ban imposed by the Supreme Court. Cracker bursting continued till late night in NCR cities of Noida, Faridabad and Gurugram.
A significant rise in toxic farm fire fumes on Diwali day only made matters worse, creating a thick cocktail of life-threatening smog in the city.
Even adjoining areas of Delhi witnessed an uptick in PM2.5 pollution levels. The neighbouring cities of Faridabad (464), Greater Noida (441), Ghaziabad (461), Gurugram (470) and Noida (471) recorded 'severe' air quality at 3pm.
Why Delhi faces the brunt of cracker-bursting
Pollution charts of several other cities clearly indicate that Delhiites weren't the only ones who flouted the cracker ban.
According to data, the AQI levels peaked in cities like Mumbai (331), Chennai (555), Kolkata (454) and Ahmedabad (443) on the eve of Diwali.
Except Mumbai, AQI in all other cities had breached the severe mark.
While pollution levels in all other cities dipped significantly following Diwali evening, Delhi's AQI remained in the severe category throughout the following day.
An AQI between zero and 50 is considered 'good', 51 and 100 'satisfactory', 101 and 200 'moderate', 201 and 300 'poor', 301 and 400 'very poor', and 401 and 500 'severe'.
But Delhi's pollution problem is also driven by stubble burning. This was expected, say experts.
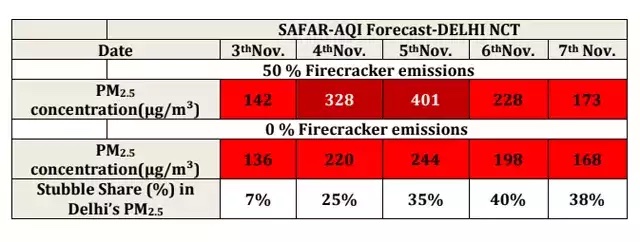
Stubble burning accounted for 36 per cent of Delhi's PM2.5 pollution on Friday, the highest this season so far, according to government air quality forecast agency SAFAR.
On Thursday, farm fires had accounted for 25 per cent of Delhi's PM2.5 pollution.
The chart above shows that even before Diwali evening, the pollution levels in Delhi remained dangerously high and almost crossed the 500-mark around noon.
Last year, the share of stubble burning in Delhi's pollution had peaked at 42 per cent on November 5. In 2019, crop residue burning accounted for 44 per cent of Delhi's PM2.5 pollution on November 1.
According to the SAFAR forecast, the pollution levels in Delhi would have remained in the "poor" category even without fire cracker emissions. However, the forecast shows that bursting of firecrackers - even at 50% - would have pushed the AQI level past the severe mark on November 5.
Delhi environment minister Gopal Rai said that capital's air quality had deteriorated due to a surge in farm fires and some people bursting firecrackers on purpose on Diwali despite a ban on it. Rai said Delhi's base pollution has remained the same. Only two factors have been added — firecrackers and stubble burning.
(With inputs from agencies)
Crackers leave lasting impact on air
Crackers leave lasting impact on air, Nov 02 2016 : The Times of India
Diwali is gone but it seems the toxic pollutants released due to bursting of firecrackers are still hanging in the air. The air quality on Tuesday continued to be in the “severe“ category , according to System of Air Quality and Weather Forecasting Research (SAFAR). The AQI released by Central Pollution Control Board (CPCB), however, showed a slight improvement-“very poor“.
Experts said even if firecrackers were burst only for a day , they left a lingering impact on the air quality because the pollutants were not able to disperse easily as temperatures dropped and the wind speed was very low.
“You have to understand that there were very high intensity emissions over a very short period. While such high emissions can trigger health impacts immediately, they are also adding to the existing pollution, which is not able to escape,“ said a scientist from SAFAR. “The pollutants from this Diwali have started dispersing very slowly and tomorrow dispersion may happen if the wind speed picks up as forecast. But temperature has dropped by a degree, which will make a complete clearout difficult.“ According to SAFAR, PM 2.5 concentrations on Tuesday were about 315 micrograms per cubic metres, about 12 times the WHO standards. “Tomorrow, this could fall to about 240 provided the wind speed improves,“ added the scientist. Wind speed remained very low even on Tuesday , ranging from 2 metres per second in the day to 0.3 metre per second in the evening.
M P George, head of air lab, DPCC, said accumulation of pollutants had begun even before Diwali. “The severe pollution level will have to be seen in the light of prevailing air pollution and meteorological conditions in the past week. The high pollution levels are a result of trans-region movement of pollutants due to crop residue burning, low wind speed and contribution from fireworks on the Diwali night,“ he said.
Dussehra effigy burning
2018
From: October 20, 2018: The Times of India
See graphic:
The impact of the burning of the three demons’ effigies on Dussehra day in various parts of Delhi and various Indian metropolitan cities
Dust
The top emitting states 2022
Parth.Shastri, Dec 30, 2023: The Times of India
Raj, UP, Maha, K’taka & Guj top dust emitters: IIT study
Ahmedabad : At an Ahmedabad-based pulmonologist and chest physician’s clinic, five of 10 patients were to see the doctor due to irritation in respiratory tracts caused by dust.
Dr Gopal Raval explained just why. “While some had come for issues due to emissions from construction sites, others were living near the roads with high traffic volume and high concentration of dust particles in the air. The primary sign of dust-related irritation is non-obstructive chronic bronchitis where the patients get a bad dry cough, which is not caused by any infection,” Raval said. Ahmedabad is not alone in battling dust-induced health problems. A study by researchers from IIT Delhi and IIT Kanpur indicated that five states contributed to 60% of the country’s total dust emission in terms of both particulate matter (PM) 10 and 2.5.
The study prepared a “comprehensive particulate matter road dust emission inventory” for 2022 using the vehicle registration data from 1,352 RTOs in India. States such as Rajasthan, Uttar Pradesh, Maharashtra, Karnataka and Gujarat emerged as the predominant contributors to road dust emissions. These states not only exhibit elevated silt loading (sL) values but also account for a substantial proportion (43%) of the total registered vehicles in India, underscoring the pressing imperative for effective mitigation measures, the study said.
The findings were published in Elsevier journal Science of the Total Environment in a paper titled “Fugitive road dust particulate matter emission inventory for India: A field campaign in 32 Indian cities”. Its authors included Arpit Katiyar, Diljit Kumar Nayak, Pavan Kumar Nagar, Dhirendra Singh, Mukesh Sharma and Sri Harsa Kota.
Economic damage caused by air pollution
2015: killed 81,000 in Delhi, Mumbai; cost Rs 70,000cr
Air pollution contributed to a total of 80,665 premature deaths of adults over 30 years in Mumbai and Delhi in 2015, a two-fold jump from 1995, according to a new study at the Indian Institute of Technology , Bombay .
In economic terms, air pollution cost the two cities $10.66 billion (approximately Rs 70,000 crore) in 2015, or about 0.71% of the country's gross domestic product.
The study has said the impact on health and productivity as a result of exposure to pollution and the consequ ent burden of respiratory ailments rose with every passing decade.
Researchers calculated impact using data on PM 10 (fine particulate matter mea suring 10 microns), population and death rates.
With its higher pollution levels, Delhi recorded more premature deaths due to ingestion of PM10 from vehicle exhaust, construction dust and other industrial processes. Casualties went up from 19,716 in 1995 to 48,651 in 2015.
In Mumbai, the compara tive figure rose from 19,291 to 32,014 in 20 years. Air pollution was also re sponsible for 23 million cases of restricted activity days (RAD) -either less productive days or days off work for individuals -in the commercial capital in 2015.The worsening quality of air in the city also led to 64,037 emergency room visits in 2015 by those stricken by respiratory ailments, up by 35.4% from 1995. In comparison, in Delhi, there were 29 million cases of RAD and 0.12 million emergency room visits in 2015.
The study's lead author, Kamal Jyoti Maji, said the impact of air pollution on health and productivity was evident in that the increase in cases and cost after 2005 was in line with the overall trend in pollution.
Pollution also cost the two cities as much as $10.66 billion in 2015, or about 0.71% of the country's GDP, a cost that's almost doubled since 1995.
The economic cost of PM10 exposure rose by around 60% in Mumbai from $2.68 million in 1995 to $4.26 billion in 2015.Cost to Delhi jumped by 135% in the same period to hit $6.39 billion, the study found.
One measure of health and longevity is called “disabilityadjusted life years“ (DALY), representing years lost due to various illness. This measure for illnesses caused by air pollution doubled in Delhi between 1995 and 2015 from 0.34 million to 0.75 million DALY. In Mumbai, that number rose from 0.34 million to 0.51million DALYs in the same period. To keep to current health outcomes in 2030, PM10 levels would have to decline by 44% in Mumbai and 67% in Delhi, the study said.
These estimates are likely to be an undercount of actual costs, mortality and morbidity , said the researchers, since the study looked only at the impact of PM10 and to a lesser extent PM2.5. The IIT study was published recently in the Environmental Science and Pollution Research Journal, and authored by research scholar Maji, IIT Bombay professor Anil Dikshit and Ashok Deshpande from the Berkeley Initiative in Soft Computing, USA. In India, air pollution causes over half a million premature deaths annually and 20 million DALYs, according to WHO.
The extent of the problem
World’s 14 most polluted cities are all in India
May 2, 2018: The Times of India
ii) The number of India cities among the 15 most polluted in the world, 2010-16.
From: May 2, 2018: The Times of India
Pollution levels in Delhi, 2010-16.
From: May 2, 2018: The Times of India
WHO Report Says Delhi Air Worst In 6 Yrs
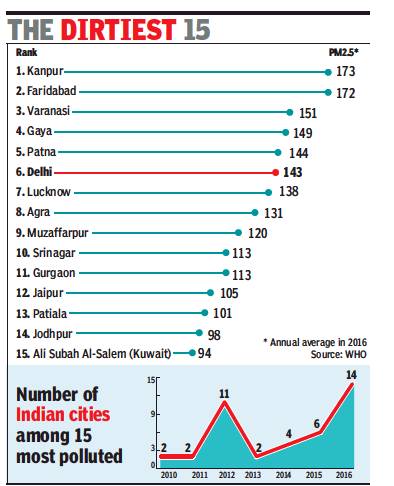
Delhi is not the most polluted city in the world. But that’s hardly any reason to cheer. The WHO global air pollution database released in Geneva early Wednesday morning reveals that India has 14 out of the 15 most polluted cities in the world in terms of PM 2.5 concentrations, with the worst being Kanpur.
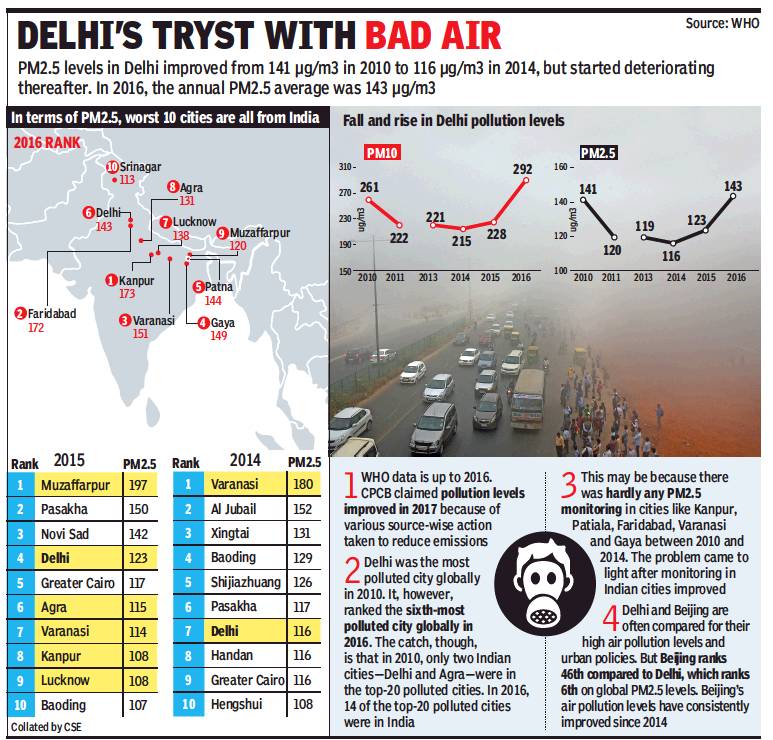
Despite public outcry over severe air pollution, and both Centre and Delhi government taking up the issue, WHO’s database of more than 4,000 cities in 100 countries shows that Delhi’s pollution levels improved only marginally between 2010 and 2014 but started deteriorating again in 2015.
In 2016, the latest year in WHO’s database, Delhi was in sixth spot, having recorded its highest pollution levels in six years. The city’s PM 2.5 annual average was 143 micrograms per cubic metre, more than three times the national safe standard, while the PM 10 average was 292 micrograms per cubic metre, more than 4.5 times the national standard.
The Central Pollution Control Board (CPCB) had recently claimed that air pollution levels improved in 2017 as compared to 2016. The board, however, hasn’t released the annual average PM 2.5 concentration for 2017 yet.
A number of policies came into effect towards the end of 2016 — the graded response action plan (GRAP) in October, doubling of the environment compensation charge (ECC) on trucks in December 2015 and better coordination among NCR states on pollution control.
The WHO report, however, doesn’t reflect this because it considers annual PM 10 and PM 2.5 averages between 2010 and 2016.
Delhi unable to keep pace with Beijing in bad-air fight
Experts Not Sure What Led To Sudden Spike In Delhi Pollution In 2015 And 2016
The data sources for Delhi is mainly from CPCB (about 10 stations), although for the years 2015 and 2016 WHO also considered data from ministry of earth sciences (MoES) and US Environment Protection Agency’s (EPA) Air Now. This may have also influenced the air pollution concentrations for 2015 and 2016, experts said.
Kanpur topped the 2016 list with a PM 2.5 concentration of 173 micrograms per cubic metre, followed by Faridabad, Varanasi and Gaya.
Ironically, as India’s air pollution monitoring network improved in the past few years with more cities being monitored, the number of Indian cities in the top polluters’ list zoomed.
“With improved air quality monitoring, we are beginning to understand the depth and spread of the air pollution problem in India. While Delhi is at the crossroads and is expected to bend the curve post 2016, other pollution hot spots are proliferating across the country,” said Anumita Roy Chowdhury, executive director, Centre for Science and Environment (CSE).
“This is a national public health crisis and the newly proposed national clean air action plan has to ensure stringent action in all cities to comply with clean air standards,” Chowdhury said.
In 2010, Delhi was the worst polluted city globally followed by Peshawar and Rawalpindi. Agra was the only other Indian city in the top 10 polluted (PM 2.5) cities, in 2011 too Delhi and Agra were the only two Indian cities and Ulaanbaatar was the worst.
But this started changing 2012 onward when 14 out of top 20 most polluted were in India. In 2013, 2014 and 2015 too, four to seven Indian cities were in top
20. But in the 2016 data released on Wednesday, 14 out of 15 most polluted are in India.
As for Delhi, experts are not sure what may have led to a sudden spike in 2015 and 2016. “In 2015 and 2016, there were northwesterly winds in the crop burning season which brought particulate pollution from neighbouring states. These meteorological factors may have also accentuated air pollution in Delhi," said Dipankar Saha, former CPCB air lab head.
In contrast, many Chinese cities are improving. In 2016 only four Chinese cities —Baoding, Hengshui, Xingtai and Anyang — were in top 20 compared to 14 Chinese cities, including Beijing, in 2013’s top 20.
Delhi and Beijing are often compared due to their high air pollution levels and policies like the odd-even road rationing measure or air pollution emergency action plan. However, WHO’s recent data shows that Beijing’s air pollution levels have been consistently reducing 2013 onwards.
In 2016, Beijing’s PM 2.5 concentration was 73 micrograms per cubic metre compared to Delhi’s 143. “There are cities that have seen a decrease in PM2.5 level, Beijing and Mexico, if you look at the data. China has put a number of measures since 2013, from a National Action Plan of Air pollution Control, enforcement of environmental standards etc,” WHO said, responding to TOI’s questionnaire.
WHO said that 9 out of 10 people in the world breathe air containing high levels of pollutants. “Updated estimations reveal an alarming death toll of 7 million people every year caused by ambient (outdoor) and household air pollution. Ambient air pollution alone caused some 4.2 million deaths in 2016, while household air pollution from cooking with polluting fuels and technologies caused an estimated 3.8 million deaths,” it said.
WHO also highlighted that air pollution is mainly responsible for non-communicable diseases (NCDs), causing an estimated one-quarter (24%) of all adult deaths from heart disease, 25% from stroke, 43% from chronic obstructive pulmonary disease and 29% from lung cancer.
2019: ‘Not merely an urban problem’
Chandrima Banerjee, November 9, 2020: The Times of India
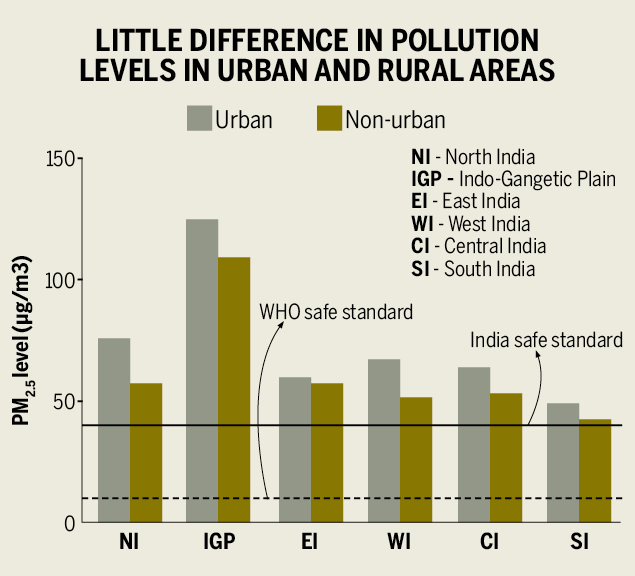
From: Chandrima Banerjee, November 9, 2020: The Times of India
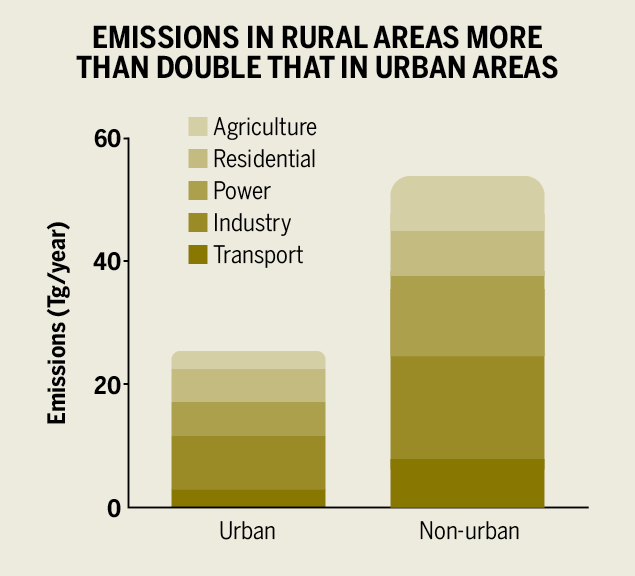
From: Chandrima Banerjee, November 9, 2020: The Times of India
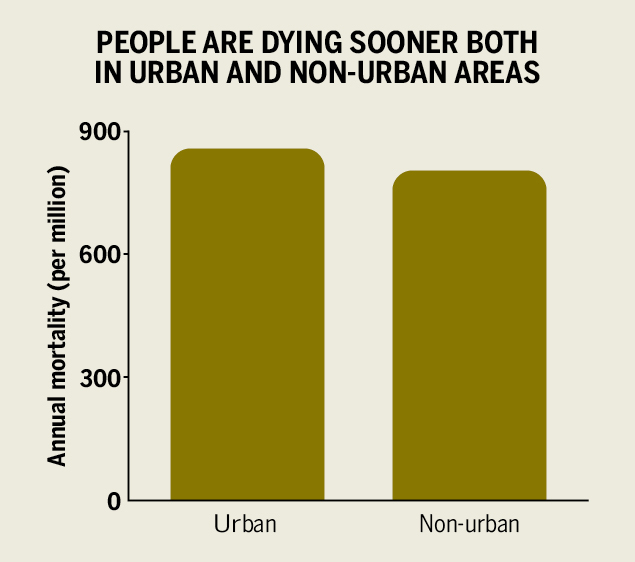
From: Chandrima Banerjee, November 9, 2020: The Times of India
Emissions in non-urban areas more than double those in urban ones, exposing 84% across India to unsafe air.
People living outside the big cities in India are just as badly hit by air pollution, but they may be far less equipped to reduce the risks. And because there has been little focus on pollution outside urban spaces, 84% of India’s population is exposed to pollution levels much higher than India’s safety standards allow.
The study, ‘Outdoor air pollution in India is not only an urban problem’, was published in the Proceedings of the National Academy of Sciences of the USA earlier this week. The scientists, from Colorado State University and IIT-Bombay, divided the area of study into six zones — Indo-Gangetic Plain (IGP), north India, east India, south India, west India and central India — and went over satellite-derived PM2.5 levels at various points over a decade.
“The IGP stands out as the area of highest population-weighted PM2.5 (>100 µg/m3 throughout) and has the largest population density. In this region, the pollution is almost evenly spread across urban and nonurban regions … Even in the other five regions, there is little difference between population-weighted PM2.5 levels between urban and non-urban regions,” the study found.
Southern India, in a 30-50µg/m3 range, had the best air quality in non-urban areas, followed by central India. While pollution over the Indo-Gangetic Plain is double that of the rest of the country, PM2.5 levels in all urban and non-urban areas were above the safe levels in all other five regions as well. “IGP has a high population. It also has many high-polluting industries — coal-powered electricity plants, cement production,” lead author Dr AR Ravishankara told TOI.
The WHO’s guidelines for healthy air set the danger mark at 10µg/m3. By those standards, less than 0.001% (or less than 1 in a lakh) Indians breathe air that is safe, the study found. India’s standards allow for four times more particulate matter in the air (0µg/m3), and even by those, only 16% breathe relatively cleaner air. “Clearly, the non-urban regions in India are being affected by air pollution as much as the more visible urban regions,” the paper said.
So far, understanding of how pollution in one area affects another has been restricted to stubble burning. But that doesn’t take into account the impact at source. “We have shown previously that eastern India is greatly affected by pollution transport from the IGP. It appears that nonurban regions create a significant amount of their own pollution,” the paper said. In fact, emissions in non-urban areas, 53 Tg (teragram)/year (million tons a year), are more than double that in urban areas, 25 Tg/year.
How it works is also different. “In urban areas, the contribution of indoor air pollution to outdoor air pollution is not very large. Transportation, industry, among others, are significant factors,” Ravishankara said. In non-urban areas, it’s exactly the opposite: “The residential energy use is a significant emissions source, primarily due to household cooking with solid fuels in the non-urban areas.” The impact is the same — people are dying sooner. “The annual premature mortality attributable to PM2.5 for India (urban and nonurban) is 1.05 million,” the study said, linking bad air to six causes of death — ischemic heart disease, stroke, lower respiratory infections, chronic obstructive pulmonary disease, lung cancer and diabetes mellitus type 2.
But non-urban areas are worse placed than urban ones, with even less oversight, limited infrastructure and awareness. “The nonurban population has a lesser ability to reduce their risks because of economic reasons and, thereby, raising equity issues,” the paper said. “Nonurban regions have the further confounding influence of indoor air quality due to the use of solid fuels for cooking in inefficient cookstoves. The inclusion of this impact would only ... enhance the air pollution impacts in nonurban areas relative to urban areas.”
Fog in North-Central India (UP, Bihar, Bengal, NCR)
The Times of India, Feb 06 2016
Vaishnavi Chandrashekhar
UP, Bihar, West Bengal see more fog than NCR
When it comes to fog in north India, the large number of flight cancellations helps keep the spotlight irmly on New Delhi. But a new study suggests that the national capital region may not be the area most affected by the phenomenon. The frequency of fog occurrences has increased in the past 15 years in the eastern parts of the Indo-Gangetic plains -including eastern UP, Bihar, West Bengal, Bang adesh, as well as the Nepal Terai -but not in the western parts including Delhi, according to a satellite data analysis by IIT-Bombay researchers led by Ritesh Gautam.
The new findings are surprising because previous research has shown an increase n fog frequency over Delhi and surrounding areaslinked to a rise in humidity and pol ution. By contrast the new study , which was presented at the American Geophysical Union conference in December, found high year-to-year variability in fog occurrence over the Delhi region --linked to variability in weather conditions --but no longterm rise in the past decadeand-a-half.
Gautam, an assistant pro essor at IIT's centre of studies in resources engineering and climate studies, said the divergence could be because most other studies have relied on visibility measurements.
“When the visibility falls to less than one-km, it is classified as fog,“ he said. “But it might just be polluted haze.“
Satellite data has its own limitations. But Gautam said that the team had also found corroborative trends in surface data from 2000-2015.
The increase in fog over the eastern region coincided with a rise in pollution, the IIT analysis also found. Other studies have also shown a ink between increasing winter-time pollution and fogginess. Pollution particles, especially those known as aerosols, attract water vapour, promoting the formation of fog droplets.
In this case, Gautam suggested that the westerlies -winds flowing from north west of India -transport pol lution eastwards, leading to an accumulation over the eas tern Indo-Gangetic plains.
The findings point to the need for broadening fog study beyond the capital region Gautam said. “Although most of north India experiences fog and pollution in winter the focus is mostly on Delhi,“ said the former Nasa resear cher. “There should be incre ased focus over both urban and rural locations in nort hern India.“
Interestingly , a previous study by Gautam's team fo und holes in the fog cover over Delhi and other cities. This could be due to higher tempe ratures from urban heat is lands, the study suggested.
These studies stem from IIT-Bombay's Fog South Asia initiative (fogsoutha sia.com), a satellite monito ring system for fog detection being developed to aid the go vernment in forecasting and transport management.
The initiative is part of a slew of new efforts to decip her an important yet under studied phenomenon in So uth Asia, including the role played by air pollution.
In December, the Indian Meteorological Department and the Indian Institute of Tropical Meteorology started a five-year study of fog in Delhi. The same month, a regional fog study was launched by the International Centre for Integrated Mountain Development (ICIMOD), an intergovernmental think-tank based in Kathmandu. The project is being conducted with the collaboration of scientists across India, Pakistan, Bhutan, Nepal and Bangladesh.
“The issue of fog is such that it cannot be studied locally and thus needs regional cooperation,“ said Bhupesh Adhikary , air quality specialist at ICIMOD.
The project involves collecting pollution and meteorology data in various locations along with satellite-based data, to understand the chemical science. “At the same time, we are also collecting data in small villages to try to understand the social dimension,“ Adhikary said.
While there is no scientific evidence yet about fog in the Nepal Terai, the public perception is that fog is getting more intense and lasts longer, he added.
“Existing forecasting models are from the US and don't show us the entire picture,“ said Sachin Ghude, the IIT-M coordinator for the Delhi campaign, which plans to collaborate with IIT-Bombay .“The goal,“ he said, “is to improve our understanding and fine-tune our models.“
Fuels that are cleaner, more efficient
2000-19: progress made
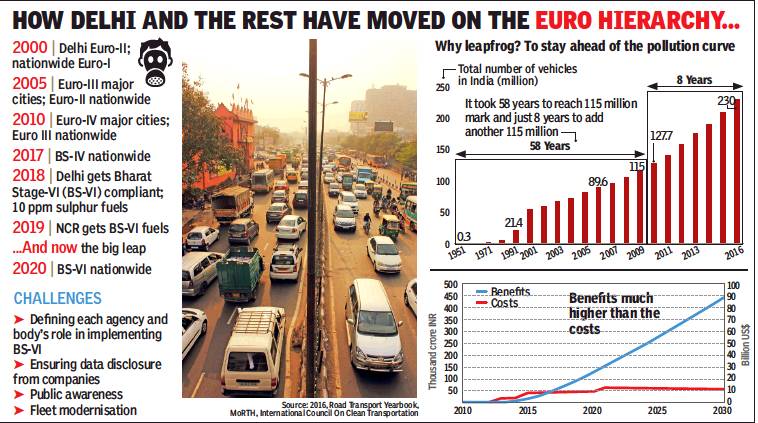
From: Jasjeev Gandhiok, April 9, 2019: The Times of India
See graphic:
2000-19: progress made in Delhi and elsewhere in India towards Euro and BS fuel standards
March 2018/ Delhi, first city in India to run on Bharat Stage-VI (BS-VI) fuel
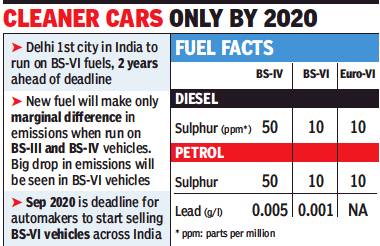
From: Sanjay Dutta, Delhi quietly becomes first city running on BS-VI fuel, March 27, 2018: The Times of India
Benefit Partial As Engines Yet To Be Upgraded
If you live in Delhi, you may have felt your car engine running a tad more smoothly of late. The reason is that, unknown to motorists, Delhi has already switched to Bharat Stage-VI (BS-VI) fuels, ahead of the scheduled April 1 launch for the capital.
State-run fuel retailers have been pushing cleaner petrol and diesel — similar to, but not exactly the same, as Euro-VI fuels — since February to flush supply pipelines and tanks at petrol pumps. Almost all the 397 petrol pumps in the capital are selling BS-VI fuels.
This makes Delhi the first city in the country to run on BS-VI fuels, two years ahead of the 2020 deadline the Centre had set for rolling out cleaner fuels across the country. The decision to jump the deadline for Delhi was taken in November when smoke from burning of crop stubble by farmers in neighbouring states choked the capital. The blame was also put on vehicular emissions, especially from ill-maintained commercial vehicles with old engines crowding the city.
Amid a public outcry over the capital’s poor air quality, oil minister Dharmendra Pradhan stepped in by ordering state-run fuel retailers to supply BS-VI fuels in Delhi from April 1, 2018 and examine introducing these fuels in NCR by April 2019.
Oil company executives claimed that BS-VI fuels will have “better” emission than vehicles running on CNG. But auto experts said introducing BS-VI fuels without the vehicles tuned for such fuels will only yield partial benefit since these will be used by vehicles with BS-IV or BSIII engines plying on Delhi’s roads. Currently, only Mercedes sells BS-VI cars, while the certification process is on for other auto manufacturers.
Why using BS-VI fuel in BS-IV engines won’t give you full benefit
B S-IV diesel has 50 ppm (parts per million) sulphur, while BS-VI will have 10 ppm. So, using BS-VI fuel in BS-IV engines will not hurt performance but will also not give you the full benefit,” an engineer working with an auto company said requesting anonymity.
The Saumitra Chaudhuri report, the forebearer of fuel quality standards, had in 2014 projected an increase of 70-80 paise per litre — at costs and taxes prevailing then — in the price of cleaner fuels. Dealers told TOI they are yet to hear from the oil companies on whether prices will rise after April 1 or not. But with the daily fuel price revision, oil companies can stagger any upward revision required due to the quality upgrade as it can be subsumed into the routine increase because of global oil prices.
Transport minister Nitin Gadkari had in January 2016 persuaded the government to leapfrog to BS-VI by 2020, skipping the BS-V stage throughout the country.
In November, the Society of Indian Auto Manufacturers (SIAM) had welcomed the move to advance the introduction of BS-VI fuels in Delhi, saying it was in line with international practices where the higher grade of fuel is generally introduced a couple of years before higher emission standards for vehicles kick in.
“Early introduction of BS-VI fuel gives confidence to the auto industry that these will be available across the country from April 1, 2020,” a SIAM statement had quoted its president Abhay Firodia as saying. It could be another story for automakers who may find it difficult to start supplying vehicles with BS-VI engines at such a short notice, should the government pressure them to do so.
Union transport minister Nitin Gadkari had in January 2016 persuaded the government to leapfrog to BS-VI by 2020, skipping the BS-V stage throughout India
Global ramifications of India’s pollution
The Arctic sea/ 2020
Chandrima Banerjee, March 2, 2021: The Times of India
Last year, a study found that 75% of aerosol absorption over the Indo-Gangetic plains and the Himalayas comes from black carbon, or soot. It was alarming that pollutants from the plains were reaching all the way to the mountains.
Also last year, the Arctic sea ice shrunk to its lowest in eight years and nearly half of what it was just four decades ago. Every decade, it is losing 13% of its ice.
Scientists have now found what links the two — an 8,500-km expressway that takes soot straight from the heart of north India over central Asia to the icy expanse of the Arctic in just seven days.
A new study by researchers from the Finnish Meteorological Institute, the University of Washington and the National Oceanic and Atmospheric Administration in Washington DC has found that Asian — specifically, Indo-Gangetic — emissions explain much of the black carbon “events” over the Arctic.
Black carbon makes Arctic ice darker, absorb more light
It is a combination of high pollution levels at the source and a pathway that does not dilute or remove the atmospheric pollutants before entering the Arctic,” lead author John Backman from the Finnish Meteorological Institute told TOI. “For example, a more direct and drier route would transport more particulate air pollution from A to B compared to a longer route with more precipitation from that very same A to B.” What black carbon does is it sticks to the surface of ice and turns it darker. The reflective surface, which would under normal circumstances bounce off sunlight, then starts absorbing more light. That sunlight turns into heat, its surface temperature starts increasing and the ice starts melting. “The Arctic is particularly sensitive to changes in surface temperature, and increases in surface temperature are coupled to sea ice extent,” the paper said. “Because black carbon is so destructive for the Arctic climate, it is essential to understand (its) properties, transport to, and concentrations in the Arctic.”
So, data from six stations in the Arctic — Alert, Barrow, Pallas, Summit, Tiksi and Zeppelin — were collected over a period of three years. “A model was used to calculate a path the air had travelled before arriving at the station. This path was calculated backwards in time using meteorological data from another model,” Backman said. “By combining a path the air had travelled with measured concentrations of pollutants we could construct a map showing which levels of pollutants had come from where.”
2005> 2017
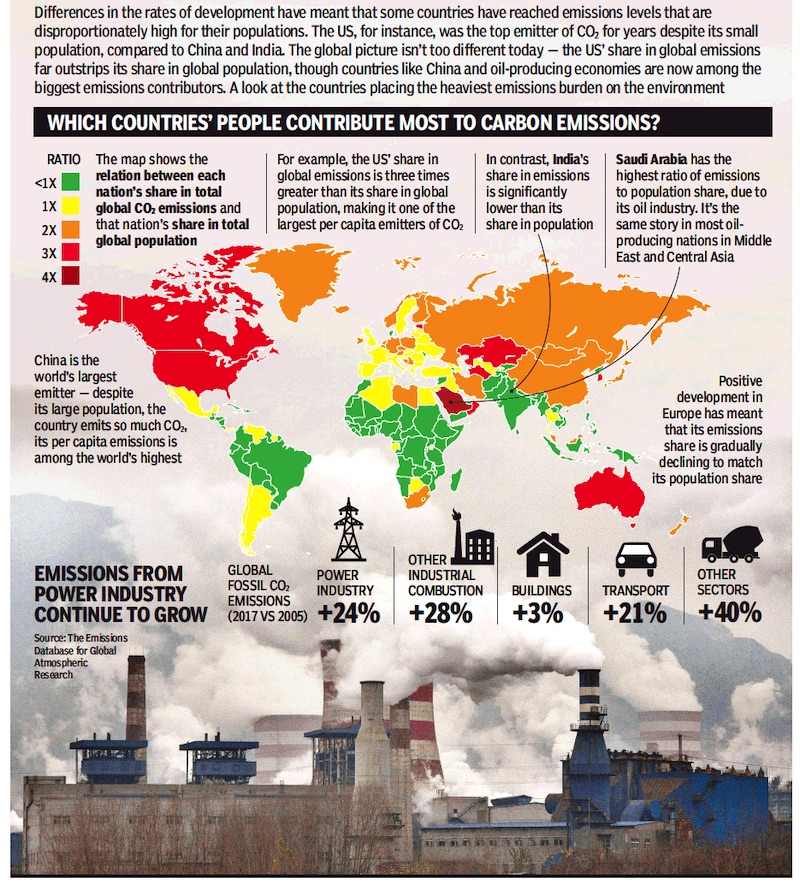
From: Sep 28, 2019: The Times of India
See graphic:
The carbon footprints of the people of various countries.
Government efforts
Government funding
2020- 21
Vishwa Mohan, March 12, 2020: The Times of India
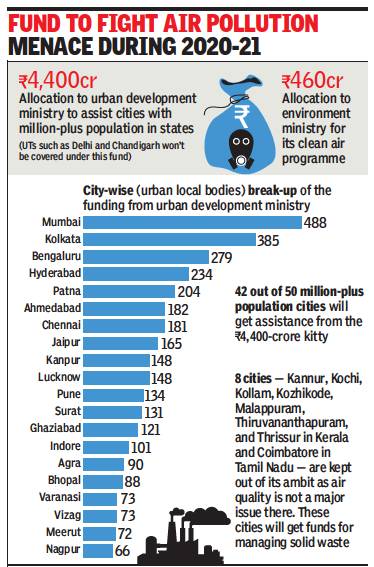
From: Vishwa Mohan, March 12, 2020: The Times of India
As the government works on a mechanism to assist big cities in battling air pollution, Mumbai is set get the highest grant of Rs 488 crore from the Centre’s Rs 4,400 crore fund which is earmarked exclusively for cities with more than one million population in states to improve air quality during 2020-21. Delhi may miss this assistance despite figuring among the most polluted cities in the country as the fund would only be meant for ‘million plus’ population cities.
The national capital, will, however continue to get support from the National Clean Air Programme (pollution control scheme) of the environment ministry and other schemes of the agriculture ministry to deal with stubble-burning. Under the pollution control scheme, the environment ministry has, however, been allocated just Rs 460 crore for 122 ‘non-attainment’ cities.
Non-attainment cities are those which do not meet the national ambient air quality standards. At Rs 488 crore, share of Mumbai local body will be higher than the total money (Rs 460 crore) earmarked for the entire NCAP of the environment ministry. Besides NCAP, the Centre has in its budget for 2020-21 allocated Rs 4,400 crore for taking up clean air measures in ‘million plus’ cities.
Forty-two of 50 such cities will get assistance from the fund. After Mumbai, the second highest amount from the urban development ministry’s fund will be allocated to Kolkata (Rs 385 crore).
Greenhouse gases
Health issues
This section is in two parts
ISSUES
Life expectancy
Pollution reduces life by 10 years/ 2017?
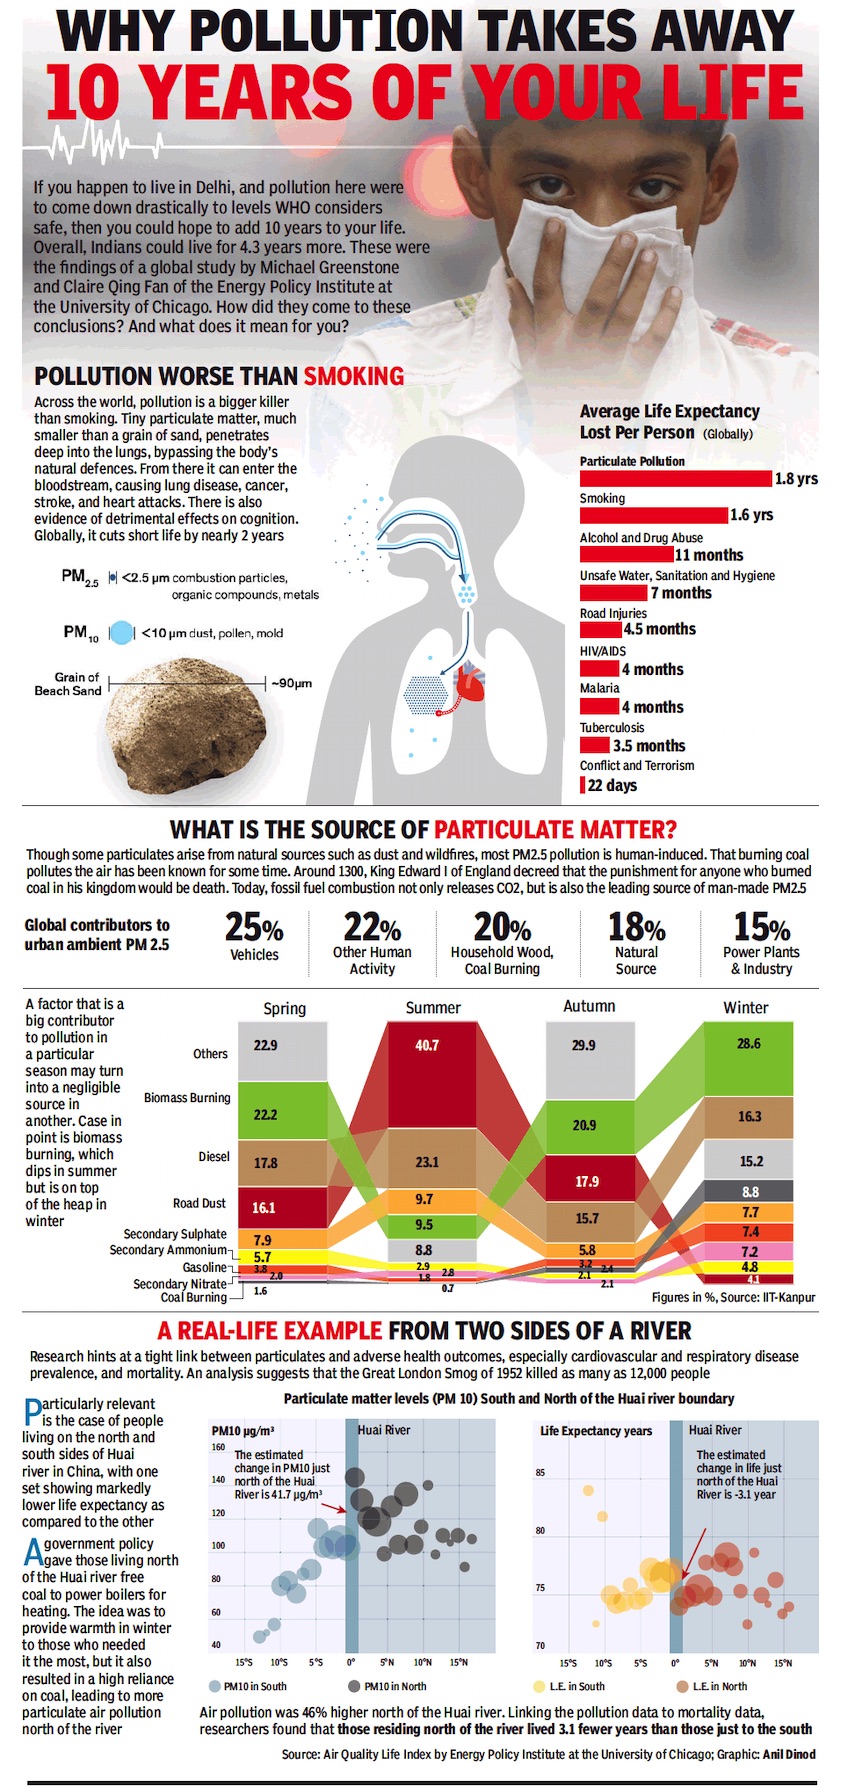
From: November 21, 2018: The Times of India
See graphic:
Why pollution reduces life by 10 years
A 2019 study
Jasjeev Gandhiok, Sep 2, 2021: The Times of India
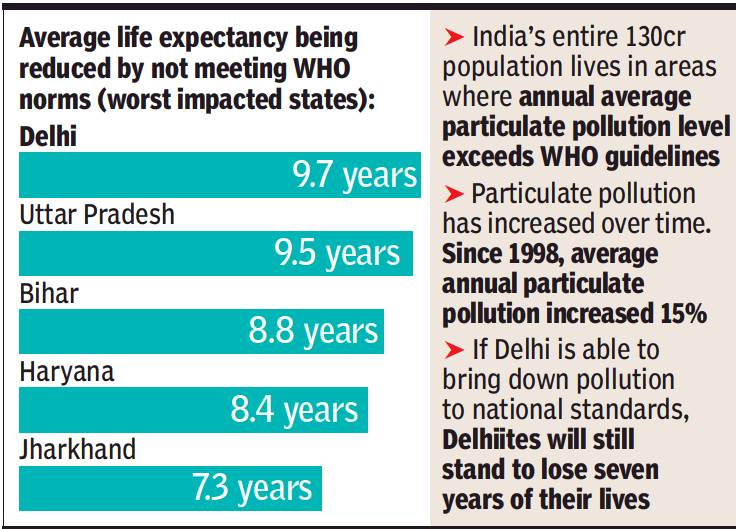
From: Jasjeev Gandhiok, Sep 2, 2021: The Times of India
India’s air pollution problem is now not just limited to the Indo-Gangetic plains, but has increased geographically as well, with states such as Maharashtra and MP seeing people lose an additional 2.5 to 2.9 years of life expectancy due to air pollution, the annual Air Quality Life Index report from the University of Chicago reveals, reports Jasjeev Gandhiok.
It finds people in north India are still the worst hit by air pollution, with 510 million losing an average of 8.5 years of their life if 2019 pollution levels persisted. In terms of states, Delhi is still the most impacted, with the average person losing 9.7 years of life as compared to average life expectancy.
If air meets national standard, Delhiites will still lose 7 years
Delhi is still the most impacted, with the average person losing 9.7 years of life as compared to average life expectancy if WHO standards were being met, with Uttar Pradesh in second (9.5 years). If Delhi was able to bring down pollution to the national standards, Delhiites would still stand to lose seven years of their life. The annual average for PM 2.5 is 40 micrograms per cubic metre. The study, which analysed air pollution data from 1998 until 2019, also finds that while Delhi overall ranks as the worst state, Uttar Pradesh has the most polluted cities, with the PM 2.5 concentration in Allahabad and Lucknow 12 times the WHO guidelines. Residents of both these cities stand to lose on an average 11 years of their life.
“During a truly unprecedented year where some people who are accustomed to breathing dirty air, experienced clean air, it became acutely apparent the important role policy has played and could play in reducing fossil fuels that contribute both to local air pollution and climate change,” said Michael Greenstone, the Milton Friedman Distinguished Service Professor in Economics and creator of the AQLI along with colleagues at the Energy Policy Institute at the University of Chicago (EPIC). “The AQLI demonstrates the benefits these policies could bring to improve our health and lengthen our lives,” Greenstone added.
The AQLI is a pollution index that translates particulate air pollution into the expected impact on life expectancy. Developed by the University of Chicago’s Milton Friedman Distinguished Service Professor in Economics Michael Greenstone and his team at the Energy Policy Institute at the University of Chicago (EPIC), it quantifies the causal relationship between long-term human exposure to air pollution and life expectancy by combining hyper-localised, global particulate measurements.
The report states South Asia is home to the most polluted countries on earth, with Bangladesh, India, Nepal, and Pakistan accounting for nearly a quarter of the global population and consistently ranking among the top five most polluted countries in the world.
‘One of 3 schoolkids in Delhi has asthma’
Nearly one out of every three schoolchildren in Delhi has asthma and airflow obstruction. In comparison, only 23% children living in cities like Kottayam and Mysuru have respiratory health issues, a group of experts has claimed on the basis of a study that assessed the respiratory health of students in three cities by using a questionnaire and lung function test.
India led world in pollution deaths
Sushmi Dey, May 18, 2022: The Times of India
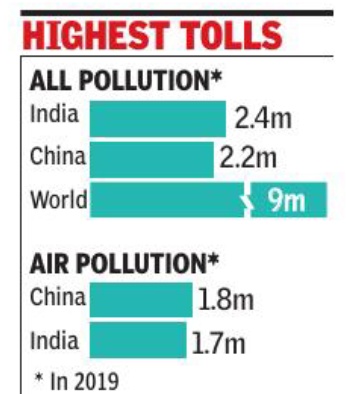
From: Sushmi Dey, May 18, 2022: The Times of India
New Delhi:Pollution led to nearly 2. 4 million (24 lakh) premature deaths in India in 2019, accounting for over a fourth of the nine million such fatalities worldwide, an update to The Lancet Commission on Pollution and Health published in The Lancet Planetary Health said, reports Sushmi Dey.
Economic losses from modern forms of pollution — including ambient air and toxic chemical —now amount to at least 1% of the country’s GDP, it added While ambient air pollution alone may have led to nearly 1. 7 million deaths in India in 2019, fatalities attributed to the traditional sources of pollution — household air, and water — have steadily dropped to less than half of the number in 2000.
Winters: PM2.5 Takes Greater Toll
Priyangi Agarwal, July 10, 2021: The Times of India
A study conducted by IIT-Delhi has revealed that there is a 0.52% increase in nontrauma all-cause mortality for every 10 micrograms per cubic metre (μg/m3) rise in shortterm PM2.5 exposure (six days) in Delhi. The impact of PM2.5 is almost two-fold higher in winter than summer.
Published in the peer-reviewed journal Atmospheric Environment, the study stated that the impact was higher in men (0.57%) than women (0.52%) in Delhi. “The impact was higher in winter than summer due to combined factors like meteorological, locational and anthropogenic. Winter witnesses the highest PM2.5 peaks due to long episodes of poor air quality,” said Dr Pallavi Joshi, Centre of Atmospheric Sciences, IIT-Delhi, one of the researchers of the study.
“According to WHO guidelines, the annual average should be 10 μg/m3, whereas in Delhi the median value was 108 μg/ m3,” added Joshi.
The other researchers were Sagnik Dey from Centre of Excellence for Research on Clean Air, Kuldeep Dixit and Rohit Kumar Choudhary from IIT-Delhi, Santu Ghosh from St John’s Medical College, Bengaluru, Harshal Ramesh Salve from AIIMS and Kalpana Balakrishnan from Sri Ramachandra Institute of Higher Education and Research, Chennai.
The impact of acute exposure to PM2.5 on all-cause mortality was larger than that of PM10 exposure. “This was the first such attempt in estimating the effect of acute exposure to PM2.5 on daily mortality in India using satellite-based exposure data. Our study estimates that PM2.5 exposure was three times higher than the previous effect estimates for PM10 exposure in Delhi done in the past,” said one of the researchers.
The study used city-level daily average PM2.5 concentration to estimate the acute effects of ambient exposure on daily all-cause non-trauma mortality in Delhi from 2013-2017. In terms of meteorological conditions, the daily average temperature during the study period ranged from 7.9 to 39.9 degrees Celsius, while relative humidity was from 20.2% to 99.4%. The daily mortality data was collected from the headquarters of the corporations in Delhi.
The data suggested that interventions during the peak season can result in substantial health benefits. Policymakers can use it to undertake various mitigation measures under the National Clean Air Programme.
YEAR-WISE DEVELOPMENTS
1998> 2018
Jasjeev Gandhiok, July 29, 2020: The Times of India
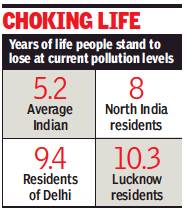
From: Jasjeev Gandhiok, July 29, 2020: The Times of India
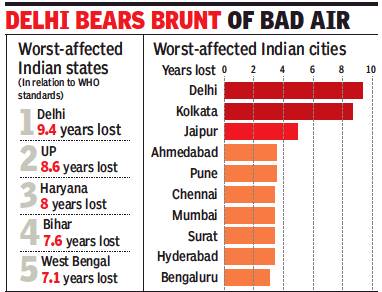
From: Jasjeev Gandhiok, July 29, 2020: The Times of India
India has the second-worst air quality in the world that is cutting short the average life expectancy of Indians by 5.2 years — behind only 6.2 years of Bangladesh residents — with particulate pollution having risen 42% since 1998, says a new analysis.
According to the study by University of Chicago through its Air Quality Life Index that took the 2018 pollution levels as base, the average Delhiite is losing 9.4 years of life. That’s the human cost of the city failing to meet the WHO’s air quality norm. By even meeting the national standard, Delhiites will gain 6.5 years.
‘Fight bad air like you’re fighting Covid’
As many as 84% of Indians live in areas that exceed the country’s own air quality standard — 40 micrograms per cubic metre — and the entire population is exposed to levels that exceed the World Health Organization (WHO) standard of 10 micrograms.
As a result, an average Indian sees her life cut short by more than five years in relation to what it would have been if the WHO standard was met, while it is shortened by 2.3 more years compared to the national standard.
According to the study, a quarter of India’s population is exposed to pollution levels not seen in any other country. Between 1998 and 2018, Indians, on average, lost 1.8 years of their life span, it adds.
The study says 248 million residents of north India are likely to lose more than eight years of life in the current scenario. Lucknow in Uttar Pradesh has the highest level of pollution in the country — 11 times more than the WHO norm. At this rate, its residents stand to lose 10.3 years of their life. The findings also indicate that in states like Bihar and West Bengal, people can add more than seven years to their life if air quality meets the WHO guidelines, while the count will be eight years in Haryana.
“Though the threat of novel coronavirus deserves every bit of attention it is receiving, embracing the seriousness of air pollution with a similar vigour will allow billions of people around the world to lead longer and healthier lives,” said Michael Greenstone, the Milton Friedman Distinguished Service Professor in economics and creator of AQLI along with colleagues at Energy Policy Institute at University of Chicago.
“The reality is, no shot in the arm will alleviate air pollution. For a country like India, the solution lies in a robust public policy. AQLI tells citizens and policymakers how particulate pollution is affecting them and their communities and can be used to measure the benefits of policies to reduce pollution,” he added.
2010, death of 2 people every minute
`Bad air kills two Indians every minute', Feb 20, 2017: The Times of India
Feb 20, 2017: The Times of India
Air pollution is killing two people in India every minute with the country's environment turning more toxic by the day , says a new study published in the journal `The Lancet'. According to the study , some of the worst polluted cities of the world are in India.
The study , released in Feb 2017 but based on 2010 data, week but based on 2010 data, estimates that, globally , 2.73.4 million preterm births may be associated with exposure to PM 2.5. South Asia, with 1.6 million preterm births, is the worst hit, the study adds.
Released by 48 leading scientists, the study adjudged Patna and New Delhi the world's worst polluted cities by levels of PM 2.5, micro particles that can enter the bloodstream and damage the respiratory system.
The study says even safe level of air pollution in harmful
The report also adds that household air pollution that results from use of solid fuels and other biomass contributes to around 4.3 million deaths annually
In the report, Patna and Delhi figure among the most polluted cities, both having an annual PM 2.5 concentration of more than 120 micrograms per cubic metres — about 12 times the WHO guideline. The WHO annual PM 2.5 guideline is 10 micrograms per cubic metres. This IEA report had sourced data from the World Health Organisation (WHO's) urban air quality database of 2016.
"An estimated 18,000 people die every day because of exposure to ambient and household air pollution, making it the world's largest single environmental health risk. Ambient air pollution is particularly pertinent in urban areas, but it also affects non-urban populations," the Lancet Countdown states.
"About 80% of people living in urban areas around the world are exposed to air pollution levels in excess of WHO guidelines. This number rises to 98% for urban populations in low-income and middle-income countries," the countdown states.
The report also adds that household air pollution that results from use of solid fuels and other biomass contributes to around 4.3 million deaths annually, which are related to pneumonia, stroke, lung cancer, heart disease, and chronic obstructive pulmonary disease (COPD).
The Lancet Countdown will report annually in The Lancet journal. The institutions involved in the project includes bodies such as University College London, Tsinghua University and the Centre for Climate & Security among others. They have collaborated with the World Health Organization (WHO) and the World Meteorological Organisation (WMO) too. The report underlines that air pollution and climate change are related and addressing air pollution will have climate change benefits too.
2010s
Vishwa Mohan, August 30, 2023: The Times of India
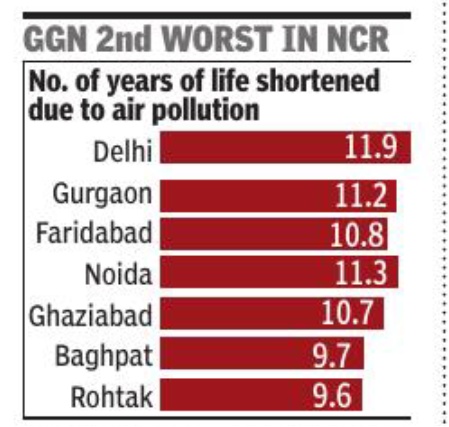
From: Vishwa Mohan, August 30, 2023: The Times of India
New Delhi: Fine particulate air pollution (PM2. 5) is estimated to shorten an average Indian’s life span by 5. 3 years and in Delhi, often labelled the most polluted city in the world, by as much as 11. 9 years when compared to the WHO standards of 5micrograms per cubic metre (µg/m3), according to an updated Air Quality Life Index (AQLI) released by the Energy Policy Institute at the University of Chicago (EPIC). However, an average Indian could lose 1. 8 years of life expectancy and a Delhi resident up to 8. 5 years if the country’s national ambient air quality standards (40 µg/m3) are not met, says the report.
The Index, based on WHO standards factoring annual average PM2. 5 levels, shows many areas of India — the second most polluted in the world after Bangladesh — faring badly with air pollution shortening lives by 11. 2 years in Gurgaon, 10. 8 years in Faridabad, 10. 1 years in Jaunpur (UP), 9. 7 years each in Lucknow and Kanpur, 9. 2 years in Muzaffarpur (Bihar), 8. 8 years in Prayagraj (UP) and 8. 7 years in Patna.
The report flags that all of India’s over 1. 3 billion people live in areas where annual average particulate pollution level exceeds WHO standards while 67. 4% live in areas that exceed the country’s own national air quality standards.
2012-14: Cases increase, deaths decrease
The Times of India, Sep 23 2015
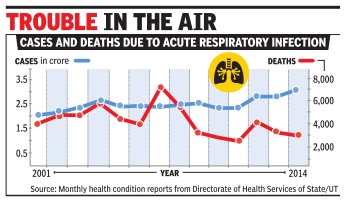
Sushmi Dey
Respiratory disease cases rose by 5m since 2012: Govt
Air pollution may be posing a rising health risk in India as the number of cases of acute respiratory infection (ARI) have risen by five million since 2012 even though deaths have declined in the same period, government data released on Tuesday evening shows. Cases of ARI have been rising even before 2012, though deaths began to decline since that year.
The government report notes the strong association between air pollution and respiratory diseases. While ARI cases rose by five million, deaths due to the condition reduced marginally . As many as 2,932 people died due to ARI in 2014, as against 3,513 in the previous year, according to the `National Health Profile 2015' released by health minister J P Nadda. The report's profile stated that air pollution leads to a wide array of health effects, of which ARI “has accounted for the maximum number of cases“ while noting that “over the years, ARI cases are showing an increasing trend“.
The increasing trend in number of ARI cases is clear ly discernible since 2011. The National Health Profile 2015, published by the Central Bureau of Health Intelligence (CBHI), covers demographic, socio-economic, health status and health finance indicators, along with comprehensive information on health infrastructure and human resources in health.
Around 3.5 crore ARI cases were reported in 2014, out of which 1.7 crore were females and 1.8 crore were men, the data shows. TOI had earlier reported that on an average, more than 2.6 crore cases of ARI were reported in India ev ery year, whereas over 35,000 people died due to the air pollu ion-linked disease in close to 10 years. The data was presented by the environment minis ry to Parliament during the monsoon session this year in a rare official admission that pollution could be causing deaths on a large scale.
However, global studies have attributed far more deaths o air pollution in India. A WHO assessment, reported by TOI in May , showed India and China as worst-hit countries compared to the global average of deaths due to air pollution. It also noted that pollution is sharply increasing in develop ng countries leading to various serious health problems.
In Delhi, close to 3,39,506 ARI cases and 104 deaths were reported in 2014. However, deaths due to the disease in UP and Bengal were much higher, at 619 and 625, respectively.
2013: 1.4 million lives lost
The Times of India, Sep 09 2016
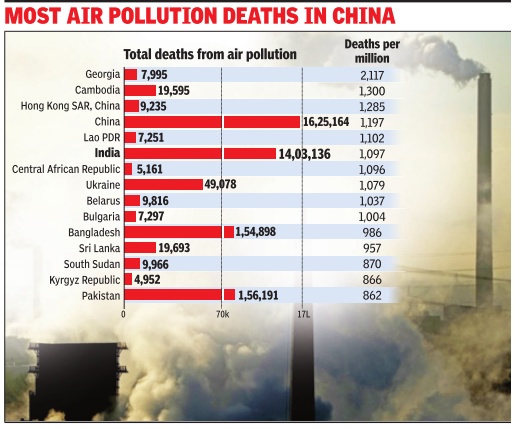
Atul Thakur
1.4m lives lost in India due to air pollution in 2013: Study
India lost 1.4 million lives to air pollution in 2013, while in China the toll was 1.6 million, estimates a World Bank report released. The report, released by the World Bank and the Institute for Health Metrics and Evaluation, shows that in 2013 more than five million deaths worldwide were attributed to health conditions caused by air pollution. About 60% of them were in the world's two most populous countries.
Exposure to air pollution increases a person's risk of contracting ailments such as lung cancer, stroke, heart disease and chronic bronchitis.
China and India aren't among the worst hit in absolute terms because of the sheer size of their respective populations. Even after adjusting for population, these two countries along with Bangladesh, Sri Lanka and Pakistan were among the 15 nations with the highest toll per million population.
China and India ranked 4th and 6th worst in the world respectively . Bangladesh, Sri Lanka and Pakistan were ranked 11th, 12th and 15th on this count.
The bank estimates that in 2013 Georgia saw the highest rate of air pollution deaths per million of its population at 2,117. It was fol lowed by Cambodia with a death rate of 1,300 per million.
Among the 142 countries for which the bank complied this data, there were 10 where the rate was higher than 1,000 deaths per million. Australia fared best on this parameter with an estimated death rate of 34 per million.
The report also estimat ed that air pollution cost the world economy more than $5 trillion -purchasing power parities (PPP) at 2011 prices -in welfare losses and an additional $66 billion worth of manpower loss.
China's overall welfare and manpower loss was $1.6 trillion while India lost more than $560 billion, which was equivalent to over 10% of China's and 8.5% of India's GDP .
Air pollution is estimated to be the fourth leading fatal health risk worldwide after metabolic risks, dietary risks and tobacco smoke. The estimates are based on exposure to PM2.5 pollutants. It is noticeable in the report that the risks are much higher in the developing world.
By damaging people's health and causing fatal diseases, air pollution can have a lasting effect on a person's economic productivity .
Experts argue that typically the economically weakest section is the worst hit because of limited access to health care facilities. Thus, exposure to bad air quality and other risks will ultimately widen the existing economic inequalities, they say.
2013-14: Report "Hidden Price Tags/ impact on health"
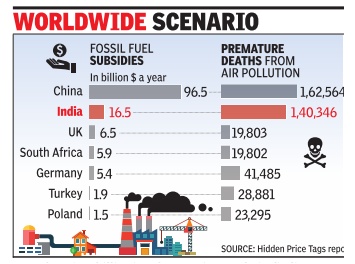
Cost To Fight Such Diseases Stands At Rs 141 Billion: Report
India spent $16.9 billion on oil, gas and coal subsidies in 2013 and 2014 but the health costs to meet the burden of air pollution-linked diseases was eight times more at $140.7 billion, says a report by an European environmental non-profit organisation.
The Health and Environment Alliance (HEAL) assessed the spending of seven economically powerful countries on fossil fuel subsidies, and the health costs associated with fossil fuel subsidies.
The report, `Hidden Price Tags', said India can provide 375 million households with solar lamps or train nearly 32,000 extra doctors for rural areas with its annual spend on fossil fuels subsidies. This was assessed considering that each solar lamp costs about $22.5 and the recent estimate of All India Institute of Medical Science which put the cost of training a doctor at Rs 1.7 crore. The subsidy amount could fund 24% of the total money needed to implement healthcare coverage for all Indians, the report suggests.
Making a case for spending fossil fuel subsidy money on public health instead, the report released on Thursday claimed that G20 governments spent about $444 billion in subsidies to fossil fuel companies in 2014, but the health costs of these subsidies in the form of respiratory and cardiovascular diseases, as well as premature deaths, were as high as $2.76 trillion, six times the subsidy amount.
The report calls for reallocation of fossil fuel subsidies because they increase the price gap between fossil fuels and renewables, which makes fossil fuels seem cheaper and discourages investment in green energy .
HEAL has used a combination of data provided by the International Monetary Fund (IMF), the Overseas Development Institute (ODI) and Oil Change International (OCI) to arrive at their findings. For subsidy estimates, data from ODI and OCI were used for 2013 and 2014, which includes national subsidies delivered through direct spending and tax breaks, investments by state owned enterprises and public finance from government owned banks.
On India's spending on fossil fuel subsidies, researchers from the Public Health Foundation of India (PHFI), who drafted the India chapter, noted that two-thirds of electricity in India continues to be generated from coal, one of the biggest contributors to air pollution. Liquefied Petroleum Gas (LPG) and kerosene were also subsidised.
The report said not all fossil fuels are bad. In fact, LPG has significant health benefits when used to substitute biomass or coal as cooking fuel.“About 400 million households have been helped to make the switch from burning solid fuels to the healthier LPG option with the help of subsidy schemes since 1980.
But population growth has resulted in over two-thirds of households burning highly carbon-emitting biomass fuels for cooking with resulting health impacts,“ the report states. That India has ambitious renewable energy targets of meeting over 50% of installed power capacity with renewable energy by 2027 is encouraging, authors said.
On kerosene, the authors noted that “as much as half of the subsidised kerosene is simply sold on the black market since it can be used in diesel engines.“ Kerosene is “poor man's fuel“ used by millions of households in rural India to meet basic lighting needs. Government subsidies make the fuel more affordable.They said kerosene smoke is rich in black carbon and kerosene poisoning among children remains a concern. China spent about $96.5 billion on fossil fuel subsidies and its associated health costs are $1,785.4 billion, 19 times the subsidy amount.
2015: Pollution killed 2.5m people in India
Oct 21, 2017: The Times of India
HIGHLIGHTS
Environmental pollution is killing more people every year than all war and violence in the world.
One out of every six premature deaths in the world in 2015 — about 9 million — could be attributed to disease from toxic exposure.
The greatest numbers of deaths linked to pollution in 2015 were in India with 2.5 million, and China with 1.8 million.
NEW DELHI: Environmental pollution — from filthy air to contaminated water — is killing more people every year than all war and violence in the world. More than smoking, hunger or natural disasters. More than AIDS, tuberculosis and malaria combined.
One out of every six premature deaths in the world in 2015 — about 9 million — could be attributed to disease from toxic exposure, according to a major study released on Thursday in The Lancet medical journal. The financial cost from pollution-related death, sickness and welfare is equally massive, the report says, costing some $4.6 trillion in annual losses — or about 6.2 percent of the global economy.
"There's been a lot of study of pollution, but it's never received the resources or level of attention as, say, AIDS or climate change," said epidemiologist Philip Landrigan, dean of global health at the Icahn School of Medicine at Mount Sinai, New York, and the lead author on the report.
The report marks the first attempt to pull together data on disease and death caused by all forms of pollution combined. "Pollution is a massive problem that people aren't seeing because they're looking at scattered bits of it," Landrigan said. The study found pollution was linked to around nine million deaths in 2015.
Dirty air - caused by everything from transport and industry to indoor fires - was the biggest contributor linked to 6.5 million deaths, it said. The next biggest was polluted water that spread gastrointestinal diseases and parasitic infections and killed 1.8 million people.
The greatest numbers of deaths linked to pollution in that year were in India with 2.5 million, and China with 1.8 million. Several other countries such Bangladesh, Pakistan, North Korea, South Sudan and Haiti also see nearly a fifth of their premature deaths caused by pollution.
Areas like Sub-Saharan Africa have yet to even set up air pollution monitoring systems. Soil pollution has received scant attention. And there are still plenty of potential toxins still being ignored, with less than half of the 5,000 new chemicals widely dispersed throughout the environment since 1950 having been tested for safety or toxicity.
To reach its figures, the study's authors used methods outlined by the US Environmental Protection Agency for assessing field data from soil tests, as well as with air and water pollution data from the Global Burden of Disease, an ongoing study run by institutions including the World Health Organization and the Institute for Health Metrics and Evaluation at the University of Washington.
Even the conservative estimate of 9 million pollution related deaths+ is one-and-a-half times higher than the number of people killed by smoking, three times the number killed by AIDS, tuberculosis and malaria combined, more than six times the number killed in road accidents, and 15 times the number killed in war or other forms of violence, according to GBD tallies. It is most often the world's poorest who suffer. The vast majority of pollution-related deaths — 92 percent — occur in low- or middle-income developing countries, where policy makers are chiefly concerned with developing their economies, lifting people out of poverty and building basic infrastructure, the study found. Environmental regulations in those countries tend to be weaker, and industries lean on outdated technologies and dirtier fuels.
In wealthier countries where overall pollution is not as rampant, it is still the poorest communities that are more often exposed, the report says.
"What people don't realize is that pollution does damage to economies. People who are sick or dead cannot contribute to the economy. They need to be looked after," said Richard Fuller, head of the global toxic watchdog Pure Earth and one of the 47 scientists, policy makers and public health experts who contributed to the 51-page report.
"There is this myth that finance ministers still live by, that you have to let industry pollute or else you won't develop, he said. "It just isn't true."
The report cites EPA research showing that the US has gained some $30 in benefits for every dollar spent on controlling air pollution since 1970, when Congress enacted the Clean Air Act, one of the world's most ambitious environmental laws. Removing lead from gasoline has earned the US economy another $6 trillion cumulatively since 1980, according to studies by the US Centers for Disease Control and Prevention.
Some experts cautioned, however, that the report's economic message was murky. Reducing the pollution quantified in the report might impact production, and so would not likely translate into gains equal to the $4.6 trillion in economic losses.
The report "highlights the social and economic justice of this issue," said Marc Jeuland, associate professor with the Sanford School of Public Policy and the Duke Global Health Institute at Duke University, who was not involved in the study.
Without more concrete evidence for how specific policies might lead to economic gains, "policy makers will often find it difficult to take action, and this report thus only goes part way in making the case for action," he said.
Jeuland also noted that, while the report counts mortality by each pollutant, there are possible overlaps — for example, someone exposed to both air pollution and water contamination — and actions to address one pollutant may not reduce mortality.
"People should be careful not to extrapolate from the US numbers on net (economic) benefits, because the net effects of pollution control will not be equivalent across locations," he said.
The study's conclusions on the economic cost of pollution measure lost productivity and health care costs, while also considering studies measuring people's "willingness to pay" to reduce the probability of dying. While these types of studies yield estimates at best, they are used by many governments and economists trying to understand how societies value individual lives. While there has never been an international declaration on pollution, the topic is gaining traction.
The World Bank in April declared that reducing pollution, in all forms, would now be a global priority. And in December, the United Nations will host its first-ever conference on the topic of pollution.
"The relationship between pollution and poverty is very clear," said Ernesto Sanchez-Triana, lead environmental specialist at the World Bank. "And controlling pollution would help us address many other problems, from climate change to malnutrition. The linkages can't be ignored."
2015: Deaths attributable to air pollution, India and the world
See graphic:
Deaths per 100,000 people attributable to pollution, 2015
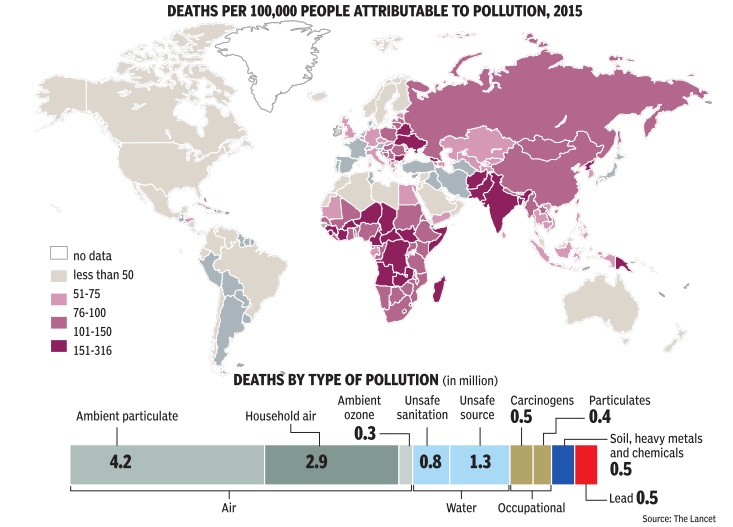
From: The Times of India, October 24, 2017
India accounts for 75% of air pollution casualties in SE Asia
Nine out of 10 people in the world are breathing poor quality air, a new report by the World Health Organisation said calling on countries to take action against air pollution which is causing over six million deaths a year globally .With the use of new interactive maps, the UN agency found 92% of the world's population living in places where air quality levels exceed WHO limits.
India accounts for 75% of the 8 lakh air-pollution related deaths annually in the South East Asia Region, whereas 90% of the world's casualties from poor air quality are in low-and middle-income countries, the maps show identifying specific areas where pollution levels are extremely high.
The UN agency's report said 94% of the pollution-related deaths in lowand middle-income countries are due to non-communicable diseases like cardiovascular diseases, stroke, chronic obstructi ve pulmonary disease, lung cancer. Air pollution also increases the risks for acute respiratory infections.
Over 6 lakh people die in In dia every year of ailments caused from air pollution such as acute lower respiratory infection, chronic obstructive pulmonary disorder, ischemic heart disease and lung cancer.
The report represents the most detailed outdoor (or ambient) air pollution-related health data, by country , ever reported by WHO. The model is based on data derived from satellite measurements, air transport models and ground station monitors for more than 3000 locations, both rural and urban. It was developed by WHO in collaboration with the University of Bath in UK.
According to the report, the problem of air pollution is most acute in cities, but air in rural areas is worse than many think and poorer countries have much dirtier air than the developed world, it said.
Air pollution and premature deaths
As countries become richer, air pollution-related deaths reduce. This is the general trend for most nations except India and China, a report released by Greenpeace has found. The study , which assesses the GDP per capita versus deaths resulting from toxic air, revealed India and China had higher death rates than what is expected of countries with similar per capita GDP .
The report states that air pollution may have caused 1.6 million additional deaths than a projected death number based on GDP growth rate for 2015 in India and China collectively .The report sources the number of such deaths from the Global Burden of Disease report and GDP per capita estimations for all countries from a recent World Bank document.
“Usually , air pollution has an inverse relationship with the GDP . As countries become richer, they generally develop less polluting industries. But in India and China, the trend has been quite the opposite. An economy heavily reliant on coal can only spell doom for its people,“ said Lauri Myllyvirta of Greenpeace East Asia.
Although air pollution death rates have fallen in China and India since 1990, they are still worse than most similar countries. In India, rates have not improved since 2010. In 2015, pollution claimed 138 and 115 lives per 1 lakh people in India and China, respectively .
According to its GDP per capita, the expected death rate in India is 94 per lakh but its death rate remains 138. “So, unlike China, it hasn't yet reached an income level where its air pollution death rate could be expected to be similar to that in rich nations. But in both cases, there is potential for significant improvements in air pollution death rates,“ said Sunil Dahiya of Greenpeace India.
2016: India tops in under-5 deaths due to toxic air, 60,000 killed
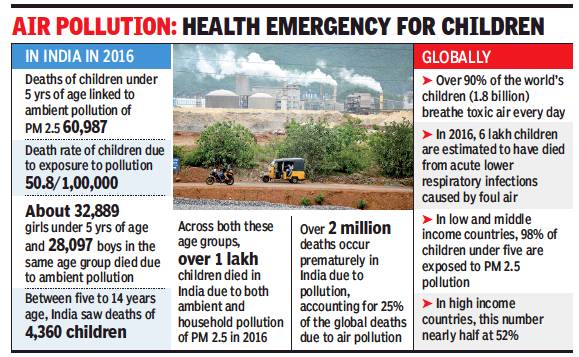
From: Sushmi Dey, India tops in under-5 deaths due to toxic air, 60,000 killed in 2016: WHO, October 30, 2018: The Times of India
‘Air Pollution Killed Over 1L Children In ’16’
India’s toxic air has been linked to the premature deaths of close to 1,10,000 children in 2016, with the country witnessing highest number of deaths of children under five years of age attributed to their exposure to ambient air pollution of particulate matter (PM) 2.5, said a World Health Organisation (WHO) report released on the eve of the first-ever conference on air pollution and health.
As many as 60,987 children of under five years of age in India died because of their exposure to PM 2.5, followed by Nigeria with 47,674 deaths, Pakistan with 21,136 deaths and Democratic Republic of Congo with 12,890 deaths.
In India, the death rate for this age bracket is 50.8 per 1,00,000 children with more girls under the age of five dying than boys due to pollution. About 32,889 girls died, compared to 28,097 boys in 2016, according to the report.
Between five and 14 years, India saw the deaths of 4,360 children attributed to ambient air pollution in 2016. Across both these age groups, over 1 lakh children died in India due to both ambient and household pollution of particulate matter 2.5 in 2016. Particulate matter 2.5 orPM 2.5 are fine dust particles in air which are considered highly harmful for health.
The report, titled ‘Air Pollution and Child Health – Prescribing clean air’, seeks to caution against the rising levels of pollution causing growing burden of diseases as well as deaths.
Over 2 million deaths occur prematurely in India due to pollution, accounting for 25% of the global deaths due to air pollution.
Globally, every day around 93% of children under the age of 15 years (1.8 billion children) breathe air that is so polluted it puts their health and development at serious risk. WHO estimates that in 2016, 6,00,000 children died from acute lower respiratory infections caused by polluted air.
While in low and middle income countries, 98% of children under five are said to be exposed to PM 2.5, in high income countries, this number is almost half at 52%. The report also highlights adverse impact of pollution on pregnant women and children. Pregnant women, exposed to polluted air, are more likely to give birth prematurely, and have small, low birth-weight children, the report says.
“Air pollution is stunting our children’s brains, affecting their health in more ways than we suspected,” said Dr Maria Neira, director, department of public health, environmental and social determinants of health at WHO.
2017: Rate of death higher in India than China
Vishwa Mohan, Feb 15, 2017: The Times of India
Country Can't Continue In Denial: Experts
India has been in denial mode on linking premature deaths to air pollution in the absence of conclusive data, but a new comprehensive global report by two US-based institutes may now trigger a rethink. The report claims the country's worsening air pollution caused some 1.1 million premature deaths in 2015 and it now rivals China in having among the highest air pollution health burdens in the world.
The State of Global Air 2017 report, released in Boston, claims longterm exposure to fine particulate matter (PM2.5) -the most significant element of air pollution -contributed to 4.2 million premature deaths in the world in 2015 where both India and China to gether were responsible for over half of the total global deaths. Though the report sounds alarm bells for entire Asia, it paints a particlularly grim picture for India where the rate of increase of premature deaths due to air pollution is even higher than in China. It noted that while the early deaths related to PM2.5 in China has increased by 17.22% since 1990, it has increased by 48% in India.
Ozone-related early deaths in India are, in fact, 33% higher than those recorded for China. India's deepening pollution problem, which hit home with a vengeance after Diwali last year as Delhi and NCR woke up enveloped in smog that refused to lift for days, has a death toll second only to China's, and together the two nations acount for over half the world's deaths from pollution.
According to the State of Global Air 2017 report, released in Boston, as many as 2.54 lakh deaths occurred in 2015 on account of exposure to ozone and its impact on chronic lung disease.India accounts for the highest number of premature deaths due to ozone pollution, its toll 13 times higher than Bangladesh's, and 21 times higher than Pakistan's.
An interactive website on the report also highlights that 92% of the world's population lives in areas with unhealthy air. “We are seeing increasing air pollution problems worldwide, and this new report and website details why that air pollution is a major contributor to early death,“ said Dan Greenbaum, president of the Health Effects Institute (HEI), the research institute that designed and carried out the study . He said, “The trends we report show that we have seen progress in some parts of the world, but serious challenges remain“.
The report was prepared by HEI in cooperation with the Institute of Health Metrics and Evaluation at the University of Washington and the University of British Columbia. Involving more than 2,000 researchers, the report factored in the role of an extensive set of behavioural, dietary and environmental risk factors for more than 300 diseases in 195 countries from 1990 onwards.
Referring to the findings of the report, Anumita Roychowdhury of the Centre for Science and Environment, said, “India can't afford to remain complacent or in denial. With so many people dying early and falling ill... due to particulate and ozone pollution, it is a state of health emergency . This demands nationwide intervention to ensure stringent mitigation and a roadmap to meet clean air standards“.
2017/ Air pollution shortened lifespan by 30 months
Bindu Shajan Perappadan, April 4, 2019: The Hindu
In India, air pollution is the third-highest cause of death among all health risks: report
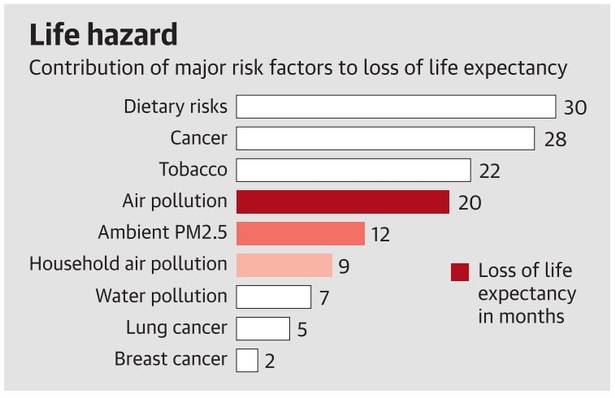
From: Bindu Shajan Perappadan, April 4, 2019: The Hindu
Overall, long-term exposure to outdoor and indoor air pollution contributed to nearly 5 million deaths from stroke, diabetes, heart attack, lung cancer, and chronic lung disease in 2017.
The current high level of air pollution has shortened the average lifespan of a South Asian child by two-and-a-half years while globally the reduction stands at 20 months, according to a global study released on Wednesday.
State of Global Air 2019, published by Health Effects Institute (HEI), said exposure to outdoor and indoor air pollution contributed to over 1.2 million deaths in India in 2017. The report added that worldwide, air pollution was responsible for more deaths than many better-known risk factors such as malnutrition, alcohol abuse and physical inactivity.
In India, air pollution is the third-highest cause of death among all health risks, ranking just above smoking; each year, more people globally die from air pollution related disease than from road traffic injuries or malaria.
In China and India
The study found that China and India together were responsible for over half of the total global attributable deaths, with each country witnessing over 1.2 million deaths from all air pollution in 2017. China has made initial progress, beginning to achieve air-pollution decline.
Overall, long-term exposure to outdoor and indoor air pollution contributed to nearly 5 million deaths from stroke, diabetes, heart attack, lung cancer, and chronic lung disease in 2017.
Out of these, 3 million deaths are directly attributed to PM2.5, half of which are from India and China together. The South Asian region — Bangladesh, India, Nepal and Pakistan — led the world as the most polluted, with over 1.5 million air-pollution related deaths according to the report.
‘Steps taken in India’
“At the same time, India has initiated major steps to address pollution sources: the Pradhan Mantri Ujjwala Yojana Household LPG program, accelerated Bharat Stage 6/VI clean vehicle standards, and the new National Clean Air Programme. These and future initiatives have the potential, if fully implemented as part of a sustained commitment to air quality, to result in significant health benefits in coming years,” said Robert O’Keefe, vice president, Health Effects Institute.
Meanwhile, for the first time, this year’s report and website include worldwide estimates of the effect of air pollution on life expectancy.
Worldwide, air pollution reduced life expectancy by an average of 20 months in 2017, a global impact rivaling that of smoking; this means a child born today will die 20 months sooner, on average, than would be expected without air pollution.
The report also highlighted that nearly half of the world’s population — a total of 3.6 billion people — were exposed to household air pollution in 2017. Globally, there has been progress: the proportion of people cooking with solid fuels has declined as economies develop.
But in India, 60% of the population still uses solid fuels; in Bangladesh that number rises to 79%, underscoring the importance of achieving success in government initiatives to address the problem.
The State of Global Air 2019 annual report and accompanying interactive website are designed and implemented by the Health Effects Institute in cooperation with the Institute of Health Metrics and Evaluation (IHME) at the University of Washington, the University of British Columbia, and the University of Texas, Austin.
2017: India, China had 50% of foul air deaths
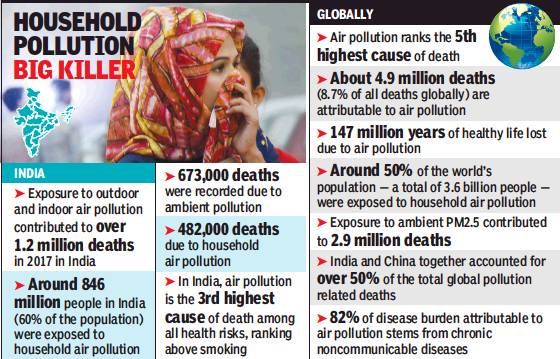
From: Sushmi Dey, At 2.5m, India & China had 50% of world foul air deaths, April 3, 2019: The Times of India
Even as India and China together accounted for over 50% of the total 5 million deaths globally from air pollution in 2017, both countries have initiated significant steps to address the problem that now causes more disease burden than smoking, says a new report on global air pollution by two US-based institutes — Health Effects Institute and Institute for Health Metrics and Evaluation.
Each of the two countries — India and China — registered over 1.2 million deaths in 2017 from air pollution — which includes ambient as well as household air pollution.
On an average, the study — titled State of Global Air 2019 — reported that the life of a south Asian child born today will be shortened by two years and six months (over two years) growing up in prevailing high levels of air pollution.
In India, air pollution is the third highest cause of death among all health risks, ranking just above smoking. Worldwide, air pollution is responsible for more deaths than other risk factors such as malnutrition, alcohol use, and physical inactivity.
While around 82% of the disease burden attributable to air pollution stems from chronic non-communicable diseases, it also contributes to communicable disease.
In 2017, India recorded 6,73,000 deaths and a loss of 21.3 million disability adjusted life years (DALYs) due to long term exposure to ambient air pollution less than the minimal level, whereas 8,52,000 Chinese died of it the same year and had 19.8 million DALYs. Together, the two countries accounted for 52% of the nearly 3 million global deaths and 50% of the DALYs from exposure to ambient air pollution, .
The report states that while China has made initial progress with slight decline in pollution levels, India has initiated major steps to address pollution sources.
It listed the Pradhan Mantri Ujjwala Yojana Household LPG programme, accelerated Bharat Stage 6/VI clean vehicle standards, and the new National Clean Air Programme as some of the steps initiated by the government to reduce both outdoor and household air pollution.
2017-18: Air pollution causes 1 death in 8
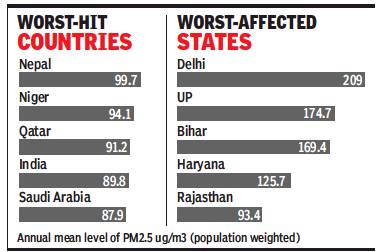
From: Sushmi Dey, Air pollution causes 1 in 8 deaths in India: Report, December 7, 2018: The Times of India
‘Deadlier Than Smoking In Causing Illness’
One in every eight deaths in India is attributable to air pollution, which now contributes to a bigger disease burden than smoking.
In fact, the average life expectancy in India would have been 1.7 years higher if the air pollution level was less than the minimum level, show the first comprehensive estimates of deaths, disease burden and life expectancy reduction associated with air pollution in each state of India, released by Indian Council of Medical Research on Thursday.
Around 77% of India’s population is exposed to outdoor air pollution levels above National Ambient Air Quality Standards safe limit, the report says. States in east and north India had some of the highest levels of ambient particulate matter and household air pollution, especially Bihar, Uttar Pradesh, Rajasthan and Jharkhand. Delhi, Haryana and Punjab had some of the highest ambient particulate matter pollution exposure.
2017, 2019
Sushmi Dey, December 23, 2020: The Times of India
‘Pollution killed 1.7m in India in 2019, behind 18% of all deaths’
NEW DELHI: Air pollution killed nearly 1.7 million people in India in 2019, accounting for an alarming 17.8% of all deaths in the country in the year, a new paper written as a collaborative effort by Indian institutions that include ICMR has said.
The economic loss due to lost output from premature deaths and disease caused by pollution last year was estimated at around Rs 2.6 lakh crore, nearly 1.4% of gross domestic product (GDP) with Delhi suffering the highest per capita loss, followed by Haryana. The health and economic losses are higher than previously estimated.
The study was conducted by the India State-Level Disease Burden Initiativs a collaborative effort involving over 300 researchers from institutions like ICMR, Public Health Foundation of India, Institute for Health Metrics and Evaluation and others and assumes significance as it provides data from across different states for policy-makers. The findings show the per capita economic loss due to air pollution was generally higher in states with high per capita GDP.
“This scientific paper presents the latest evidence on air pollution in India, translating health loss to economic impact. The paper provides a robust assessment of the current situation in each state, and highlights that augmenting the existing air pollution control efforts based on the specific situation of each state would be useful. Air pollution and its impact is not a matter for the health sector alone, and the solutions lie in a multi-sectoral approach,” Niti Aayog member-health Dr VK Paul said.
The economic loss due to premature deaths and illness attributable to air pollution — outdoor and household — as a percentage of state GDP was 1.08% in Delhi. The highest loss to GDP was recorded by Uttar Pradesh at nearly 2.6% followed by Bihar at 1.9% and Madhya Pradesh and Rajasthan 1.7% each.
When it comes to impact of outdoor air pollution alone on state GDP, Delhi recorded a loss of 1.06%. UP still recorded the highest loss to GDP at just over 1.3% followed by Punjab at 1.2%.
Overall, deaths and diseases caused by air pollution are linked to loss of almost 1.4% of India’s GDP, the study shows. While 40% of the disease burden due to air pollution is from lung diseases, the remaining 60% is from ischaemic heart disease, stroke, diabetes, and neonatal deaths related to pre-term birth. While household air pollution is decreasing in India resulting in 64% reduction in the death rate per 1,00,000 population attributable to it from 1990 to 2019, the death rate from outdoor air pollution has increased during this period by 115%.
PHFI’s Lalit Dandona, who is also director of the India State-Level Disease Burden Initiative, said, “Improved methods in this paper have led to a higher estimate of the impact of air pollution on health and disease in India than previously estimated. The health and economic impact of air pollution is highest in the less developed states of India, an inequity that should be addressed.”
He added, “India has many initiatives to reduce air pollution, which can benefit further from the state-specific insights provided in this paper. Investing further in air pollution control will more than return that investment in terms of better health and economic development in India.”
Economic loss
December 23, 2020: The Times of India
Delhi’s per-capita loss due to bad air highest in country, finds study
New Delhi:
Delhi suffered the highest per-capita economic loss due to air pollution last year, according to a study in medical journal Lancet.
For years, northern India — especially New Delhi — has been battling critical levels of air pollution, which have remained consistently in the hazardous mark, for many days at a stretch, during winters. This air pollution has already taken a big toll on the health of the citizens and rattled the government, forcing it to devise new governance mechanism to address the menace of pollution in the capital.
The study said the economic loss due to lost output from premature deaths and morbidity from air pollution was 1.36% of the GDP in India in 2019. In Delhi, the loss due to lost output from premature deaths and illness attributable to air pollution as a percentage of state GDP was 1.06%.
Uttar Pradesh recorded highest loss to GDP at 1.34%, followed by Punjab at 1.22%. “Delhi had the highest per-capita economic loss due to air pollution, followed by Haryana in 2019, with 5.4 times variation across all states,” said the findings.
According to the study, the economic loss per capita was highest in Delhi, which was to the tune of $62 followed by neighbouring Haryana at $53.8.
The study’s findings suggested that 1.67 million deaths were attributable to air pollution in India in 2019, accounting for 17.8% of the total deaths in the country.
The crude death rate per 100,000 population due to household air pollution decreased in India by 64.2% from 1990 to 2019, due to reduced use of solid fuels, while that due to ambient particulate matter pollution increased by 115.3% and that due to ambient ozone pollution increased by 139.2%, said the study.
The authors of the study suggested that in 2019, the economic loss due to lost output from premature deaths attributable to ambient ozone pollution as a percentage of GDP in India was 0.05% and varied 11.2 times across the states, ranging from 0.01% in Nagaland to 0.12% in Uttar Pradesh. IANS
2018: AQLI index and average lifespan
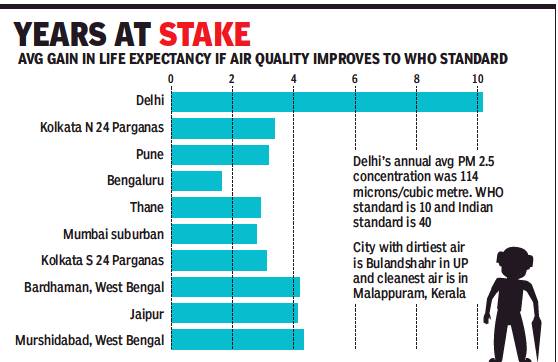
From: Ritam Halder, Foul air reducing Delhiites’ average life by 10 yrs: Study, November 20, 2018: The Times of India
‘Capital 2nd Most Polluted City In India’
The toxic air of Delhi is taking away more than 10 years from the life of an average resident who is exposed to it for a sustained period, according to a new index released by a US university.
The Air Quality Life Index (AQLI) developed by the University of Chicago’s Milton Friedman professor in economics, Michael Greenstone,
and his team at the varsity’s Energy Policy Institute (EPIC), calculates the effect of air quality on life expectancy.
“The AQLI is an index that translates particulate air pollution into its impact on life expectancy. In Delhi, pollution concentrations in 2016 averaged 113 micrograms per cubic metre. Based on the research, life expectancy would be more than 10 years longer for people in Delhi if the World Health Organisation (WHO) standards had been met,” explained Ken Lee, executive director of EPIC India.
According to WHO, the safe limit of annual mean PM2.5 is 10 micrograms per cubic metre. By Indian standards, the limit has been raised to 40 micrograms per cubic metre.
2018: Bad air costs 4.3 years of life, vs. 2.2 years in 1998
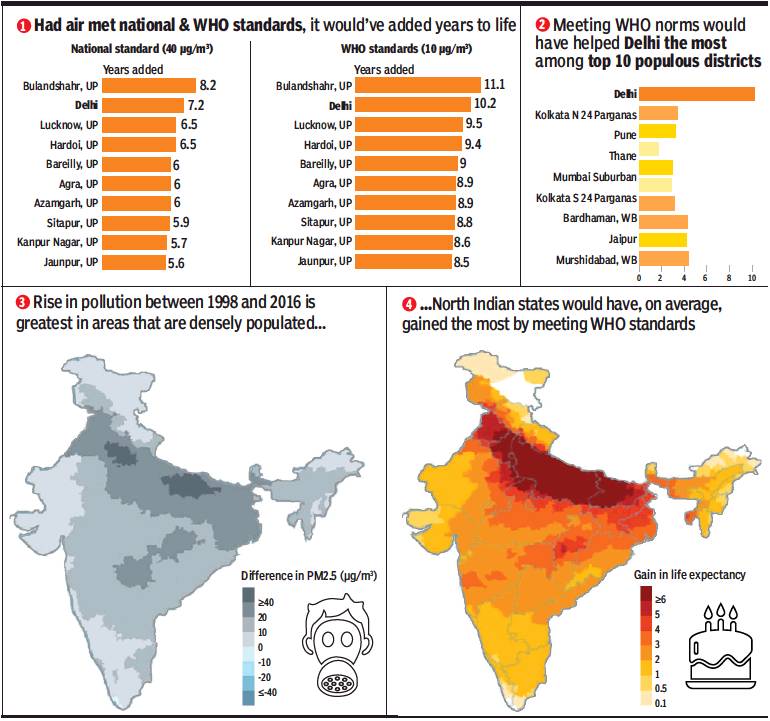
From: Ritam Halder, Bad air costs you 4.3 years of your life now against 2.2 years in 1998, November 20, 2018: The Times of India
Particulate Matter In Delhi Has Risen To 10 Times The WHO Safe Limit In Two Decades
A new index released by a US university has put definite numbers to the health risks posed by bad air. According to the Air Quality Life Index (AQLI), in 1998, Delhi and the north Indian states of Uttar Pradesh, Haryana, and Bihar had already suffered from particulate concentrations that exceeded WHO safe levels by factors of 3 to 6, and reduced life expectancy for residents there by between 2 and 5 years. Over the ensuing two decades, pollution in this region increased to as much as 10 times the WHO safe limit in the case of Uttar Pradesh, where air pollution levels now reduce life expectancy by 8.6 years.
Over the past two decades, the concentration of fine particulates increased by 69% on average across India. As a result, sustained exposure to particulate pollution now reduces the life expectancy of the typical Indian citizen by 4.3 years compared to 2.2 years in 1998.
In 2016, the added lifeyears from compliance with the WHO guideline would raise average life expectancy at birth from 69 to 73 years — a larger gain than from eliminating unsafe water and poor sanitation, the index reveals.
The AQLI is rooted in recent research that quantifies the causal relationship between long-term human exposure to air pollution and life expectancy. The index then combines this research with hyper-localised, global particulate measurements, yielding unprecedented insight into the true cost of particulate pollution in communities around the world.
The index also illustrates how air pollution policies can increase life expectancy when they meet the WHO’s guideline for what is considered a safe level of exposure, existing national air quality standards, or user-defined air quality levels.
“This information can help local communities and policymakers understand the importance of air pollution policies in concrete terms,” Lee said.
The AQLI also points out that India is today the world’s second most polluted country, just behind Nepal. Particulate pollution is so severe that it shortens the average Indian’s life expectancy by more than four years relative to what it would be if WHO air quality guidelines were met.
“High levels of air pollution are a part of people’s lives in India, just as they were in the United States, United Kingdom, Japan and other countries in the past. The last several decades have seen tremendous progress in many of these countries, but this progress did not happen by accident—it was the result of policy choices. As India navigates the dual challenges of sustaining economic growth and protecting environmental quality, the AQLI provides a tool to make the benefits of policies to reduce air pollution concrete,” said Michael Greenstone, director of EPIC.
The index also reveals that fossil fuel-driven particulate air pollution cuts global average life expectancy by 1.8 years per person. The AQLI establishes particulate pollution as the single greatest threat to human health globally, with its effect on life expectancy exceeding that of devastating communicable diseases such as tuberculosis and HIV/AIDS, behavioural killers like cigarette smoking, and even war.
“Around the world today, people are breathing air that represents a serious risk to their health. But the way this risk is communicated is very often opaque and confusing, translating air pollution concentrations into colours, like red, brown, orange, and green. What those colours mean for people’s well-being has always been unclear,” Greenstone said.
Compared to the reduction in average life expectancy by 1.8 years due to particulate pollution, first-hand cigarette smoke leads to a reduction in global average life expectancy of about 1.6 years. Other risks to human health have even smaller effects: alcohol and drugs reduce life expectancy by 11 months; unsafe water and sanitation take off 7 months; and HIV/ AIDS, 4 months. Conflict and terrorism take off 22 days.
So, the impact of particulate pollution on life expectancy is comparable to that of smoking, twice that of alcohol and drug use, three times that of unsafe water, five times that of HIV/AIDS, and more than 25 times that of conflict and terrorism, the study reveals.
2019: The state-wise picture
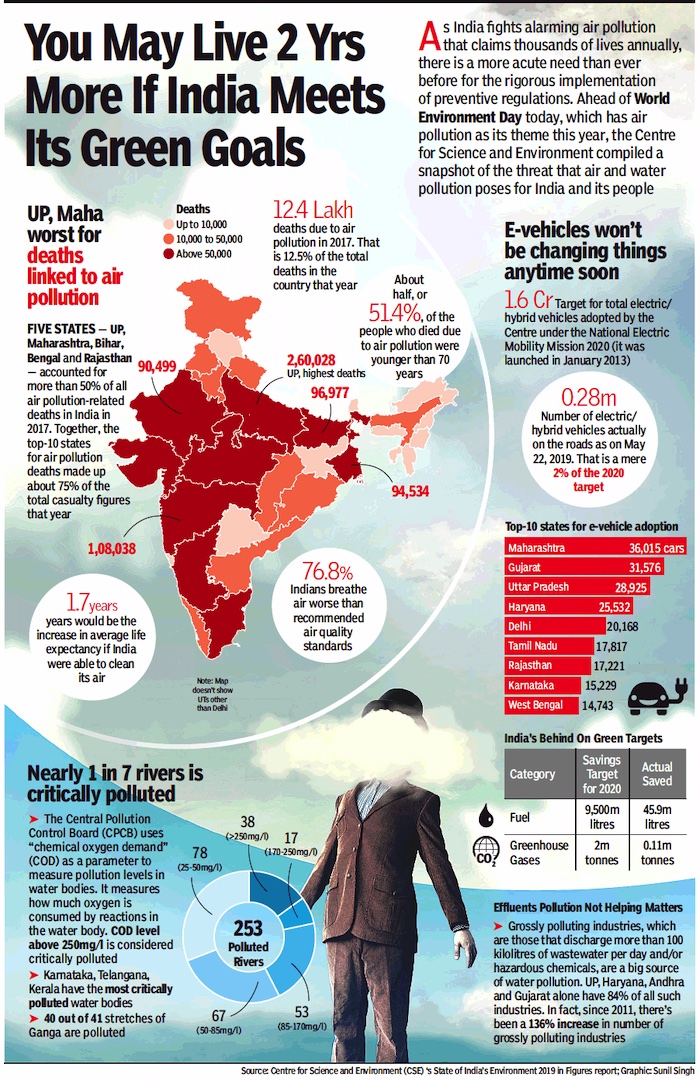
From: June 5, 2019: The Times of India
See graphic, '2019: A state-wise snapshot of the effect of Air pollution on health in India '
2019: State of Global Air 2020
Air pollution now biggest health risk in India, says report
Long-term exposure contributed to over 1.67 million deaths in 2019; 1.16 lakh infants died in first month
Long-term exposure to outdoor and household air pollution contributed to over 1.67 million annual deaths from stroke, heart attack, diabetes, lung cancer, chronic lung diseases and neonatal diseases in India in 2019, according to the State of Global Air 2020 by the U.S.-based Health Effects Institute. Overall, air pollution was now the largest risk factor for death among all health risks, the report noted.
Outdoor and household particulate matter pollution also contributed to the deaths of more than 1,16,000 Indian infants in their first month of life last year. More than half of these deaths were associated with outdoor PM2.5 and others were linked to use of solid fuels such as charcoal, wood, and animal dung for cooking.
For the youngest infants, most deaths were related to complications from low birth weight and preterm birth.
India faced the highest per capita pollution exposure — or 83.2 μg/cubic metre — in the world, followed by Nepal at 83.1 μg/cubic metre and Niger at 80.1, according to the report which sources its data from publicly available sources. Countries with the least population exposure are below 8 micrograms (μg) per cubic metre.
Marginal decline
The government has claimed that average pollution levels in India are declining over the past three years but these have been marginal, particularly in the Indo-Gangetic plains which see extremely high particulate matter pollution especially during winter.
After a decline in pollution due to the nationwide lockdown in late March and the months-long process of reopening, pollution levels are again rising and air quality has dipped to ‘very poor’ category in several cities.
COVID-19, a disease for which people with heart and lung disease are particularly at risk of infection and death, has claimed more than 1,10,000 lives in India. Although the full links between air pollution and COVID-19 are not yet known, there is clear evidence linking air pollution and increased heart and lung disease, creating a growing concern that exposures to high levels of air pollution during winter months in South Asian countries and East Asia could worsen the effects of COVID-19.
“This newest evidence suggests an especially high risk for infants born in South Asia and sub-Saharan Africa,” said HEI president Dan Greenbaum in a statement. “Although there has been slow and steady reduction in household reliance on poor-quality fuels, the air pollution from these fuels continues to be a key factor in the deaths of these youngest infants.”
India vis-a-vis the world
1850-2011: the world's biggest polluters
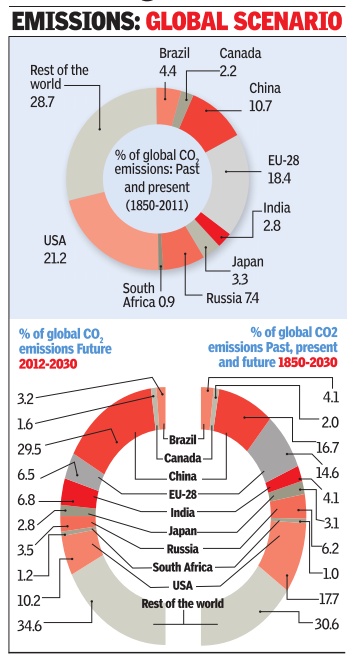
See graphic, 'India and the world, The main countries responsible for CO2 emissions between 1850 and 2011, and their share; as well as likely emissions till 2030'
1990-2017: exporters, importers of CO2
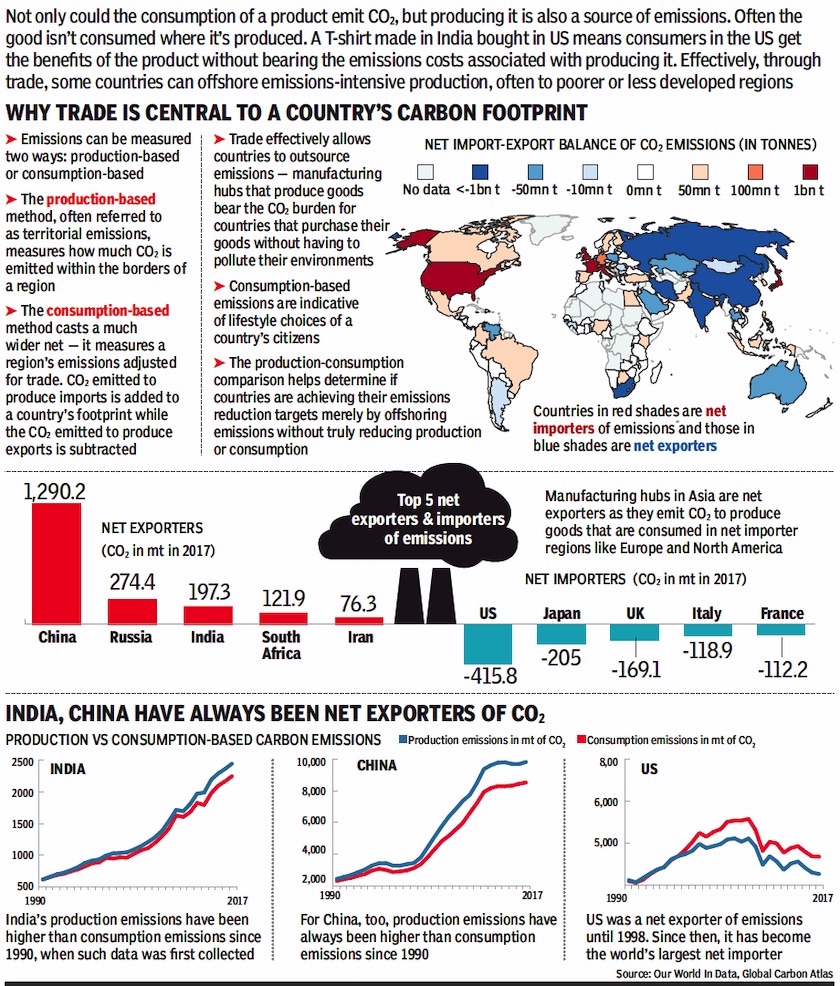
From: Dec 29, 2019 The Times of India
See graphic:
1990-2017/ India in India, China, Japan, Russia, South Africa, the UK and the USA: net exporters and importers of CO2
2015: in absolute terms, in per capita terms
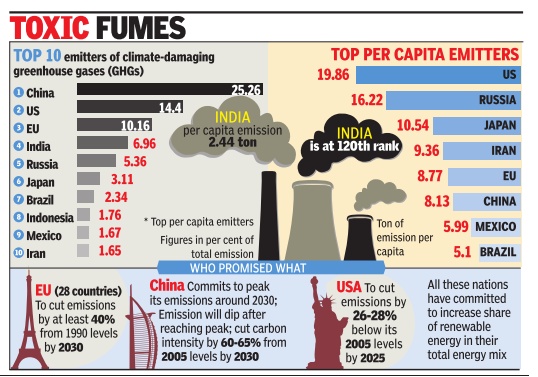
See graphic, 'India and the world, Top 10 emitters of climate-damaging greenhouse gases'
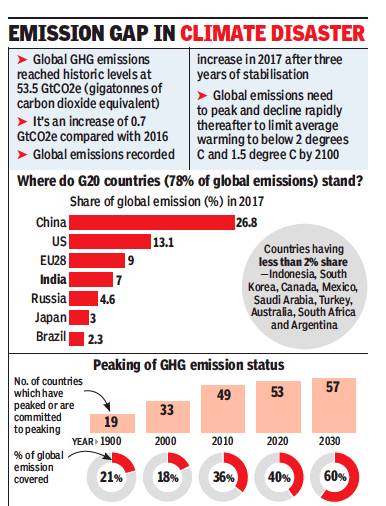
Peaking of GHG emission status, 1900-2010.
From: Vishwa Mohan, ‘Most countries not on track to cut carbon footprint’, November 28, 2018: The Times of India
Global emissions continue to be high as most countries are not on track to cut their carbon footprint as per their pledges of climate action, the United Nations Environment Programme (UNEP) said in its flagship ‘emission gap’ report.
Highlighting the gap in their actions, the report said countries must raise their ambition by 3x (three times) to meet the 2 degree Celsius target and 5x (five times) to meet the 1.5 degree Celsius target as continuation of the current trend was likely to result in global warming of around 3°C by the end of the century, with continued temperature rises after that.
“If the emissions gap is not closed by 2030, it is extremely unlikely that the 2°C temperature goal can still be reached (by 2100),” the report said in a warning to countries in the backdrop of the recent IPCC special report which quantified how disastrous the situation would be if the world didn’t take urgent, drastic and largescale action to keep warming within 1.5°C by 2100.
2018: USA, China EU, India
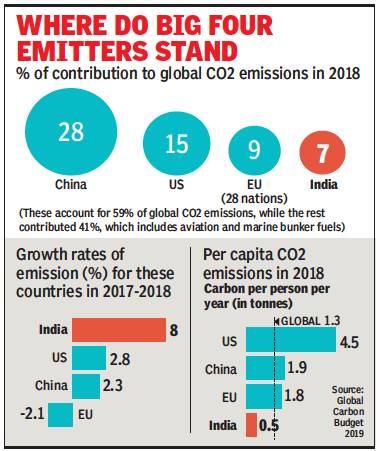
From: Vishwa Mohan, Dec 13, 2019 Times of India
See graphic:
2018: CO2 emissions by USA, China EU, India
2022
India 8th most polluted country in world
Priyangi Agarwal, March 15, 2023: The Times of India
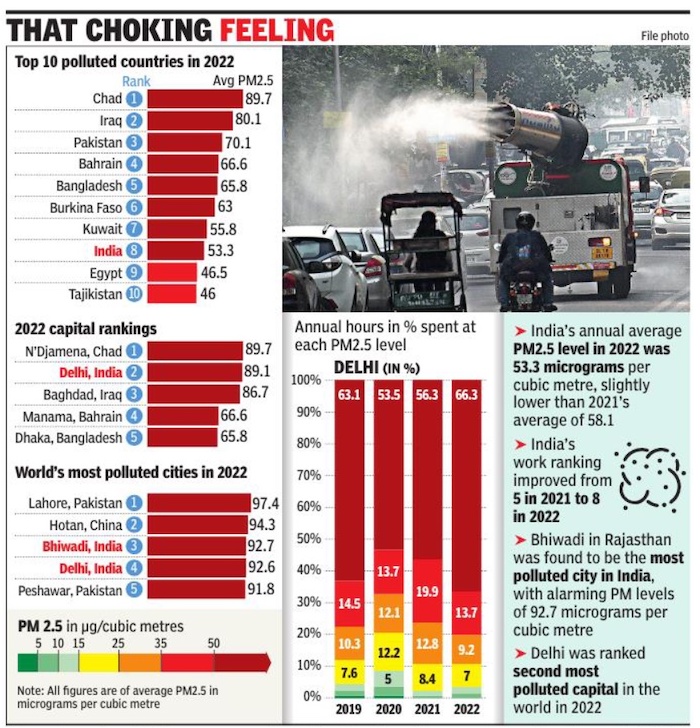
Some of the most polluted cities in India
From: Priyangi Agarwal, March 15, 2023: The Times of India
New Delhi : India was the world’s eighth most polluted country in 2022 with an annual average PM2. 5 concentration of 53. 3 micrograms per cubic metre, according to the fifth annual World Air Quality Report 2022 by IQAir released Tuesday. In 2021, India was ranked the fifth most polluted country with an average PM2. 5 level of 58. 1 micrograms per cubic metre.
With an annual average PM2. 5 concentration of 92. 6 micrograms per cubic metre, Delhi has been ranked the fourth most polluted city in the world after Lahore in Pakistan (97. 4 micrograms per cubic metre), Hotan in China (94. 3 micrograms per cubic metre) and Bhiwadi in Rajasthan (92. 7 micrograms per cubic metre). Delhi had occupied fourth place globally in 2021 too, with average PM2. 5 concentration of 96. 4 micrograms per cubic metre. The annual safe limit prescribed by World Health Organization (WHO) is 5 micrograms per cubic metre.
Till 2021, Delhi remained the world’s most polluted capital for four consecutive years.
However, this year, the report makes a distinction between the capital and the much smaller area of ‘New Delhi’ with the overall Union Territory. Due to this, New Delhi has been ranked the second most regional polluted capital in the world with average PM2. 5 concentration of 89. 1 micrograms per cubic metre after N’Djamena, Chad (89. 7 micrograms per cubic metre). The report said stubble burning is also an important challenge in the region but is an episodic phenomenon confined to a few areas, including Delhi and north India. Anumita Roychowdhury, executive director, research and advocacy, Centre for Science and Environment, said, “For the first time, they have considered two different geographical units – Delhi and New Delhi. New Delhi is slightlycleaner than the rest of Delhi. But overall, the finding is consistent with the downward trend noticed in other assessments for Delhi. The levels are still very high and require aggressive and time-bound multi-sector action to meet the clean air benchmark. ”
The latest report said 12 of the 15 most polluted cities in Central and South Asia were in India. Roughly 60% of Indian cities included in the report experienced annual PM2. 5 levels at least seven times higher than the WHO limit.
Roychowdhary said the worst affected cities are from north India and Indo-Gangetic plains, where adverse geo-climatic conditions influence pollution concentration. “There are tiny towns in the list that are more affected by regional pollution than local sources, unless there is a concentration of grossly polluting sources. This validates the need for airshed level action to mitigate pollution across the northern region,” she added.
Avinash Chanchal, campaign manager, Greenpeace India, said stricter regulations on industries and vehicles to reduce pollution is the need of the hour. “Investment in renewable energy in a decentralised manner should be a priority. The government should also invest in ‘real’ public transportation systems, such as buses and suburban rail, to reduce the number of vehicles on the roads,” said Chanchal.
Frank Hammes, global CEO, IQAir, said, “In 2022, more than half of the world’s air quality data was generated by grassroots community efforts. When citizens get involved in air quality monitoring, we see a shift in awareness and the joint effort to improve air quality intensifies. ”
Industrial pollution
Family conglomerates and carbon dioxide emissions
Chandra Bhushan, March 6, 2021: The Times of India
On November 5, 2020, 24 leading companies signed a ‘declaration of the private sector on climate change’ to tackle the climate crisis.
One of the key features of prominent family conglomerates in India is that they operate in fossil-fuel intensive sectors and are responsible for a significant share of India’s carbon dioxide emissions.
Today, just seven family conglomerates (Reliance, Adani, Tata, Aditya Birla, Mahindra, Jindal, and Vedanta) are responsible for emitting at least 530 million tonnes of CO2 annually. This is equivalent to 22% of India’s total CO2 emissions. In 2019-20, these seven groups operated 25% of India’s coal-based power plants (50,000 MW); produced 39% of India’s steel (43 million tonnes), 27% of India’s cement (91 million tonnes), and 22% of India’s passenger and commercial vehicles (0.92 million). They also accounted for 30% of oil refining capacity and 25% crude oil production.
The writer is CEO, International Forum for Environment, Sustainability and Technology (iFOREST)
Details
Sidhartha Roy, March 5, 2021: The Times of India
From being ranked 65th among111 cities in 2018, Delhi has climbed up to the 13th position in the Ease of Living Index-2020 released by the Union ministry of housing and urban affairs. The capital’s ascent has primarily been powered by the economic opportunities it offers, the parameter on which it was ranked second in the country after Bengaluru.
Among the five major “pillars” of the index, economic ability is the worst performing with an aggregate score of 13.1 nationally. The cities that buck the trend are Bengaluru, which has secured the top spot with a score of 78.8, followed by Delhi (50.7), Pune (48.8) and Ahmedabad (48.1). All these cities have a population of over a million.
When it comes to economic opportunities, Delhi is the only positive outlier in the category with a perfect score of 100, followed by Bengaluru with a significant gap (58.1), Hyderabad (48) and Chennai (45.11). Delhi is on top among 29 cities scoring above the national average, including 16 with a population of over a million and 13 with less than a million.
The capital is also an economic powerhouse in the northern region with the economic ability score of 50.7. This not only ranks it the highest, but also way ahead of the next city Ludhiana, which has a score of 26.2. In fact, with a regional average score of 52.5, most of the over 17 million cities in the northern region have a score higher than the national average of 53.5. Apart from Delhi, the other top ranking north Indian cities are Ludhiana (14th), Jodhpur (21st) and Jaipur (23rd).
Interestingly, in the economic development category, Delhi scores the lowest at 1.4, while the national average is 18. The reason is that cities like Bengaluru, Pune, Ahmedabad, Thane and Chennai and even Gurgaon score higher due to their legacy of industrial development. Delhi is traditionally a major trading point and only non-polluting industries are allowed in the city.
Another area where Delhi scores high is the housing and shelter category, where along with Thiruvananthapuram, Puducherry and Bhopal, it has been identified as the perfect positive outlier. All households in these cities have electrical connections and beneficiaries are covered under Pradhan Mantri Awas Yojana. However, 10-20% of the urban population resides in slums.
Delhi is also among at least 34 cities, including Bengaluru, Chennai and Chandigarh, that have professionally trained teachers.
An area of major concern is the number of crimes against women. Most cities recording high incidence of such crimes are in north India, including top performers in the quality of life category, like Delhi, Gurgaon and Indore.
Despite having the largest metro network in the country, Delhi records low figures for availability of public transport. The figure of Delhi (1,688.5 per lakh population) is lower than Bengaluru (4,409.6), Pune (2,585.5) and Navi Mumbai (2,037.8). In Chennai, availability of public transport is the highest at 92,017.9 per lakh population, followed by Visakhapatnam (21,212.9).
The public transport system in cities like Delhi is not efficient enough to support the population and they may be “automobile-dependent”, states the report. Delhi’s figure for transport-related fatalities of 12.43 per lakh population is also higher than many other cities.
The report mentions that according to World Health Organisation, 20 of the world’s most polluted cities belong to India, including Delhi, Kanpur, Lucknow and Patna. However, it also states that Delhi government shut down a thermal power plant at Rajghat, aiming to redevelop it into a 5,000 kW solar park.
Effect on rainfall
Jayashree Nandi, Jul 03 2017 : The Times of India (Delhi)
It's not just your lungs that the city's bad air is hurting. A study , published in the Atmospheric, Chemistry and Physics journal, has highlighted how air pollution could delay rains in some areas, on one hand, and cause intense rain in a relatively short period, on the other.
This -and several other similar studies -drives home how air pollution may already be impacting crop yields and food production.
The study carried out by IIT-Kanpur, Weizmann Institute in Israel and Indian Meteorological Department has assessed long-term data of clouds, aerosols and rainfall from June to September between 2002 and 2013. “Satellite modelling studies showed that aerosols caused formation of a large number of cloud droplets that are relatively smaller in size. These release a lot of energy , or latent heat. Then, the droplets are pushed vertically , crossing the freezing line. This is also an energy-extensive process that fuels cloud growth,“ said professor SN Tripathi of department of Centre for Environmental Science and Engineering at IIT-Kanpur.
In simple terms, he explained, “more aerosols can cause intense rain in a relatively short period. It can also delay the onset of rain during monsoon“. Aerosol Optical Depth -the degree to which aero sols (airborne solid and liquid particles) prevent transmission of light in an area -is also considered an indirect proxy for air quality. In this study, scientists found AOD in the summer monsoon region during the monsoon months to be 0.6. There is no safe stan dard for AOD, but in cleaner areas such as in the US, the AOD is about 0.1.
A study by Princeton University in 2011 had indicated that monsoon rain was decreasing over the years, mainly because of anthropogenic aerosol emissions.
Professor Sagnik Dey , associate professor at Centre for Atmospheric Sciences at IIT-Delhi, said: “The frequency and intensity of rainfall during monsoon is getting affected. When it's raining, it's raining very heavily and the monsoon is often not progressing smoothly .The aerosol load is higher over the Indo-Gangetic plains, the heating gradient is higher and the cloud patterns are also changing.“
According to Pallavi Pant, a US-based scientist: “The role of aerosols in rainfall is quite complex. Presence of particles in the atmosphere can influence cloud formation because they can act as nuclei or seeds for clouds to form. In some cases, a higher number of particles in the atmosphere can result in heavier rainfall.“
Action taken against polluters
2017: CPCB shuts 387 units in UP
Maria Khan, CPCB shuts down 387 polluting units across UP, August 28, 2017: The Times of India
The Central Pollution Control Board (CPCB) has issued directions to shut down 387 industrial units across Uttar Pradesh after inspections found that they had been violating pollution control norms. According to the CPCB report, the industries, which range from tanneries to textile mills, sugar mills to chemical processing plants, have been discharging effluents directly or indirectly into the Ganga and its tributaries, thereby contam inating the water.
Based on reports, the board on August 9 had issued closure directions to 433 defaulting units across the state under Section 5 of the Environment (Protection) Act, 1986. Of these, 46 grossly polluting industries (GPIs) have since complied with the directions and have been issued revocation directions. The remaining 387 have either not complied with the directions relating to online effluent monitoring devices or have found to be not complying with prescribed standards. In the list, which was re ceived by district authorities on Saturday , textile units make the largest number of those which are to be shut down, at 224. Tanneries number 118. Also in the list are 11sugar mills; 10 distilleries; nine food, dairy and beverage processing units; six chemical units and two slaughterhouses and paper mills each.
Additional district magistrate (enforcement), SP Singh told TOI, “The process of shutting them down has already begun.“
Kitchens’ air pollution
Effect on rainfall
THREAT TO CROPS - Bad air to blame for irregular rain
New Delhi It's not just your lungs that the city's bad air is hurting. A study , published in the Atmospheric, Chemistry and Physics journal, has highlighted how air pollution could delay rains in some areas, on one hand, and cause intense rain in a relatively short period, on the other.
This -and several other similar studies -drives home how air pollution may already be impacting crop yields and food production.
The study carried out by IIT-Kanpur, Weizmann Institute in Israel and Indian Meteorological Department has assessed long-term data of clouds, aerosols and rainfall from June to September between 2002 and 2013. “Satellite modelling studies showed that aerosols caused formation of a large number of cloud droplets that are relatively smaller in size. These release a lot of energy , or latent heat. Then, the droplets are pushed vertically , crossing the freezing line. This is also an energy-extensive process that fuels cloud growth,“ said professor SN Tripathi of department of Centre for Environmental Science and Engineering at IIT-Kanpur.
In simple terms, he explained, “more aerosols can cause intense rain in a relatively short period. It can also delay the onset of rain during monsoon“. Aerosol Optical Depth -the degree to which aero sols (airborne solid and liquid particles) prevent transmission of light in an area -is also considered an indirect proxy for air quality. In this study, scientists found AOD in the summer monsoon region during the monsoon months to be 0.6. There is no safe stan dard for AOD, but in cleaner areas such as in the US, the AOD is about 0.1.
A study by Princeton University in 2011 had indicated that monsoon rain was decreasing over the years, mainly because of anthropogenic aerosol emissions.
Professor Sagnik Dey , associate professor at Centre for Atmospheric Sciences at IIT-Delhi, said: “The frequency and intensity of rainfall during monsoon is getting affected. When it's raining, it's raining very heavily and the monsoon is often not progressing smoothly .The aerosol load is higher over the Indo-Gangetic plains, the heating gradient is higher and the cloud patterns are also changing.“
According to Pallavi Pant, a US-based scientist: “The role of aerosols in rainfall is quite complex. Presence of particles in the atmosphere can influence cloud formation because they can act as nuclei or seeds for clouds to form. In some cases, a higher number of particles in the atmosphere can result in heavier rainfall.
25% urban households don't have kitchen
Could you please give a link to this page on the Housing and UD page but not vice-versa? Dipak Dash, 1.7cr households in cities have no kitchen , April 12, 2017: The Times of India
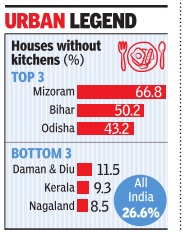
At least one-fourth of urban households in India don't have separate a kitchen, according to data based on the Socio-Economic Caste Census (SECC) carried out by the housing ministry .
The survey indicates how nearly 1.7 crore urban households may be using their single room for cooking food as well.This fresh data gains importance considering that different studies have shown how air pollution in kitchens has become a major health concern and that too in urban areas where the ambient air is getting increasingly polluted due to vehicular emission and dust.
A study published in Elsevier, a journal on environmental research, which assessed people's personal ex posure to pollution in Delhi, showed how kitchens can be more polluted than roads.
The study mentioned how urban households, particularly kitchens, could be enveloping people in PM 2.5 pollutants as well. Other studies across the globe have also shown how kitchen appliances release colourless pollutants. Kitchens also get more polluted when they lack proper ventilation. In fact, the Pradhan Mantri Ujjwala Yojana (PMUY), launched by PM Narendra Mod, was a big step towards making kitchens smoke-free for women who are often the worst-affected by such pollution.
According to SECC data, while Mizoram has the maximum percentage of such households, Bihar ranks second. In Daman and Diu and Kerala, over 90% households have exclusive kitchens.
SECC data shows that in 2011, when the survey was conducted through a comprehensive door-to-door enumeration across the country , nearly 24.5% of urban households had a single room.
Sources in the housing ministry said the SECC data collected in 2011 is being utilised in sanctioning houses for the urban poor with central aid under the Pradhan Mantri Awas Yojana. SECC data, which conceals sensitive caste and poverty details in urban areas, gives details of how many families are “houseless“ and how many live in rented accommodations in towns and cities.
Link between meteorological conditions, air quality
2015 and 2016
See graphic.Link between meteorological conditions and the air quality in Delhi on the 1st Oct and 7 Nov, 2015 and 2016.
Measurement of Air Quality
National Air Quality Index needs help/ 2017
The Six Problems With The Way We Measure Air Quality In Our Country
Two years after it was started, India's National Air Quality Index (NAQI) does not provide a relia ble picture of pollution in cities. The index uses colours ranging from dark green to dark red to show users at a glance how polluted the air in their area is at any time. However, it is unreliable because most cities don't have enough monitoring stations, and the existing stations do not monitor for all important pollutants. NOT ENOUGH STATIONS
The entire metropolis of Mumbai--home to more than 2.2 crore people--has only one air quality monitor in Bandra for NAQI. When former environment m i n i s t e r P r a k a s h Java d e k a r launched NAQI under the Swachh Bharat campaign in April 2015, the goal was to cover 46 cities with a population of more than 10 lakh each, but only 29 are on the network so far. Of these, 20 cities, including some severely polluted ones like Varanasi, Patna and Kanpur, have only one NAQI monitoring station each.
The northeast has virtually no monitoring station. Large states like Chhattisgarh, Jharkhand and Odisha also don't have any. Asansol, Coimbatore, Bhiwadi, Ghaziabad, Noida, Ludhiana and Vapi are some of the critically-polluted areas that may be connected to NAQI this year.
Delhi is the only city with eight monitoring stations and it is likely to get 20 more this year. Compare that with Beijing that already has more than 35, and London, which has 100, according to a recent Greenpeace India report. Entire China has 1,500 government-run monitoring stations.
Central Pollution Control Board (CPCB), which runs the NAQI programme, had prescribed at least three stations each in Class 1 cities, nine each in mega cities like Ben galuru, and six each in all other cities that are either state capitals or major industrial areas.
COST HURDLE
Why has the NAQI network of monitoring stations grown so slowly? CPCB officials say the high cost of equipment and shortage of trained manpower is delaying its growth.
“We cannot just establish automatic stations. Each station that monitors eight criteria (common) pollutants costs about Rs 1 crore and its operational cost is Rs 10 lakh per year,“ said Dipankar Saha, head of Air Lab at CPCB. “They are all US EPA-approved automatic analysers.It takes about nine months to set up each station and we need dedicated manpower to monitor and validate the data recorded by these stations.“
Saha said CPCB will not take data from low-cost private monitors. “Our monitoring methodology is prescribed in the gazetted notification.We do not trust low-cost monitors.“
Experts say the cost hurdle can be overcome by using satellite data and air quality modelling.
DOUBTFUL READINGS
CPCB may doubt data from private monitors, but its own equipment is often not calibrated properly. For mer CPCB member secretary B Sengupta says, “We have noticed that many of the stations aren't even calibrated, which could give erroneous results.“
Calibration is done by injecting gas into the monitor and tallying the results with specific readings. “We have noticed that scientists in most state pollution control boards are not capable of doing this calibration and it's entirely left to the suppliers of the equipment who also don't do it. Often, gas isn't available for testing.“
That explains the huge difference in data collected manually and by automatic stations at the same location. “The difference is often as much as 30-50% when it shouldn't be more than 10%. Unfortunately , we are drawing some major conclusions on air quality based on very limited data,“ added Sengupta.
ALL POLLUTANTS NOT MEASURED
CPCB stations do not measure the levels of all important pollut ants. For instance, PM 2.5 (fine, respirable pollu tion particles) is measured in only seven cities, so World Health Organization (WHO) extrapolated PM 2.5 data from PM 10 (coarse particles) data for India's urban air quality database.
“We may not know the proportion of industrial pollution either. Toxic of industrial pollution either. Toxic pollutants are not being monitored.Volatile organic compounds (VOCs), which are commonly emitted around industries in critically-polluted areas like Vapi, Ankleshwar, Vatva and others, are not being captured at all,“ said Sengupta.
MONITOR LOCATION MATTERS
Besides the number of monitoring stations in a city, where they are located is also important to get a representative picture. “We recently correlated air pollution levels captured by ground monitors in some cities with the city averages based on high-resolution satellite data and found that monitoring is not science driven,“ said Sagnik Dey, associate professor, Centre for Atmospheric Sciences at IIT Delhi.“In Varanasi, the lone monitoring station is more or less representative of the city average, but in many other cities it's not so. A city where the monitor isn't placed in the right location may move up very high in city ranking despite being less polluted.“
NOT USING ALL AVAILABLE DATA
While CPCB has just one operational station in Mumbai, a parallel government sys tem called SAFAR (System of Air Quality and Weather Forecasting and Research) has 10, but the two are not connected. SAFAR, which is under Ministry of Earth Sciences, has 10 stations each in Delhi, Pune and Ahmedabad. Saha says NAQI and SAFAR will share data eventually . For now, “Their design is prediction-oriented while we are capturing real-time data. There are technical difficulties in aligning the two.“
“State of the Global Air 2017“ report, US-based Health Effects Institute (HEI)
Jayashree Nandi, CPCB `junks' ozone data, March 3, 2017: The Times of India
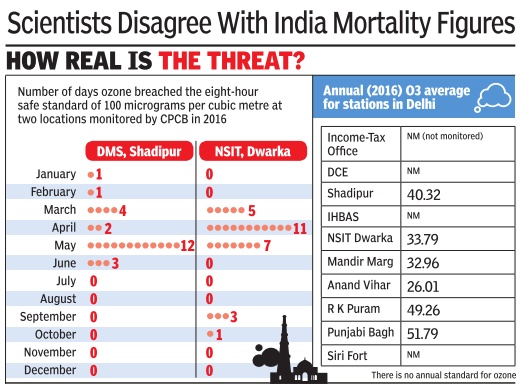
Reacting to a recent international report that said India had the highest number of ozone-related deaths, scientists from the Central Pollution Control Board said exposure to ozone cannot lead to premature mortality and that the report was only putting India on the spot with “observational data“.
In its “State of the Global Air 2017“ report, US-based Health Effects Institute (HEI) had analysed the impact on health of air pollution across the globe and found India had the most fatalities due to chronic obstructive pulmonary disorder (COPD) caused by ozone.
The report said 2.54 lakh deaths occurred in 2015 globally on account of ozone exposure, of which India accounted for over more one lakh and China, 71,900. The report also said India's record contributed substantially to the 67% rise in ozone attributable COPD deaths since 1990.
Refuting the findings, Dipankar Saha, head of CPCB's air lab, said, “Ozone exposure cannot be linked with mortality. If it were true, by now we would have seen a very large number of deaths in the US, which has high ozone concentrations. Our data shows India rarely exceeds the safe standard for the gas.“
While CPCB shared annual average concentrations of the highly hazardous and reactive gas for 33 cities and 56 stations, though not the daily or monthly concentrations, experts who declined to be quoted said annual concentrations could mask ozone peaks.Ozone is formed when nitrogen dioxide emissions react with volatile organic compounds in hot weather.
Contradicting even the death figures associated with respirable pollutants in the HEI report, Saha said, “It's an observational study . Our data is robust and comparable becau se India is the only country that has specified pollution measurement methods and techniques.“ S Scientists TOI spoke to also confirmed that proof of ozone's link with mortality is only now being studied. “Current research only looks at ozone's association with worsening COPD, asthma and inflammation and increased risk of premature mortality ,“ a public health expert pointed out. “The link is strong, but stronger evidence base is necessary before a conclusive declaration can be made.“
Referring to the report, Union environment minister Anil Madhav Dave too had pointed out, “These reports are often based on extrapolations without due scientific validation and there is a need for caution before arriving at any conclusion.“
The HEI report stated that “over the last 25 years, India experienced a nearly 150% increase in ozone-attributable deaths, while China's number remained about the same. The ozone-attributable COPD mortality rate decreased by about 1% over this time period in the United States and Indonesia, and remained relatively stable in Russia and the European Union“.
CPCB's own “Epidemiolo gical study on effect of air pollution on human health in Delhi“, published in 2012, admitted that the combustion of fuels produced outdoor pollutants, including ozone. “There is increasing evidence to suggest that exposure to these pollutants elicits adverse health effects often at levels well below the current WHO guidelines,“ the report said.
The “Delhi commitment on multi-sectoral action for addressing air pollution“, the result of a workshop organised by the union environment ministry and WHO, recommends making air pollution impact assessment mandatory for public policies of various ministries. It also advises investment of “additional human and financial resources“ to reduce exposure to air pollution.
Metropolitan cities, 2015-16
The Times of India, Apr 29 2016
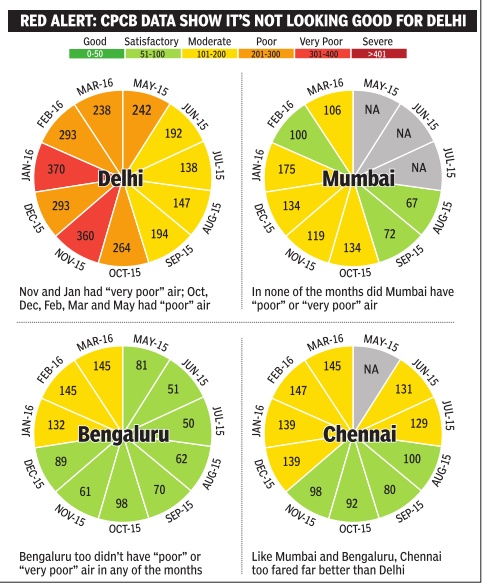
Delhi's air most foul among metros
The Central Pollution Control Board (CPCB) released national air quality index (NAQI) status for 24 cities in 10 states.
The report provided daily AQI values for 11 months for most major cities and for 4-6 months for others that CPCB started monitoring later. Data showed that Delhi, Varanasi, Lucknow and Kanpur had a large number of days with very poor and severe air quality whereas the coastal and southern states fared better. But there is a huge disparity in the number of monitoring stations in each city. Here, we compare the air quality in Delhi with Mumbai, Bangalore and Chennai. Delhi has nine monitoring stations. Mumbai had just one station functioning on Thursday, Bangalore had 5, and these differences will have to be factored in.
Delhi had two months of “very poor“ and five months of “poor“ air (see graph). Mumbai had no months in the “poor“ or “very poor“ categories, nor did Bengaluru or Chennai.Experts said meteorological factors play a crucial role in this --while coastal cities have better dispersal of pollutants, Delhi, Kanpur, Varanasi and others in the Indo-Gangetic plains are worse off because of higher emission sources such as industries, brick kilns and others. The CPCB's report also indicates that the monitoring is very weak in certain parts with many cities showing “no data“ for several days. Gurgaon, for instance, had AQI only for a day in all of January . This indicates the report gives a skewed picture in these cities
Ozone levels
2014
The Times of India, Sep 09 2016
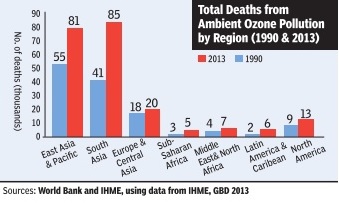
Jayashree Nandi 10-20% rise in ozone levels in India, harmful for lungs and crops: Report
While Indian cities are still grappling with the impacts of severe particulate matter (PM) pollution, a new report has raised the flag on ozone levels (O3) too. `The Cost of Air Pollution', a report by the World Bank and Institute of Health Metrics and Evaluation (IHME) released, estimates that the concentrations of O3 has increased by 10 to 20% in India between 1990 and 2013. The trend is similar in neighboring countries and in Brazil, while a declining course was seen in the US and Indonesia, among others.
High ozone levels are not only associated with serious health impacts like reduced lung function, chronic obstructive pulmonary disorder (COPD), aggravating asthma and respiratory conditions, but also with widespread crop loss.
The study also estimates that total deaths due to increase in exposure to O3 increased by 50% between 1990 and 2013 in South Asia. For this report, the health and economic burden of O3 is only based on COPD incidence from it. Total deaths due to exposure to PM2.5 have also increased in South Asia during the same phase, but not as steeply as with O3.
Interestingly, even though the cost of O3 related premature deaths are far lower than that of PM2.5 (both household and outdoor), O3 associated economic or welfare losses for South Asia are equivalent to that of North America. The welfare losses due to O3 exposure are to the tune of 0.4% of gross domestic product (GDP) equivalent, the report states.If you consider man days lost, it's about 0.09% of GDP equivalent, it says.
Air quality experts said O3 could be a serious concern soon. “Even before we could deal with health damage from particulate pollution we are falling into the pincer grip of ozone pollution that damages both lungs and crops. This is also the sign that emissions of toxic gases are increasing rapidly in our country . Keep in mind that for estimating health damage from ozone this report has only considered chronic obstructive pulmonary diseases. The actual cost of health damage could be way higher,“ said Anumita Roy Chowdhury , head of Centre for Science and Environment's clean air programme.
Ozone is not directly emitted from any source, it is created by chemical reactions between oxides of nitrogen and volatile organic compounds in the presence of sunlight. It's mainly released from combustion sources which includes vehicles and industries.
A 2014 study by scientists at Indian Institute of Tropical Meteorology estimated that ozone-induced damage to wheat and rice is enough to feed roughly 35% of 270 million BPL population in India.
2015: India tops in ozone pollution deaths
Vishwa Mohan, Country Can't Continue In Denial: Experts, Feb 15, 2017: The Times of India
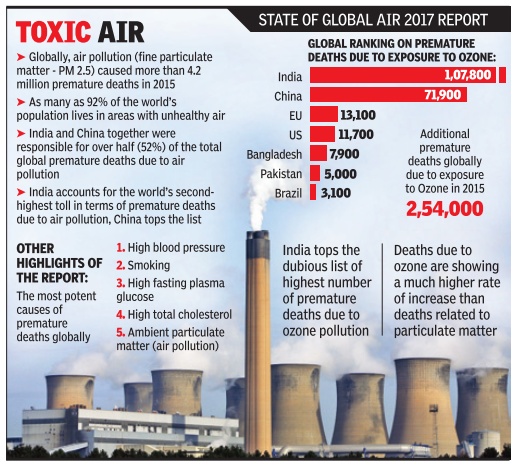
India tops list of countries in ozone pollution deaths
India has been in denial mode on linking premature deaths to air pollution in the absence of conclusive data, but a new comprehensive global report by two US-based institutes may now trigger a rethink. The report claims the country's worsening air pollution caused some 1.1 million premature deaths in 2015 and it now rivals China in having among the highest air pollution health burdens in the world.
The State of Global Air 2017 report, released in Bos ton on Tuesday , claims longterm exposure to fine particulate matter (PM2.5) -the most significant element of air pollution -contributed to 4.2 million premature deaths in the world in 2015 where both India and China to gether were responsible for over half of the total global deaths. Though the report sounds alarm bells for entire Asia, it paints a particlularly grim picture for India where the rate of increase of premature deaths due to air pollution is even higher than in China. It noted that while the early deaths related to PM2.5 in China has increased by 17.22% since 1990, it has increased by 48% in India.
Ozone-related early deaths in India are, in fact, 33% higher than those recorded for China. India's deepening pollution problem, which hit home with a vengeance after Diwali last year as Delhi and NCR woke up enveloped in smog that refused to lift for days, has a death toll second only to China's, and together the two nations acount for over half the world's deaths from pollution. According to the State of Global Air 2017 report, released in Boston on Tuesday , as many as 2.54 lakh deaths occurred in 2015 on account of exposure to ozone and its impact on chronic lung disease.India accounts for the highest number of premature deaths due to ozone pollution, its toll 13 times higher than Bangladesh's, and 21 times higher than Pakistan’s.
An interactive website on the report also highlights that 92% of the world's population lives in areas with unhealthy air. “We are seeing increasing air pollution problems worldwide, and this new report and website details why that air pollution is a major contributor to early death,“ said Dan Greenbaum, president of the Health Effects Institute (HEI), the research institute that designed and carried out the study . He said, “The trends we report show that we have seen progress in some parts of the world, but serious challenges remain“.
The report was prepared by HEI in cooperation with the Institute of Health Metrics and Evaluation at the University of Washington and the University of British Columbia. Involving more than 2,000 researchers, the report factored in the role of an extensive set of behavioural, dietary and environmental risk factors for more than 300 diseases in 195 countries from 1990 onwards.
Referring to the findings of the report, Anumita Roychowdhury of the Centre for Science and Environment, said, “India can't afford to remain complacent or in denial. With so many people dying early and falling ill... due to particulate and ozone pollution, it is a state of health emergency . This demands nationwide intervention to ensure stringent mitigation and a roadmap to meet clean air standards“.
The pollutants/ the chemicals in the air
Sulphur dioxide
2016-18
Vishwa Mohan, August 20, 2019: The Times of India
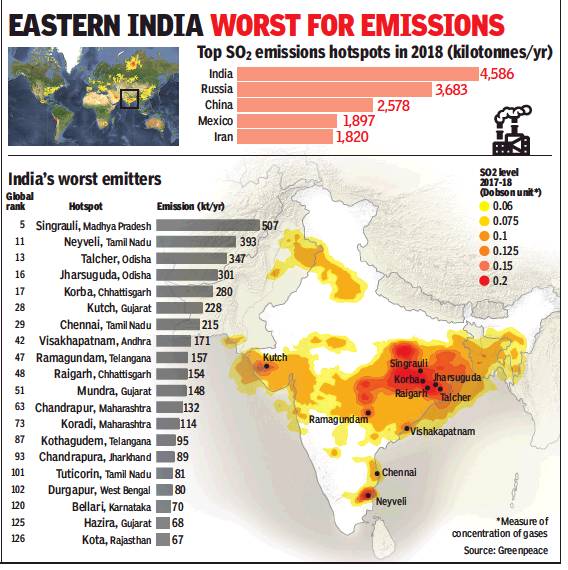
India’s rank among the world’s worst; and
India’s worst regions and cities.
From: Vishwa Mohan, August 20, 2019: The Times of India
Coal-based power makes India top global SO2 emitter: Greenpeace
New Delhi:
Sulphur dioxide (SO2), a significant contributor to air pollution, may be within the national ambient air quality standard in all major cities in India, but the country is the largest cumulative emitter of this pollutant in the world and thus prone to being a victim of a cocktail of several toxic air pollutants.
As a reactive pollutant, SO2 reacts with other air pollutants to form sulphate particles and makes a significant part of particulate matter (PM2.5), which has the largest public health impact. It is estimated that SO2 commonly makes up more than 10% of the deadly fine particles in India and China.
Though Russia’s Norilsk smelter complex is the largest individual SO2 emission hotspot, India figured at the top, contributing more than 15% of all anthropogenic sulphur dioxide globally in 2018. The primary reason for the country’s high emission output is the expansion of coal-based electricity generation over the past decade.
These are the findings of a new report by Greenpeace, a global environmental NGO, which analysed sulphur dioxide hotspots detected by US space agency Nasa’s OMI (Ozone Monitoring Instrument) satellite. It shows Russia is the second largest cumulative emitter of sulphur dioxide followed by China, Mexico, Iran, Saudi Arabia and South Africa.
The Greenpeace study, released on Monday, finds that Singrauli, Neyveli, Talcher, Jharsuguda, Korba, Kutch, Chennai, Visakhapatnam, Ramagundam and Raigarh are the major SO2 emission hotspots in India.
Analysis of ambient air quality data by the Central Pollution Control Board (CPCB), India’s national pollution watchdog, however, shows that sulphur dioxide levels were within the acceptable limits in all 50 major cities, including Delhi, Mumbai, Bengaluru, Chandigarh, Kolkata, Pune and Kanpur, in the country during 2016-18. Asked for explanation, clean air analyst and one of the authors of this report, Sunil Dahiya, said, “Although SO2 concentration monitored directly across cities in India might show low values, being a reactive pollutant, it converts to sulphates very quickly, making a significant part of secondary PM2.5, which has proven to be a major health risk across the world, leading to millions of deaths”.
Citing an example, he told TOI that the IIT Kanpur report on air pollution in Delhi, compiled in 2015, also highlighted this fact by mentioning that 90% reduction in SO2 from power plants within 300km of the capital will result in reduction of approximately 35 micrograms per cubic metre of PM2.5.
The report noted that among the major emitters of SO2, China has been able to reduce emissions rapidly by dramatically improving emissions standards for its power plants and enforcing sulphur dioxide controls.
“This report makes it clear that we cannot give coal power plants a free hand to continue polluting and keep leading to a health emergency situation in India due to air pollution,” said Pujarini Sen, senior campaigner at Greenpeace, in a statement.
Toxic metals
High levels of toxic metals in air: Study, January 18, 2019: The Times of India
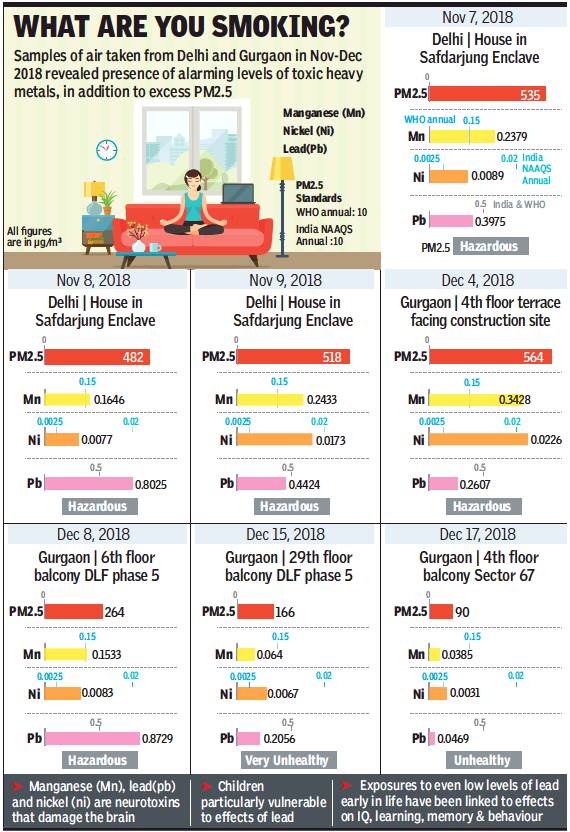
From: High levels of toxic metals in air: Study, January 18, 2019: The Times of India
Samples of air taken from Delhi and Gurgaon in November and December 2018 have revealed the presence of alarming levels of toxic heavy metals such as manganese, nickel and lead, in addition to excess PM2.5, according to a study released by an NGO, Lung Care Foundation.
In the study, “Death in every breath”, results of seven air samples from New Delhi and Gurgaon were analysed. Levels of manganese in five samples were found to be much higher than the US standard while nickel concentration exceeded WHO guidelines in all seven samples. Lead levels exceeded the US safe standard in six samples and extremely high levels of barium were detected around Diwali.
PM2.5 levels in all the seven samples were above statutory limits, ranging from 90.3 ug/m3 to 563.5 ug/m3 — between 1.5 and 9.4 times higher than standards prescribed by the Union environment ministry.
Delhi air rich in 3 toxins that can cause brain damage, finds study
Manganese levels in five samples exceeded the US EPA reference concentration for exposure to to the metal (0.05 ug/m3) and the WHO annual health-based guidelines value of 0.15 ug/m3. There are no standards in India for manganese in ambient air.
Levels of lead in six samples exceed the US EPA threemonth average for exposure to lead (0.15 ug/m3) and in two samples exceed the Indian NAAQS annual and WHO annual health-based guidelines value of 0.05 ug/m3.
Nickel levels in all samples exceed the WHO annual healthbased guidelines value of 0.0025 ug/m3, which is based on the risk of cancer associated with long-term exposure to nickel.
“Manganese, lead and nickel are neurotoxins that damage the brain. Children are particularly vulnerable to the effects of lead. Exposures to even low levels of lead early in life have been linked to effects on IQ, learning, memory and behavior. It’s a matter of very serious concern that such high levels of these toxic metals are found in the air that our children breathe,” said Dr Arvind Kumar of Lung Care Foundation.
“There is an urgent need for policy makers to bring the focus back on the people and the health problems they are reporting, to understand the impact of air pollution and its severity. People are the best monitors and they have been reporting severe health impacts already,” he said.
The barium level in the sample collected a day before Diwali was 21.5 µg/m3. It was 5.8 µg/m3 on Diwali and 2.4 µg/ m3 the day after.
According to Dr Mark Chernaik, staff scientist at Environment Law Alliance Worlwide (ELAW), US, “These levels are extremely high and unheard of. Typically, barium levels are <0.05 µg/m3.” Based on limited human and animal data, the respiratory tract is the most sensitive target following inhalation exposure. According to studies, barium, typically as barium nitrate, imparts a yellow or apple green colour to fireworks. For brilliant green, barium monochloride is used.
Prosecution of offenders
2016
Vishwa Mohan, December 6, 2017: The Times of India
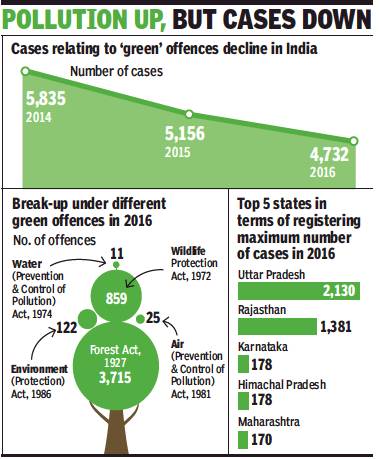
From: Vishwa Mohan, December 6, 2017: The Times of India
See graphic:
Cases relating to "green" offences, 2015-16
The 5 states that registered the highest number of cases in 2016
This is how serious Delhi is about its air
Not A Single Case Registered In City Under Pollution Law
Delhi had seen one of the worst years in terms of air pollution in 2016 but the city did not file a single case against anyone for violating the Air (Prevention and Control of Pollution) Act, reflecting gaps in the enforcement of green laws in the country.
The crime figures released by the National Crime Records Bureau (NCRB) last week capture this irony with the country as a whole registering only 25 cases under the air pollution law act with the maximum 21 being registered in Maharashtra and two each in Jharkhand and Uttar Pradesh.
Though the number of cases collectively under all five green laws in the country has consistently been decreasing since 2014, the registration of lower number of cases under air and water pollution acts puts a big question mark over the functioning of the State Pollution Control Boards (SPCBs) across the country.
“The SPCBs have policing power, but they are not exercising it. They simply issue warning, asking them to refrain from violating air or water pollution act. It is a serious enforcement issue and the government must intervene to address this,” environment lawyer Ritwick Dutta told TOI.
He said that most of the SPCBs do not even lawyers to take up their cases in court. “Not even a single person is convicted under the air pollution act since 1980. Just issuing warnings and handling it without bringing it to the notice of courts (by registering cases) are something which should be questioned”, said Dutta.
The five green laws under which violators are booked in the country include Indian Forest Act, 1927; Wildlife Protection Act, 1972; Environment (Protection) Act, 1986; Air (Prevention and Control of Pollution) Act, 1981 and Water (Prevention and Control of Pollution) Act, 1974.
According to the NCRB, total 4,732 cases were registered under various environmental laws. Most of the cases registered in 2016 were related to violations of forest and wildlife protection laws with only 25 being registered under air pollution act and 11 under water pollution act.
Asked about such a huge number of cases under forest and wildlife protection laws, Dutta said forest officials were trained to do policing jobs unlike their counterparts in SPCBs. “Better enforcement is also linked to career progression of forest officials and therefore the conservators do their jobs diligently”, he said.
Reduction of pollution: measures
Measures taken by Delhi, Haryana, Punjab, Rajasthan/ 2013, '14
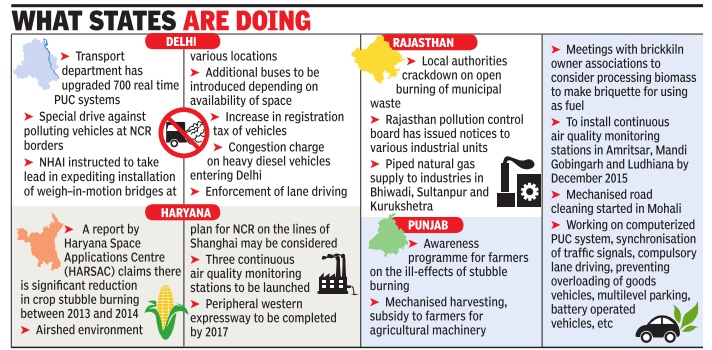
See graphic, 'Measures taken by Delhi, Haryana, Punjab and Rajasthan'
PAT (perform, achieve, trade)’s achievements 2012-15
Just 478 units reduced 2% of India's annual CO2 emission, October 26, 2017: The Times of India
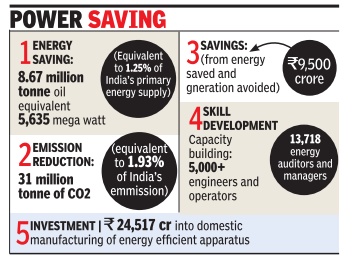
From: Just 478 units reduced 2% of India's annual CO2 emission, October 26, 2017: The Times of India
Just 478 industrial units from energy-intensive industries have reduced their carbon emission by 31 million tonne, or 2% of India's total annual emission, and saved over Rs 9,500 crore through more efficient energy use in the three years between 2012 and 2015, the first report card of a governmentpromoted scheme shows.
The results for the first implementation cycle of PAT (perform, achieve & trade) scheme of the Bureau of Energy Efficiency under the power ministry also shows monetary savings of Rs 37,685 crore from avoided generation of 5,635 MW, indicating a gradual greening of Indian industry .
The first cycle of PAT (2012-15) covered the chosen factories -called `designated units' -from eight sectors with high energy consumption: aluminium, cement, chloralkali, fertiliser, iron & steel, pulp and paper, textiles and thermal power plants. Together, these sectors account for about 33% of India's primary energy consumption.
PAT is a market-based mechanism focused on reducing energy consumption for each unit of production in large energy-intensive industries. It is being implemented under the National Mission on Enhanced Ener gy Efficiency (NMEEE) as part of the National Action Plan on Climate Change (NAPCC) of 2012.
The scheme facilitates large, energy-intensive industries to achieve their legal obligation under the Energy Conservation Act of 2001 and also motivating them with necessary market-based incentives to reduce their perunit energy consumption and surpass their individual energy saving targets.
These results are encouraging in the backdrop of last week's healthy start to Energy Efficiency Certificates (ESCerts) trading. Industry generated over Rs 11 crore of additional revenue during the first month of trading. Some 117,425 ESCerts have been exchanged at an average bid price of Rs 990 each in the auctions over the past month.
The government launched ESCert trading on the Indian Energy Exchange (IEX) and the Power Exchange India Ltd (PXIL) on September 26. The certificates are traded only on Tuesdays through closed doublesided uniform price auction.
The certificates are issued by the power ministry to industries that surpass the energy saving targets set by BEE under `PAT (perform, achieve and trade)' scheme.
The PAT scheme is now being implemented as a rolling cycle, with new units notified for a period of three years every year. Thus, there will be no gap in notifying new units, as was the case between PAT I and PAT II.
2016 was cleaner than 2013 in some places
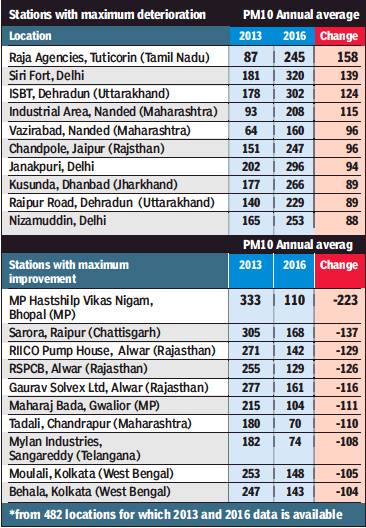
From: Jayashree Nandi & Atul Thakur, Winter’s here, but more cities see improvement in air quality: CPCB, December 1, 2017: The Times of India
See graphic:
PM10 annual average-
i) Stations with maximum deterioration, 2013-16;
) States with maximum improvement, 2013-16
Winter’s arrival is often followed by grim stories on smog episodes and severe air pollution in north Indian cities. This popular perception of forever deteriorating air quality may be a partial picture. An analysis of data from the Central Pollution Control Board (CPCB’s) national air quality monitoring programme (NAMP) shows surprising trends.
A little over half (52%) of the 482 stations for which continuous data was available have recorded an improvement or no change in annual average levels of PM 10 (coarse polluting particles) between 2013 and 2016. The road to clean air remains very long, as despite this improvement more than 80% of these stations have PM 10 concentrations higher than the annual safe standard of 60 µg/m3.
Much of this data is only indicative and cannot establish reliable trends because only at 76 of these stations was air quality monitored for at least 104 days a year as recommended by CPCB’s guidelines. But even among the 76 stations, 48 showed improvement and 28 recorded a decline in air quality.
Among these 76 stations, the ones in Punjab’s Khanna municipality showed the highest decrease while a station in Ujjain saw the highest increase in PM10 concentration. Stations at Ludhiana, Guwahati, Allahabad, Nagpur and Nashik were among those that saw a decline in PM10 concentration. Those that recorded increases were located at Shimla, Vishakhapatnam, Chandigarh, Pimpri-Chinchwad and Agra. Once again, despite the improvement, PM10 concentration was higher than the safe level in 37 of the 48 stations.
If we consider all 482 stations, air pollution levels have peaked massively in cities like Delhi, Tuticorin, Dehradun, Nanded and Dhanbad. In the port and industrial city, Tuticorin, PM 10 levels increased from 87 micrograms per cubic metres to 245 micrograms per cubic metres, in Dehradun’s ISBT station from 178 in 2013 to 302 in 2016. Similarly, Bhopal’s Hamidia Road saw significant improvement from 333 in 2013 to 110 in 2016. Stations in Alwar, Kochi and Kolkata also recorded significant declines, though none of them met the 104-day monitoring guidelines.
CPCB officials declined to comment on why air quality was not adequately monitored but explained “We try to assess the trends based on whatever data we have till now. Most state pollution control boards are highly short staffed, they do not have adequate funds, while for some air quality is not a priority issue.”
The officials said that “success stories” haven’t been documented but they know that some pollution control boards are working with municipal authorities and their development bodies to ensure improvement in air pollution levels. “Our air quality goal is the notified air quality standard. Land use planning and development needs to be done with air quality goals in mind. We know many stations in Kerala, in Maharashtra are improving because of their good land use planning,” said Dipankar Saha, head of CPCB’s air lab.
Manju Mohan, head of IIT Delhi’s Centre for Atmospheric Sciences, cautions that the data from the 482 stations may actually be indicative of increasing air pollution levels.
Colour-coded stickers for vehicles/ 2018
AmitAnand Choudhary, August 14, 2018: The Times of India
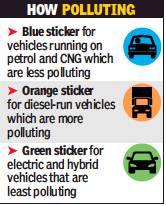
From: AmitAnand Choudhary, August 14, 2018: The Times of India
On the lines of the practice followed in Paris, different colour-coded hologram-based stickers would now be put on vehicles in India to indicate the nature of fuel being used. Vehicles running on relatively cleaner fuels like petrol and CNG would be given blue sticker while similar ones in orange would be pasted on vehicles using diesel. It will be rolled out from the national capital by end of next month.
Prodded by the Supreme Court to adopt colour-coded stickers for vehicles, the Centre on Monday told a bench of Justices Madan B Lokur, S Abdul Nazeer and Deepak Gupta that the government had decided to amend the Central Motors Vehicles Rules to pave the way for mandatory pasting of stickers on cars.
The proposal for colour coding was mooted by advocate Aparajita Singh, who is assisting the court as amicus curiae. She pleaded that colour coding would be more effective than ‘evenodd scheme’ in controlling pollution whenever it reached alarming level as the authorities could identify polluting vehicles without examining them.
“It is important to classify fuel according to its polluting properties. This would help policy-makers and public in identifying cleaner vehicles. Paris has classified vehicles into six categories based on fuel and issued colour-coded stickers for identification. Similar colour-coded stickers can be used to identify vehicles in India and restrict the use of dirtier vehicles during poor category days. This would be more scientific than the ‘odd and even scheme’ that is being followed presently,” she told the bench.
Reduction of pollution: successes
2016-18
Vishwa Mohan, July 15, 2019: The Times of India
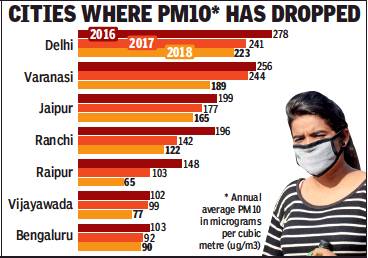
From: Vishwa Mohan, July 15, 2019: The Times of India
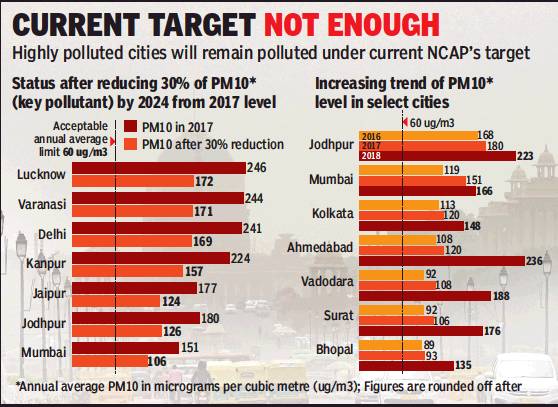
From: Vishwa Mohan, July 15, 2019: The Times of India
The national capital may be the most polluted city in the country but the level of a key pollutant, PM10, has been consistently declining here since 2016 unlike in less polluted cities such as Mumbai, Kolkata, Ahmedabad and Bhopal, where concentrations of the deadly particulate matter have increased in the last three years.
Analysis of data from 50 cities for 2016, 2017 and 2018 showed a declining trend in Delhi, Varanasi, Ranchi, Raipur, Vijayawada and Bengaluru, among others, whereas PM10 levels rose in Surat, Vadodara, Rajkot, Jodhpur, Kota, Gwalior and Jabalpur.
The government shared the data on PM10 in Parliament recently. Though data on PM2.5 levels is also available, the information is sketchy as many cities did not start measuring concentrations of these finer, respirable particles three years ago.
Around 14 cities showed an increasing trend in PM10. Another 14 showed a decreasing trend while the levels were fluctuating in 22 cities, including Agra, Kanpur, Lucknow, Allahabad, Patna, Amritsar, Nagpur, Pune, Hyderabad and Chandigarh.
Though the National Clean Air Programme, launched in January, aims to reduce both PM10 and PM2.5 concentrations in 102 cities by 20-30% by 2024 (from 2017 levels), the PM2.5 trend is currently available for only 17 cities.
Delhi measures helped cut PM 10 level
Analysis showed that many cities suffering from high pollution levels, including Delhi, Varanasi, Lucknow, Kanpur, Jaipur, Mumbai, Kolkata and Ahmedabad, will continue to be polluted even if target of reducing 30% of PM10 concentrations in the next five years is achieved.
This means the current target is not enough to bring level of pollutants to the acceptable limit — that is, an annual average of 60 micrograms per cubic metre (ug/ m3) — by 2024. It may be possible only by scaling up efforts in these cities.
Particulate matter can get deep into the lungs (particularly PM2.5) and some may even get into the bloodstream, causing serious health problems.
Steady decline in the levels of PM10 in Delhi may be attributed to multiple actions such as leapfrogging from BS-IV to BS-VI fuel standard, operationalisation of eastern and western peripheral expressways, implementing dust mitigation measures and closing down coal-based Badarpur thermal power plant, among others. Much more, however, needs to be done to substantially bring down the level of pollutants to the acceptable limit in the national capital and the other 101 cities identified under the NCAP.
Region-wise
Northern plains, pollution
The Times of India, May 13 2016
Amit Bhattacharya
The northern Indian plains have again come into focus as one of the globe's most-polluted regions, with nine of the world's 20 most polluted cities in the 2016 WHO urban air pollution database from this swathe of land. What make this region's air so foul? It's a confluence of factors, say experts, with geography , climate, population, agricultural practices as well as fossil fuel emissions all playing a part.
“A major reason for high pollution in the Indo-Gangetic plains is its geography. Located next to the Himalayas, this is a wind convergence zone which transports pollution from other places into these region,“ said Gufan Beig, project director of System of Air Quality and Weather Forecasting and Research (SAFAR), which monitors air quality in a number of cities.
The convergence factor shows up the most in winters, when the region sees spells of dense fog due to cold winds coming from the west. Fog traps pollutants, leading to sharp deterioration in air quality .Cold winds also leads to `inversion', wherein pollutants are trapped near the surface.
The northern plains also have among the highest population densities in the world.This translates to higher pollution from human activities.“The other major source of pollution is the practice of crop burning. During winters, soot from these fires hang in the air longer. The region also sees high use of coal and wood, which are very polluting, for cooking,“ Beig said. Ironically, the region's fertile alluvial soil, which attracted people to this belt, also contributes to its pollution. Alluvial soil is highly dusty when dry , say experts.
“Many parts of this region do not get much rain -the average for Delhi is 40 days in a year -which is why these places are very dusty ,“ said a CPCB official.
These natural causes have combined with growing vehicular and industrial emissions to make the plains the pollution hotspot of the world.
Delhi, Odisha, UP-MP among world’s NO2 hotspots
Delhi, Odisha and the Uttar Pradesh-Madhya Pradesh region are among the top 50 global hotspots for NO2 emissions, environmental watchdog ‘Greenpeace’ said on Monday after analysing new satellite data.
NO2 is a dangerous pollutant that impacts human health. The satellite data was gathered from European Space Agency’s Sentinel 5P satellite recorded between June and August 2018. Coal and vehicular emissions were identified as the two principal sources of NO2.
Greenpeace said toxic clouds hover over parts of Secunderabad and Hyderabad, Vijayawada, Vishakapatnam, Ramagundam in the two Telugu states. While the toxic clouds over the twin cities is due to vehicular pollution, in Vijayawada and Vizag it is due to vehicular pollution and presence of thermal plants while in Ramagundam it is due to thermal plants alone.
Ramagundam in Telangana has a Red Spot because of the highest level of NO2 thickness measured in Dobson units because of the presence of thermal plants there. The high presence of toxic clouds in Vishakapatnam and Atchyutyapuram is due to the presence of Vizag thermal power station, Simhadri power station and Vizag steel power plant, while in Vijayawada, it is due to Dr Narla Thermal power Plant. Ramagundam has very high NO2 clouds because of the thermal plants at Ramagundam, Paloncha and Kothagudem.
Former joint environmental chief scientist of Telangana Pollution Control Board Dr P Veeranna told TOI, “NO2 pollution is caused due to vehicular pollution. The concentration of nitrogen dioxide depends on the wind direction too. In Hyderabad, we don’t have other sources except for vehicular emissions. The boiler units of drug industries are small compared to thermal power plants.”
2020: PM2.5, NO2, rising in Delhi, Kanpur
April 30, 2021: The Times of India
Levels of air pollutants, such as fine particles (PM2.5) and nitrogen dioxide (NO2), both hazardous to health, are increasing in Kanpur and Delhi, according to scientists using observations from instruments on satellites that scan the global skies every day.
The findings, led by the University of Birmingham and University College London (UCL), showed that the rise in PM2.5 and NO2 reflect increasing vehicle ownership, industrialisation and the limited effect of air pollution policies to date. This contrasts with trends in the UK’s London and Birmingham, which show modest, but ongoing declines in PM2.5 and NOx, reflecting the success of policies targeting sources that emit these pollutants.
The study, published in the journal Atmospheric Chemistry and Physics, also showed increases in the air pollutant formaldehyde in Delhi, Kanpur and London. IANS
Uttarakhand
2021, Jan- May
June 6, 2021: The Times of India
The spate of forest fires earlier this year may have caused Dehradun’s air quality to plummet to ‘poor category’ — where air quality index (AQI) levels hover between 201 and 300 — for two straight months. In March, the AQI was 237, and April 225. This put Dehradun in the same range as Delhi, where the AQI swung between 190 to 250 during the same period.
“In all likelihood, the pollution rise in Dehradun in these two months can be related to the forest fires, with other factors like construction works and vehicular pollution also contributing,” said SP Subudhi, member secretary, state pollution control board.
Rishikesh, which neighbours Dehradun, also witnessed poor AQI of 221 during March. Covid curfew seems to have had little impact on the environment of Uttarakhand this time unlike previous year’s lockdown when the air quality in March and April remained in ‘moderate and satisfactory categories’ with AQI levels between 51 and 200 across the state.
In March, the state lost 868.4 hectares of forest cover in 627 fire incidents whereas April saw 1,807 fire incidents and the loss of 24,18.65 hectares of forest cover. The intensity of forest fires this year could be gauged by the fact that in April IAF choppers called from Bareilly for fire-fighting in Kumaon could not take off because the smoke was extremely dense.
Season-wise
Seasons having high air pollution
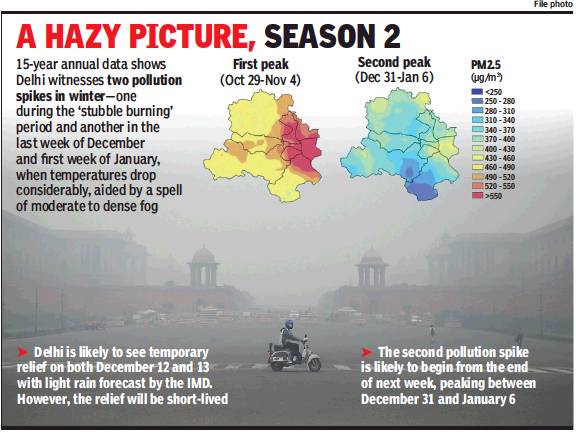
From: Jasjeev Gandhiok, August 10, 2021: The Times of India
See graphic:
The two seasons when air pollution peaks in Delhi
Winter
Air no good in any of winter months: Study, March 18, 2017: The Times of India
89% Of Days In `Poor' Category
The Centre for Environment and Energy Development (CEED) on Friday released a report on `ambient air quality of Delhi' for winter months, which depicted alarming levels of PM 2.5 in the capital between November and February .
Not a single day in the four-month-long winter season was noted under the “good“ air quality category , while a whopping 89% of the total days fell into either the “poor“ or “very poor“ categories of the graded response action plan (GRAP) notified by the Supreme court.The report also noted that 6% of the total winter days fell into the “severe“ category, with PM 2.5 levels between 250-300 microgramscubic metre.
According to the report, 981 microgramscubic metre was the maximum 24-hour average concentration of PM 2.5 observed, which was recorded at the monitoring station of Delhi Technologi cal University (DTU) near Bawana Industrial Area on November 5. This is 16 times higher than the prescribed limits of 60 microgramscubic metre for the 24-hour rolling average of PM 2.5. “The air quality of the city was unbreathable and is choking its residents, especially those more vulnerable to it. It is a crisis looming at our faces and we cannot turn a blind eye to it. GRAP is the way forward and will help in improving the situation,“ said Dimpy Suneja, programme officer, CEED.
The findings have been based on data collected from 10 real-time air monitoring stations in Delhi, set up by the Central Pollution Control Board (CPCB). The findings were recorded between November 2016 and February 2017 from stations including ITO, Anand Vihar, Mandir Marg and Punjabi Bagh. The report also revealed that the monthly mean values showed a downward trend from November onwards.
Monsoon
For first time in 2018, you are breathing ‘good air’ , July 29, 2018: The Times of India

The city recorded safe PM 2.5 (fine, respirable particulate matter) concentrations after the onset of monsoon
From: For first time in 2018, you are breathing ‘good air’ , July 29, 2018: The Times of India
While showers may be stopping you from venturing outdoors, now is the best time to step out in the open. The city’s air quality has turned “good” for the first time this year as rains wash away pollutants.
The city has been recording safe PM 2.5 (fine, respirable particulate matter) concentrations since the onset of monsoon. On Saturday, the running average PM 2.5 concentration was measured at 29 micrograms per cubic metres, according to System of Air Quality and Weather Forecasting Research. The 24-hour safe standard is 60.
The air quality is likely to deteriorate once the monsoon ends and stubble burning starts towards the end of September and early October.
SAFAR’s forecast shows that PM10 and PM2.5 concentrations will remain in the ‘good’ category. Delhi’s overall Air Quality Index (AQI) was recorded at just 43 on Friday which classified as ‘good’, while it was 58 on Saturday — which falls into the ‘satisfactory’ category of Central Pollution Control Board’s index.
An AQI in the range of 0-50 is classified as ‘Good’, 51-100 as ‘satisfactory’.
The pollution board’s realtime air quality monitoring shows that Delhi is recording the best PM 2.5 levels this year. In the last seven days, its air quality has been in the ‘safe’ zone with a sharp dip in PM2.5 levels on Friday. According to CPCB, PM 10 concentrations ranged 93 micrograms per cubic metres to 39 in the last seven days, while PM 2.5 concentrations ranged from 73 to 31.
Solutions
Scrap laws for Preservation of Sub Soil Water
Sudhir Vohra, Nov 9, 2019: The Times of India
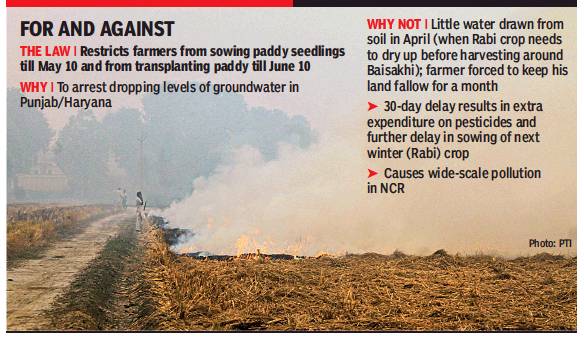
From: Sudhir Vohra, Nov 9, 2019: The Times of India
In the escalating debate on the effect of stubble burningwhich causes farm fires in Punjab and Haryana —on air quality in Delhi and rest of NCR, one important point has been missed. And that is where lies the root of the problem.
In 2007 and 2008, Punjab State Farmers and Farm Workers’ Commission (PSFC), a body tasked to look at issues concerning farmers in that state, suggested that the sowing of paddy in the state be delayed by a month. This it said could be achieved by enacting a law restricting farmers from sowing their paddy seedlings till the 10th of May and from transplanting paddy till the 10th of June every year.
The immediate objective of that proposed legislation was to arrest the dropping levels of groundwater in the state. Initially, both Congress and Akali governments shied away from enacting such a law (as they felt it would not be liked by farmers) , The Punjab Preservation of Sub Soil Water Act, 2009, was finally enacted. Haryana quickly enacted an identical act in 2010.
Both states have been growing paddy since the early seventies, three decades before the act was notified. Paddy is a water guzzling crop and it indeed leads to depletion of groundwater in some regions of these states. This move, however, failed to anticipate its effect on the neighbouring states.
Farmers in both states began delaying their paddy crop by about 30 days. The farmers used to begin the sowing of seedlings earlier in April, right after harvesting the wheat crop and sometimes even earlier as the area needed for seedlings is about 1% of the area needed post transplantation. This initial 30 days of delay in the sowing pattern had various implications for the crop .
First, the advantage of a hardy, disease-resistance paddy was lost. April and May are hot and dry months in these states. This helps the seedlings to become hardier and less disease-prone when transplanted after the customary 30 days of growth. This advantage was lost post 2009 and resulted in excessive use of chemical medicines.
Secondly, the harvesting date of the paddy crop was advanced by 30 days, and sometimes more. That resulted in the crop being harvested in late October and early November, months which coincide with Diwali as well as with the weeks when the autumn air gets colder and heavier. This delay of a month or more also coincides with burning of autumn leaves and of the post-monsoon brush growth which also adds to the air pollution.
Prior to the enactment of Punjab Preservation of Sub Soil Water Act, 2009, the paddy crop would be harvested in late September, just when the monsoon starts its retreat and when the air is cleaner. Since there is no cold weather to bother about in September, there is no fog or smog.
Agricultural technocrats in the Punjab state may still argue that the act helps in conserving groundwater in April and May and thus it made sense to enact the law then. What they don't want to tell us is that very little water is drawn from the soil in April (when the Rabi crop needs to dry up before harvesting around Baisakhi) and the farmer is forced to keep his land fallow for a month because of the act and that one month is not good for anything meaningful to be grown. They also fail to tell us that the 30-day delay forced on them by the act results in both extra expenditure on pesticides as well as a further delay in sowing of the next winter (Rabi) crop. And, of course, they don’t tell us how this 30-day delay causes pollution in the NCR and the “downward states” south of Punjab and Haryana.
While paddy needs water, one of the reasons for the water crisis in Punjab and Haryana is the decrepit state of the canal system, especially for agricultural use. Much of canal water is now being used to feed urban areas with drinking water and the original beautiful canal network and its associated advantage of recharging agricultural aquifers has been lost. The result is that whatever groundwater recharge takes place now is from the monsoon rain and not from the canal system.
Now that we know that the foul air in NCR is largely due to the untimely burning of crop straw in Punjab and Haryana, it may be time for the Centre to review the act.
Stoves (chulhas) pollute villages
The Times of India Jan 09 2016
Vaishnavi Chandrashekhar
New Study Calls For Integrated Approach That Focuses On Reducing Exposure Not Emissions
Who's more affected by toxic air: A young executive in New Delhi or a housewife in a Haryana village?
One might assume the executive is worse off -after all, Delhi has the world's worst air. Yet a village woman who cooks over a dung-fuelled chulha for several hours a day could be more exposed to hazardous pollutants than a Delhi office worker.
This distinction between ambient pollution levels and individual exposure lies at the heart of a new report from a Union health ministry committee that -correcting a historical focus on urban air pollution -highlights the importance of tackling pollution from the burning of dung and wood in village chulhas across India.
The report, made available on the health ministry's website this week, calls for an integrated approach to air pollu tion that focuses on “reducing exposures not emissions“.
“All pollution is bad but, with the intention of eventually taking care of all of it, where do you focus your efforts first?“ said Ambuj Sagar, committee co-chair and Vipula and Mahesh Chaturvedi Professor of Policy Studies at the Indian Institute of Technology in Delhi. “From a health standpoint, you prioritise reduction in areas and sources that most affect people directly.“
Top of the committee's list: reducing household air pollution from cooking with biomass because the proximity to humans makes stove smoke most harmful -next only to cigarette smoking.
Household cooking is “probably the largest single source of exposure in the country , although only one of many contributors to ambient air pollution,“ the report said.Most rural households in India, an estimated 780 million people, continue to rely on wood, dung and other biomass for cooking, while a good percentage of urban households also use non-LPG stoves.
Next on the committee's priority list: pollution from vehicles, garbage burning, and diesel generator sets -all micro or local sources of pollution. Then comes road and construction dust, followed by brick kilns, local industries, and then power plants and other large industries. Conventionally , environmental policy has focused on large-scale sources of ambient pollution. Road dust, for example, is thought to be a bigger source of pollution in Delhi than vehicles.
“The standard practice of ranking pollution sources on the basis of their contribution to ambient emissions...may be creating distortions in their apparent relative importance from the health standpoint, although perhaps adequate for other purposes -visibility , for example,“ the report says.
“Evaluation by exposure will not only re-order the ranking of major outdoor emission sources but will reveal an entirely different landscape of sources; those that may significantly affect exposure without appreciably affecting ambient concentration.“
Much more data and studies are needed to understand pollution patterns, Sagar said.Monitoring of air pollution is still largely confined to cities, the report notes, and monitors tend to be on rooftops “where people hardly ever are“.
To reduce household pollution, the report advocates expanding power and gas coverage as well as innovating cleaner stoves and running public health campaigns.Tackling air pollution should be part of the Swachh Bharat campaign, the committee said.
Emissions from cooking with biomass also contribute a quarter of ambient PM2.5 levels in the country , the report notes.
Vehicular emissions
Emission test norms lax: CSE
Emission test norms lax: CSE The Times of India, Feb 4, 2017
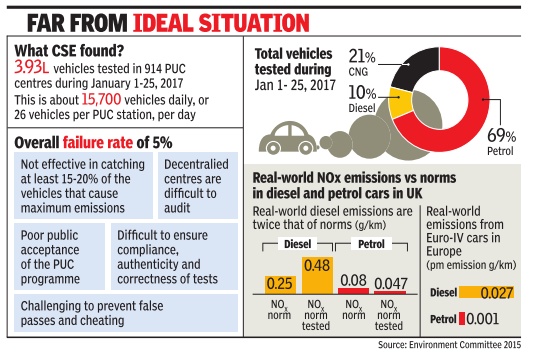
Only 5% of 3.93 lakh vehicles checked at 614 pollution under control (PUC) centres in Delhi between January 1 and 25 failed the emission test, according to data released by Centre for Science and Environment (CSE). While this may seem like great news given the poor air quality in the capital, the tiny fail percentage raises serious questions about the efficiency of the system.
CSE researchers claim the data gathered from the transport department only show a huge inefficiency in dealing with vehicular emissions through the PUC system. The PUC norms for onroad vehicles are extremely lax for the older or pre-BS-IV vehicles. For diesel vehicles, only a smoke density test is carried out, which are particularly lenient--for BS-IV compliant vehicles, the norm is 50 hartridge smoke density (HSU) and 65 HSU for pre-BSIV vehicles.
The norm in Singapore and Pakistan is 40 HSU while it is 50 HSU in Indonesia, Thailand, Hong Kong and Malaysia. “It's like the norm itself is meant to catch the absolute worst offender. Why not also catch the other bad ones,“ asked a CSE researcher. Participants at a round-table on “Reinventing in-use emissions compliance regime“, held on Friday , discussed how not only were the standards lax, but there was too much corruption in the system.
“They (PUC centres) clear the vehicles because they will not get the money for the test otherwise. We have seen it happening several times,“ said a CPCB official present at the meeting.
The Supreme Court has directed the Environment Pollution Control Authority (EPCA) to audit all the 614 PUC stations. An audit carried out by CPCB in 2013 at 76 PUC centres had also exposed a number of anomalies, including non-compliance of the code of practice, poor condition of the laboratories, non-functioning analysers.
The CSE round-table also flagged the fact that the PUC system was not even designed to test tiny particles and oxides of nitrogen (NOx) emissions.
Carbon emission intensity
2005-10: emissions reduced by 12%
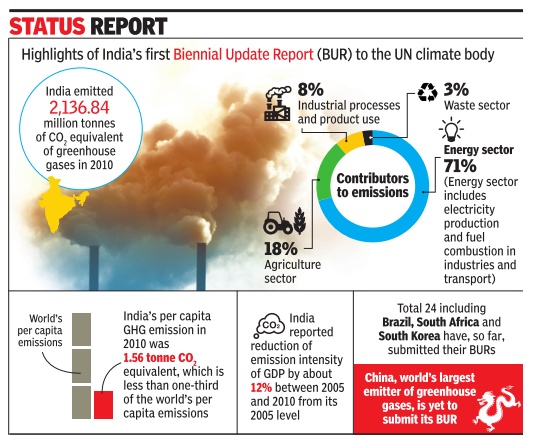
Sources:
1. The Times of India, January 23, 2016
2. The Times of India, January 23, 2016, Vishwa Mohan
India emission down 12% in five years India is on course to fulfil its global commitment, having voluntarily cut its carbon emission intensity (emission per unit of GDP) by about 12% between 2005 and 2010, according to its report submitted to a UN climate body , reports Vishwa Mohan. The result shows the country is in line to reach its 20-25% reduction target by 2020 and subsequently the 33-35% emission intensity reduction goal by 2030 as promised by it.
Just weeks after the Paris deal of December 2015, India submitted its first Biennial Update Report (BUR) to a UN climate body highlighting that the country is well on course to fullfil its global commitment by voluntarily cutting its carbon emission intensity (emission per unit of GDP) by about 12% between 2005 and 2010.
The result appears encou raging as it shows that the country is in line to reach its 2025% reduction target by 2020 and subsequently the 33-35% emission intensity reduction goal by 2030 as promised by it in the country's climate action plan to the UN body . The BUR was submitted by India under its obligation to inform the United Nations Framework Convention on Climate Change (UNFCCC) about its action on the ground to deal with the challenges of climate change. As per the provisions of the Convention, countries need to periodically provide information in the form of their National Communication'.
The Paris climate agreement, reached by 195 countries on December 13 last year, had called for developing countries to submit their first biennial update reports as soon as possible. So far, 24 developing countries including Brazil, South Africa and South Korea have submitted the ir BURs. China, the world's largest emitter of greenhouse gases, is yet to submit its report. Brazil has submitted its report, but has given only provisional inventory .
Developed countries, on the other hand, are required to submit a report known as the Biennial Report (BR), which is to be submitted every alternate year and is subjected to International Ana lysis and Review (IAR). But, the BURs of developing countries are subjected to an international process known as International Consultation and Analysis (ICA). It is a process that includes international scrutiny of BUR in a manner that is “non-intrusive, non-punitive and respectful of national sovereignty“.
India's BUR was prepared by the ministry of environ ment and climate change in consultations with various public and private institutions. It was approved by the Union Cabinet on Wednesday .According to India's BUR, the country had emitted 2,136.84 million tonnes of CO2 equivalent greenhouse gases in 2010.About 12% of the emissions were, however, offset by carbon sink action of forests and croplands.
Car emission testing
Serious flaws: CSE, 2017
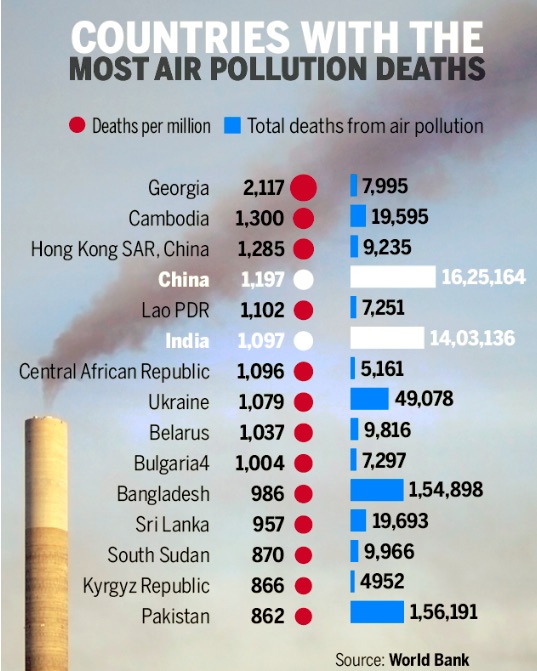
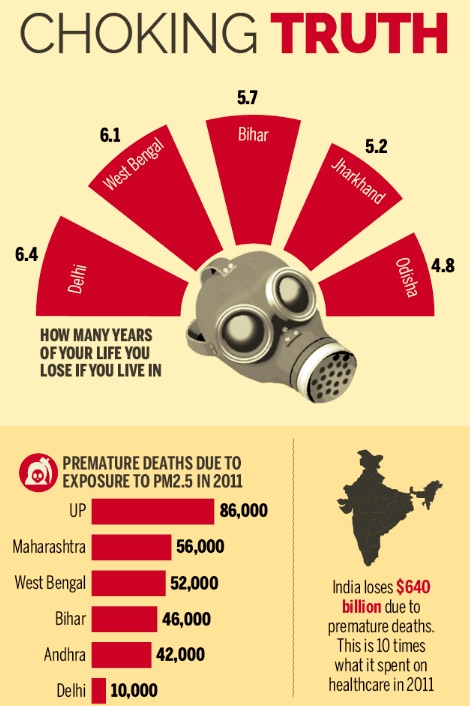
HIGHLIGHTS
A Centre for Science and Environment (CSE) report urges for urgent steps to upgrade the current in-use emission testing
It says PUC centres must be checked, testing procedure upgraded and auto makers made accountable
CSE warns of alarming consequences if current situation continues to prevail
One of the biggest corporate frauds in the global automobile industry - the Volkswagen defeat device case - and the mounting evidence from Europe that most new diesel cars are emitting much higher than their certification levels, have largely gone unnoticed in India.
Centre for Science and Environment (CSE) has strongly urged for urgent steps to upgrade the current in-use emission testing, prepare for real driving emission testing with portable emission monitoring systems for Euro VI vehicles and make vehicle manufacturers liable and accountable for emission performance of vehicles during their useful life on the road.
The current practice of pollution under control programme (PUC) is rudimentary and ineffective. It is not designed to address complex emissions control systems in new vehicles. This cannot screen inherent technical flaws and frauds for which manufacturers are responsible that compromise the emissions performance in the real world.
The key highlights of the CSE analysis:
Very poor PUC compliance and ineffective tests
The PUC system, the only system to check emissions from on-road vehicles in India is extremely weak in terms of lax norms, poor enforcement and poor quality test procedures. New data from the Delhi Transport Department shows that failure rate is as dismal as 5 per cent - nearly all vehicles pass the test. There is no data, however, on how many vehicles show up for the test.
The PUC norms for on-road vehicles are extremely lax for the older pre-Bharat stage IV vehicles. While under PUC, petrol cars are tested for carbon monoxide and hydrocarbons along with lambda (that indicates the optimum condition needed for proper functioning of catalytic converters), diesel vehicles are tested only for smoke density. While all norms are lax, those for on-road diesel vehicles are particularly lenient - smoke density norms are 50 HSU only for the Bharat Stage IV-compliant diesel vehicles. For pre-BS-IV vehicles, the norm is as lax as 65 HSU. In Singapore and Pakistan, this norm is 40 HSU; in Indonesia, Thailand, Hong Kong and Malaysia it is 50 HSU for all genre of vehicles.
This is a serious issue at a time when Delhi, which already has more than 614 PUC centres, is trying set up more. This investment can go waste without an effective system in place.
Serious concern over quality of checks in PUC centres
The Supreme Court has recently given directions to the EPCA to audit all the 614 PUC stations. There are serious concerns over quality and credibility of PUC tests across the cities. In fact, a detailed audit that was carried out by the Central Pollution Control Board in 2013 in 76 PUC centres exposed serious anomalies - non-compliance with the code of practice; unavailability of calibration certificate for testing instruments in several centres; poor condition of laboratory; leak test failure; and non-functioning analysers. This clearly brings out the ineffectiveness of the programme.
Smoke density test under PUC cannot check particulate emissions
The smoke test was introduced in the 1960s to reduce the visibility problems due to diesel smoke. There is no real correlation between smoke density and particle emissions. Smoke is not a good surrogate for tiny particles. There can be a risk of misclassifying polluters - low smoke emissions can also mean high particulate emissions. Even in Europe, virtually no vehicle fails the smoke test. Other governments including ones in China, Hong Kong, Singapore, the US, etc now conduct these tests on chassis dynamometer to simulate speed. This makes the emissions test more rigorous. China is further developing a nationwide I/M system for evaluating NOx emissions from in-use HDVs.
Tests are needed to prevent emissions frauds or poor emissions performance of advanced emissions control systems on roads - especially diesel vehicles
The PUC system is not even designed to test tiny particles and NOx on road - the key concerns from diesel vehicles. Volkswagen was caught cheating on NOx emissions. In fact, too much focus on reducing smoke can actually increase NOx emissions as a trade-off. But new generation diesel vehicles will come with advanced emissions control systems to reduce particulate and NOx. If these systems perform sub-optimally, there can be uncontrolled emissions.
The fact that India is totally unprepared to prevent emissions frauds and underperformance of emissions control systems on roads was proved a few years ago when the Tavera fraud case of General Motors was exposed. These models passed the certification tests with one set of engines that did not the match those actually sold in the market. But this incident did not lead to any major reform to establish in-use compliance norms and monitoring in India.
The Indian government does not have the power to penalise manufacturers for non-compliance and violation. This has serious implications as the next level of Euro V and Euro VI standards will require advanced particulate traps and NOx control systems like SCR to cut toxic diesel emissions. If engineering deficiency reduces the effectiveness of these systems or if these are not properly operated like urea refilling in SCR system, it can lead to uncontrolled emissions and nullify pollution control measures in our cities.
India has already specified more advanced On Board Diagnostic Systems in post-2013 vehicles. This should be integrated with vehicle inspection programme for more effective monitoring.
If a problem or malfunction is detected, the OBD II system illuminates a warning light on the vehicle instrument panel to alert the driver. This warning light will typically display the phrase "Check Engine" or "Service Engine Soon," and will often include an engine symbol. The OBD system stores important information about any detected malfunction so that a repair technician can accurately find and fix the problem. It is notified to monitor catalyst, fuel injection system, particulate trap, coolant temperature, EGR, fuel system, emission control systems, etc.
Smog-check inspections in USA for post-2000 model vehicles are now primarily based on an inspection of the OBD II system - tailpipe testing is no longer required. It identifies emission-related components covered under warranty, eliminates unnecessary repairs, and gives information about area of malfunction or a specific component. This reduces cost of warranty repairs and ensures customer satisfaction, allows early detection of malfunctions etc. But this system will require strong surveillance and appropriate software to work effectively.
Auto company and its accountability
India also needs strong compliance regulations to make manufacturers responsible for on-road emissions performance for a vehicle's useful life on road
Consistent with the global best practices, India needs an independent authority to check emissions against standards; issue recall of vehicles by companies if they are found non-compliant; levy fines on defaulting companies; and withdraw approval of sale if vehicles do not conform with the stated emissions targets. An independent authority should monitor this process without being influenced by industry. Only such a system will make non-compliance with regulations more expensive for companies than compliance with regulations and ensure implementation. The Auto Fuel Policy committee has recommended an emissions warranty and recall programme and in-use compliance regulations. But this has not been implemented.
CSE's review shows that currently, Indian certification agencies do not select vehicle samples for certification tests randomly and independently. In fact, certification agencies give prior notice to manufacturers about the approximate time during which samples will be collected from a given lot. This compromises independent and impartial testing. Legal procedures for the MoRTH to issue mandatory recalls or levy fines have not been established yet.
Moreover, there is no system post-sales (as in the US) to allow testing agencies to select any vehicle, anywhere, and at any time, without prior notice to the manufacturer. India urgently needs rules for the government and manufacturers to remove non-compliant vehicles. A mandatory recall policy for non-compliant vehicles is needed to ensure that manufacturers design vehicles to comply with emission standards for the duration of their useful life.
In fact, China has taken steps to move in this direction. China has recently revised its programmes to allow the selection of vehicles at random without any prior notice. Furthermore, COP testing in China is now corroborated through inter-laboratory round-robin testing, which adds an additional level of scrutiny.
Vehicles and their carbon footprint
As in 2019
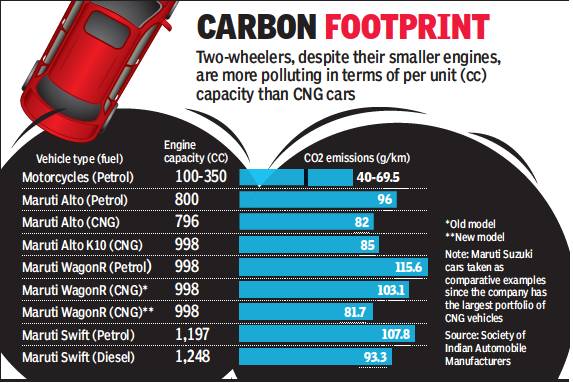
From: Sanjay Dutta, Oct 16, 2019: The Times of India
See graphic:
Vehicles and their carbon footprint, As in 2019
Where the problem is the gravest
Bus travellers inhale less soot than those in cars
Commuting by bus in Delhi exposes you to the lowest concentrations of fine-particle pollutants called black carbon, or soot, as compared with other modes of transport -even lower than the exposure you are likely to get travelling in a car, a study reveals.
The study , published in Elsevier journal on environmental research, assessed people's personal exposure to pollution in Delhi. For outdoor exposure, it considered commuters in cars, buses and autorickshaws.
Travellers in autorickshaws were found to be at the highest risk of inhaling soot, a product of incomplete fuel combustion with harmful impacts on the lungs and heart.
“Exposure to particles is lower in cars than on two-wheelers and autorickshaws, but driving a car with open windows could lead to similar levels (of exposure) as in an auto,“ said Pallavi Pant, lead author of the study . Pant admitted that the find ings on exposure to pollu tion inside a car was surprising. “From the current analyses, black carbon concentrations in buses seem to be lower in comparison to other modes, but more research is needed to confirm this, both in Delhi and other cities. AC use can help reduce exposure in cars,“ she said.
It's not only being out on the roads that exposes you to respirable pollution particles.Your home, especially the kitchen, could be enveloping you in PM2.5 pollutants too, the study said.
It found high exposure to PM 2.5 pollutants in indoor activities such as cleaning or cooking. However, the nature of pollution indoors differs from that outdoors. According to Pant, exhaust emissions on the roads could be far more toxic than say pollutants arising from cooking or cleaning.“Cooking emissions often comprise ultrafine particles that can be harmful,“ Pant said. “Research on ultrafine particles is ongoing, but so far we know they can have several adverse health effects.“ Pant suggested opening the windows and using exhaust fans during cooking or cleaning to avoid accumulation of such pollutants.
Buses, because they use CNG as fuel in Delhi, do not emit soot and are safer. Also, bus passengers sit at an elevated height compared with autorickshaws and cars and avoid the denser pollution layer near the road surface. In cities where buses run on diesel, they may , however, show higher levels of black carbon. An in-depth analysis is required to confirm this.
The authors, from the University of Massachusetts, Amherst, IIT Delhi and University of Washington, have suggested more studies on in-vehicle exposure. “Future studies should look at in-vehicle exposure with respect to land use and traffic characteristics, and personal exposure data should be used as an input for land use zoning and urban transportation planning,“ the study concluded.
The researchers worked with healthy volunteers, men and women, aged 18 to 60 years.Their individual exposure to pollution was sampled using portable sampling devices.Commute exposure was recorded on a 22km sampling route, including a section of the busy Mathura Road-National Highway 2, during peak hours (810am and 68pm) and offpeak times (12 noon-2pm). Most volunteers were non-smokers and all used LPG as cooking medium at home. They spent 40-90 minutes commuting daily and 8 to 10 hours at work.
The study also reported that pollution risk is higher in winter than in summer. “The pattern for personal exposure to particles is similar to ambient air quality , and can be as much as six times higher than the national air quality standard in winter,“ said Pant.
See also
Air pollution: India
