Air pollution: India
This is a collection of articles archived for the excellence of their content. |
Contents |
2013
The Times of India, Sep 09 2016
Atul Thakur
1.4m lives lost in India due to air pollution in 2013: Study
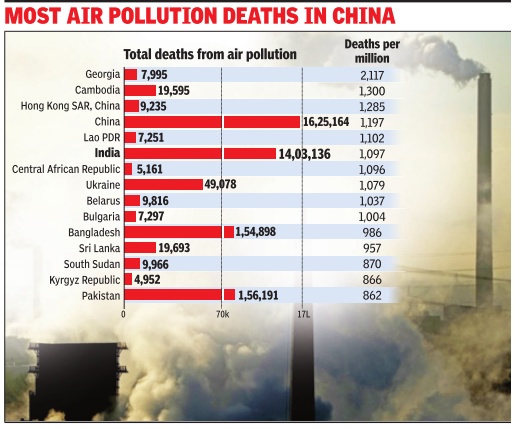
India lost 1.4 million lives to air pollution in 2013, while in China the toll was 1.6 million, estimates a World Bank report released on Thursday . The report, released by the World Bank and the Institute for Health Metrics and Evaluation, shows that in 2013 more than five million deaths worldwide were attributed to health conditions caused by air pollution. About 60% of them were in the world's two most populous countries.
Exposure to air pollution increases a person's risk of contracting ailments such as lung cancer, stroke, heart disease and chronic bronchitis.
China and India aren't among the worst hit in absolute terms because of the sheer size of their respective populations. Even after adjusting for population, these two countries along with Bangladesh, Sri Lanka and Pakistan were among the 15 nations with the highest toll per million population.
China and India ranked 4th and 6th worst in the world respectively . Bangladesh, Sri Lanka and Pakistan were ranked 11th, 12th and 15th on this count.
The bank estimates that in 2013 Georgia saw the highest rate of air pollution deaths per million of its population at 2,117. It was fol lowed by Cambodia with a death rate of 1,300 per million.
Among the 142 countries for which the bank complied this data, there were 10 where the rate was higher than 1,000 deaths per million. Australia fared best on this parameter with an estimated death rate of 34 per million.
The report also estimat ed that air pollution cost the world economy more than $5 trillion -purchasing power parities (PPP) at 2011 prices -in welfare losses and an additional $66 billion worth of manpower loss.
China's overall welfare and manpower loss was $1.6 trillion while India lost more than $560 billion, which was equivalent to over 10% of China's and 8.5% of India's GDP .
Air pollution is estimated to be the fourth leading fatal health risk worldwide after metabolic risks, dietary risks and tobacco smoke. The estimates are based on exposure to PM2.5 pollutants. It is noticeable in the report that the risks are much higher in the developing world.
By damaging people's health and causing fatal diseases, air pollution can have a lasting effect on a person's economic productivity .
Experts argue that typically the economically weakest section is the worst hit because of limited access to health care facilities. Thus, exposure to bad air quality and other risks will ultimately widen the existing economic inequalities, they say.
Stoves (chulhas) pollute villages
The Times of India Jan 09 2016
Vaishnavi Chandrashekhar
New Study Calls For Integrated Approach That Focuses On Reducing Exposure Not Emissions
Who's more affected by toxic air: A young executive in New Delhi or a housewife in a Haryana village?
One might assume the executive is worse off -after all, Delhi has the world's worst air. Yet a village woman who cooks over a dung-fuelled chulha for several hours a day could be more exposed to hazardous pollutants than a Delhi office worker.
This distinction between ambient pollution levels and individual exposure lies at the heart of a new report from a Union health ministry committee that -correcting a historical focus on urban air pollution -highlights the importance of tackling pollution from the burning of dung and wood in village chulhas across India.
The report, made available on the health ministry's website this week, calls for an integrated approach to air pollu tion that focuses on “reducing exposures not emissions“.
“All pollution is bad but, with the intention of eventually taking care of all of it, where do you focus your efforts first?“ said Ambuj Sagar, committee co-chair and Vipula and Mahesh Chaturvedi Professor of Policy Studies at the Indian Institute of Technology in Delhi. “From a health standpoint, you prioritise reduction in areas and sources that most affect people directly.“
Top of the committee's list: reducing household air pollution from cooking with biomass because the proximity to humans makes stove smoke most harmful -next only to cigarette smoking.
Household cooking is “probably the largest single source of exposure in the country , although only one of many contributors to ambient air pollution,“ the report said.Most rural households in India, an estimated 780 million people, continue to rely on wood, dung and other biomass for cooking, while a good percentage of urban households also use non-LPG stoves.
Next on the committee's priority list: pollution from vehicles, garbage burning, and diesel generator sets -all micro or local sources of pollution. Then comes road and construction dust, followed by brick kilns, local industries, and then power plants and other large industries. Conventionally , environmental policy has focused on large-scale sources of ambient pollution. Road dust, for example, is thought to be a bigger source of pollution in Delhi than vehicles.
“The standard practice of ranking pollution sources on the basis of their contribution to ambient emissions...may be creating distortions in their apparent relative importance from the health standpoint, although perhaps adequate for other purposes -visibility , for example,“ the report says.
“Evaluation by exposure will not only re-order the ranking of major outdoor emission sources but will reveal an entirely different landscape of sources; those that may significantly affect exposure without appreciably affecting ambient concentration.“
Much more data and studies are needed to understand pollution patterns, Sagar said.Monitoring of air pollution is still largely confined to cities, the report notes, and monitors tend to be on rooftops “where people hardly ever are“.
To reduce household pollution, the report advocates expanding power and gas coverage as well as innovating cleaner stoves and running public health campaigns.Tackling air pollution should be part of the Swachh Bharat campaign, the committee said.
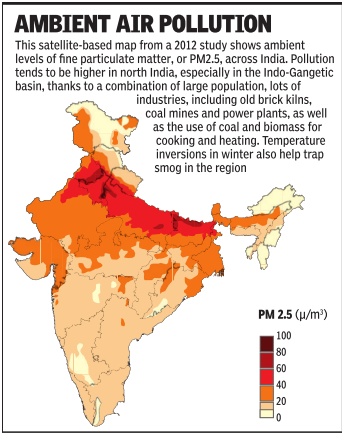
Emissions from cooking with biomass also contribute a quarter of ambient PM2.5 levels in the country , the report notes.
Carbon emission intensity
2005-10: emissions reduced by 12%
Sources:
1. The Times of India, January 23, 2016
2. The Times of India, January 23, 2016, Vishwa Mohan
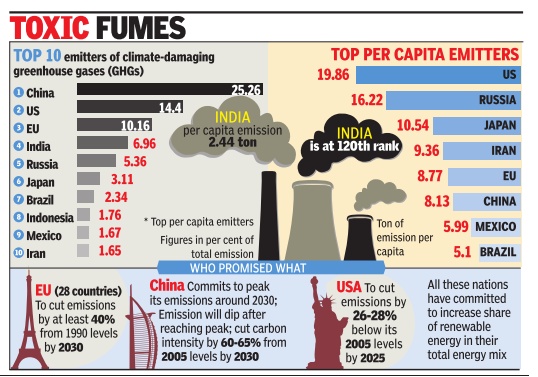
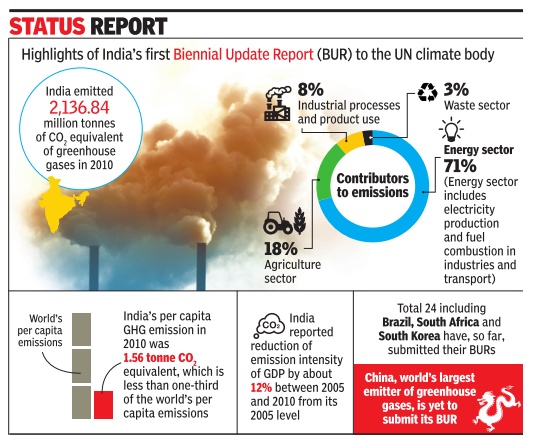
India emission down 12% in five years India is on course to fulfil its global commitment, having voluntarily cut its carbon emission intensity (emission per unit of GDP) by about 12% between 2005 and 2010, according to its report submitted to a UN climate body , reports Vishwa Mohan. The result shows the country is in line to reach its 20-25% reduction target by 2020 and subsequently the 33-35% emission intensity reduction goal by 2030 as promised by it. Just weeks after the Paris deal of December 2015, India submitted its first Biennial Update Report (BUR) to a UN climate body highlighting that the country is well on course to fullfil its global commitment by voluntarily cutting its carbon emission intensity (emission per unit of GDP) by about 12% between 2005 and 2010. The result appears encou raging as it shows that the country is in line to reach its 2025% reduction target by 2020 and subsequently the 33-35% emission intensity reduction goal by 2030 as promised by it in the country's climate action plan to the UN body . The BUR was submitted by India under its obligation to inform the United Nations Framework Convention on Climate Change (UNFCCC) about its action on the ground to deal with the challenges of climate change. As per the provisions of the Convention, countries need to periodically provide information in the form of their National Communication'.
The Paris climate agreement, reached by 195 countries on December 13 last year, had called for developing countries to submit their first biennial update reports as soon as possible. So far, 24 developing countries including Brazil, South Africa and South Korea have submitted the ir BURs. China, the world's largest emitter of greenhouse gases, is yet to submit its report. Brazil has submitted its report, but has given only provisional inventory .
Developed countries, on the other hand, are required to submit a report known as the Biennial Report (BR), which is to be submitted every alternate year and is subjected to International Ana lysis and Review (IAR). But, the BURs of developing countries are subjected to an international process known as International Consultation and Analysis (ICA). It is a process that includes international scrutiny of BUR in a manner that is “non-intrusive, non-punitive and respectful of national sovereignty“.
India's BUR was prepared by the ministry of environ ment and climate change in consultations with various public and private institutions. It was approved by the Union Cabinet on Wednesday .According to India's BUR, the country had emitted 2,136.84 million tonnes of CO2 equivalent greenhouse gases in 2010.About 12% of the emissions were, however, offset by carbon sink action of forests and croplands.
Fog in North-Central India (UP, Bihar, Bengal, NCR)
The Times of India, Feb 06 2016
Vaishnavi Chandrashekhar
UP, Bihar, West Bengal see more fog than NCR
When it comes to fog in north India, the large number of flight cancellations helps keep the spotlight irmly on New Delhi. But a new study suggests that the national capital region may not be the area most affected by the phenomenon. The frequency of fog occurrences has increased in the past 15 years in the eastern parts of the Indo-Gangetic plains -including eastern UP, Bihar, West Bengal, Bang adesh, as well as the Nepal Terai -but not in the western parts including Delhi, according to a satellite data analysis by IIT-Bombay researchers led by Ritesh Gautam.
The new findings are surprising because previous research has shown an increase n fog frequency over Delhi and surrounding areaslinked to a rise in humidity and pol ution. By contrast the new study , which was presented at the American Geophysical Union conference in December, found high year-to-year variability in fog occurrence over the Delhi region --linked to variability in weather conditions --but no longterm rise in the past decadeand-a-half.
Gautam, an assistant pro essor at IIT's centre of studies in resources engineering and climate studies, said the divergence could be because most other studies have relied on visibility measurements.
“When the visibility falls to less than one-km, it is classified as fog,“ he said. “But it might just be polluted haze.“
Satellite data has its own limitations. But Gautam said that the team had also found corroborative trends in surface data from 2000-2015.
The increase in fog over the eastern region coincided with a rise in pollution, the IIT analysis also found. Other studies have also shown a ink between increasing winter-time pollution and fogginess. Pollution particles, especially those known as aerosols, attract water vapour, promoting the formation of fog droplets.
In this case, Gautam suggested that the westerlies -winds flowing from north west of India -transport pol lution eastwards, leading to an accumulation over the eas tern Indo-Gangetic plains.
The findings point to the need for broadening fog study beyond the capital region Gautam said. “Although most of north India experiences fog and pollution in winter the focus is mostly on Delhi,“ said the former Nasa resear cher. “There should be incre ased focus over both urban and rural locations in nort hern India.“
Interestingly , a previous study by Gautam's team fo und holes in the fog cover over Delhi and other cities. This could be due to higher tempe ratures from urban heat is lands, the study suggested.
These studies stem from IIT-Bombay's Fog South Asia initiative (fogsoutha sia.com), a satellite monito ring system for fog detection being developed to aid the go vernment in forecasting and transport management.
The initiative is part of a slew of new efforts to decip her an important yet under studied phenomenon in So uth Asia, including the role played by air pollution.
In December, the Indian Meteorological Department and the Indian Institute of Tropical Meteorology started a five-year study of fog in Delhi. The same month, a regional fog study was launched by the International Centre for Integrated Mountain Development (ICIMOD), an intergovernmental think-tank based in Kathmandu. The project is being conducted with the collaboration of scientists across India, Pakistan, Bhutan, Nepal and Bangladesh.
“The issue of fog is such that it cannot be studied locally and thus needs regional cooperation,“ said Bhupesh Adhikary , air quality specialist at ICIMOD.
The project involves collecting pollution and meteorology data in various locations along with satellite-based data, to understand the chemical science. “At the same time, we are also collecting data in small villages to try to understand the social dimension,“ Adhikary said.
While there is no scientific evidence yet about fog in the Nepal Terai, the public perception is that fog is getting more intense and lasts longer, he added.
“Existing forecasting models are from the US and don't show us the entire picture,“ said Sachin Ghude, the IIT-M coordinator for the Delhi campaign, which plans to collaborate with IIT-Bombay .“The goal,“ he said, “is to improve our understanding and fine-tune our models.“
Ozone levels
2014
The Times of India, Sep 09 2016
Jayashree Nandi 10-20% rise in ozone levels in India, harmful for lungs and crops: Report
While Indian cities are still grappling with the impacts of severe particulate matter (PM) pollution, a new report has raised the flag on ozone levels (O3) too. `The Cost of Air Pollution', a report by the World Bank and Institute of Health Metrics and Evaluation (IHME) released on Thursday , estimates that the concentrations of O3 has increased by 10 to 20% in India between 1990 and 2013. The trend is similar in neighboring countries and in Brazil, while a declining course was seen in the US and Indonesia, among others.
High ozone levels are not only associated with serious health impacts like reduced lung function, chronic obstructive pulmonary disorder (COPD), aggravating asthma and respiratory conditions, but also with widespread crop loss.
The study also estimates that total deaths due to increase in exposure to O3 increased by 50% between 1990 and 2013 in South Asia. For this report, the health and economic burden of O3 is only based on COPD incidence from it. Total deaths due to exposure to PM2.5 have also increased in South Asia during the same phase, but not as steeply as with O3.
Interestingly, even though the cost of O3 related premature deaths are far lower than that of PM2.5 (both household and outdoor), O3 associated economic or welfare losses for South Asia are equivalent to that of North America. The welfare losses due to O3 exposure are to the tune of 0.4% of gross domestic product (GDP) equivalent, the report states.If you consider man days lost, it's about 0.09% of GDP equivalent, it says.
Air quality experts said O3 could be a serious concern soon. “Even before we could deal with health damage from particulate pollution we are falling into the pincer grip of ozone pollution that damages both lungs and crops. This is also the sign that emissions of toxic gases are increasing rapidly in our country . Keep in mind that for estimating health damage from ozone this report has only considered chronic obstructive pulmonary diseases. The actual cost of health damage could be way higher,“ said Anumita Roy Chowdhury , head of Centre for Science and Environment's clean air programme.
Ozone is not directly emitted from any source, it is created by chemical reactions between oxides of nitrogen and volatile organic compounds in the presence of sunlight. It's mainly released from combustion sources which includes vehicles and industries.
A 2014 study by scientists at Indian Institute of Tropical Meteorology estimated that ozone-induced damage to wheat and rice is enough to feed roughly 35% of 270 million BPL population in India.
2016
The Times of India, Jun 02 2016
Jayashree Nandi
Some good news, some bad for 15 major cities on air quality front
A Central Pollution Control Board (CPCB) report on air quality in 15 cities shows that most cities are breaching the national annual safe standard. While some are seeing a rising trend and some, interestingly, are also showing a decreasing trend in PM 10 (coarse pollution particles) levels, the study also shows that most cities saw an improvement in 2015 compared to previous years. The CPCB concludes in its report that improvement could be linked to implementation of stricter vehicle norms and better fuel quality.
The report was compiled by the CPCB after the NGT in its February 9 order directed it to file an “analysis report“ on pollution levels in all major cities identified by the tribunal.The report is also one of the documents on the basis of which the NGT is spearheading the efforts to reduce pollution in other major cities while an air pollution case pertaining to the Capital is being heard in the Supreme Court.
The NGT asked for more air pollution data from states on Wednesday with details of major sources so that it can come up with effective solutions. The report, which com piles pollution levels from manual monitoring stations in 15 cities, shows that PM 10 levels seem to be falling in Mumbai, Pune, Ludhiana, Amritsar, Chennai while in Lucknow they are stabilising.
There are no clear trends in Bengaluru, Jalandhar, Al lahabad, Kanpur and Kolkata, but PM levels are seen increasing in Hyderabad and Varanasi. “The reason for decrease in PM 10 levels may be implementation of stricter vehicle norms (BS IV),“ the study claims. “The fluctuating trends in some cities co uld be because of vehicles, diesel gen sets, small scale industries, biomass incineration, resuspension of traffic dust and others,“ it said.
Experts, however, said the report is inadequate as it doesn't correlate PM 10 levels with vehicle numbers, establishment of new industries, introduction of cleaner fuels and other interventions.They also pointed that PM 10 is not an effective indicator for pollution caused by combustion sources like vehicles or waste burning. The CPCB should have provided with PM 2.5 data (fine, respirable pollution particles) to give a clearer picture.
BS IV was introduced in NCR, Mumbai, Kolkata, Chennai, Bengaluru, Hyderabad, Ahmedabad, Pune, Surat, Kanpur, Lucknow, Sholapur, Jamshedpur and Agra in 2010.The gradual PM 10 rise in Varanasi could be because it is still on BS III but experts said improvements in Ludhiana, Amritsar or Nagpur cannot be due to better fuel norms.
